Autism spectrum disorder (ASD) is a characteristically heterogeneous disorder, as multiple neurodevelopmental disorders are characterized by similar symptomology and behavior. Research has shown that individuals with ASD benefit from early intervention; neuroimaging data may reveal information that cannot be obtained from traditional behavioral analysis. This review discusses the use of structural MR imaging, functional MR imaging (fMR imaging), and PET in the detection of ASD. Larger datasets, standardized methods of collection and analysis, and more robust meta-analyses are required to implement the observed biomarkers and improve the lives of patients living with AUD.
Key points
- •
Structural MR imaging studies reveal that children with autism spectrum disorder (ASD) have significantly larger total brain volumes compared to controls, with notable increases in both gray and white matter, particularly in the frontal lobes.
- •
Surface-based morphometry analysis of MR imaging data indicates altered cortical thickness in individuals with ASD, with most studies showing increased thickness in the parietal lobes, which aligns with the observed increase in gray matter volume and may contribute to abnormalities in cortical connectivity.
- •
fMR imaging studies suggest that individuals with ASD demonstrate greater activation in temporal lobe structures during theory of mind tasks, while controls primarily rely on the amygdala, indicating potential amygdala abnormalities as biomarkers for ASD and supporting the theory of impaired metarepresentational ability in ASD.
- •
PET is a versatile imaging modality that employs radioactive tracers to selectively target and visualize specific compounds or neurotransmitters within the brain. In studies of ASD, PET is often utilized to examine the distribution and symmetry of serotonin, dopamine, and gamma-aminobutyric acid, as well as to assess glucose uptake and cerebral blood flow. This level of chemical and regional specificity holds promise for the development of more refined, compound-specific biomarkers for ASD.
Introduction
Autism spectrum disorder (ASD) is a prevalent neurodevelopmental disorder, a disorder with onset and diagnosis in infancy, childhood, or adolescence. Influenced both by genetic and environmental factors, ASD is characterized by diverse symptomology, including but not limited to deficits in social interaction, challenges with interpersonal communication, limited/restricted interests, and stereotyped/repetitive behaviors. The fifth installment of the Diagnostic and Statistical Manual of Mental Disorders (DSM-5) introduced the ASD diagnosis; prior editions contained diagnostic information describing multiple pervasive developmental disorder (PDD) diagnoses. With the release of the DSM-5, the American Psychiatric Association combined Asperger’s disorder, childhood disintegrative disorder, autistic disorder, and PDD not otherwise specified (PDD-NOS) into 1 umbrella diagnosis, ASD. , A recent study by Saito and colleagues in Japan, conducted in 2020 and published in Molecular Autism, determined the prevalence of ASD to be 3.22% (95% confidence interval: 2.66% – 3.76%). The study also found that 88.5% of 5-y-old children with ASD had a separate comorbid neurodevelopmental disorder, most commonly developmental coordination disorder or attention deficit hyperactivity disorder. In Western countries, as well as China, the prevalence of ASD is about 1% of school-age children. However, there is concern of under-diagnosis of children with autism. Diagnosing ASD is challenging due to its heterogeneous nature. The reliance on subjective behavioral observations introduces variability, further complicating the consistency and accuracy of early diagnoses. Additionally, the presence of comorbid conditions and the evolving nature of ASD symptoms over time can obscure the identification of the disorder, particularly in its early stages. Individuals with ASD benefit from the knowledge of their disorder and how it may affect their lives.
Currently, there is no curative treatment for ASD. Therapeutic intervention and treatment for ASD emphasizes reducing symptomology and supporting cognitive development. Early behavioral treatment and intervention often significantly improve long-term developmental outcomes. Gains from early intervention are maintained years after intense behavioral therapy. Neurologic biomarkers would prove useful and beneficial for early diagnosis and intervention. There is an extensive research regarding genetic, immune, proteomic, metabolic, electrophysiologic, physical, and neuroimaging biomarkers. This essay will review research regarding potential neuroimaging biomarkers in ASD, specifically resting-state functional MR imaging (rs-fMR imaging) connectivity, task-dependent fMR imaging activation, structural MR imaging correlates, and PET. Although the clinical application of these biomarkers is in its infancy, neuroimaging biomarkers may 1 day be incorporated in a patient’s work-up. This review will demonstrate both the potential benefit to clinical diagnosis and the hurdles neuroimaging biomarkers face in the treatment of ASD.
Structural MR imaging
Structural MR imaging is a noninvasive technique that allows researchers to examine anatomy and pathology. Unlike PET, structural MR imaging does not necessitate exposure to radiation and is thus an attractive tool for researchers and clinicians. Minimal exposure to radiation is of greater importance to child and adolescent patients/participants. MR imaging is also non-invasive and has excellent spatial resolution. While predictive modeling of ASD is in its infancy, structural MR imaging features could inform these models and improve diagnostic capability, providing clinicians with structural biomarkers, assisting in early intervention and subsequent treatment.
In certain disorders, brain volumetry differs when compared to healthy individuals. Several studies using structural MR imaging indicate that total brain volume in children with ASD is abnormally greater than controls. For example, in 2001 Courchesne and colleagues demonstrated that among boys 2 to 4 y old, 90% of those with ASD had brain volumes larger than average. Sparks and colleagues determined that the structural findings observed in children with ASD are independent of nonverbal intelligence quotient and observed an increase in total cerebral volume for both boys and girls. These changes can be observed as early as 18 mo of age. The enlargement in brain volume occurs in both gray-matter, such as the amygdala and hippocampus, and white-matter. While evidence suggests that grey-matter enlargement is not as great as white-matter enlargement, grey-matter enlargement may persist past adolescence and into adulthood. The largest increases in brain volume are observed in the frontal lobes; however, within the frontal lobes, conflicting reports imply little regional specificity of cerebral enlargement. ,
In ASD, several neuroanatomic structures are enlarged. A reduction in the volume of other structures is also observed. The volume of the corpus callosum, which connects the left and right cerebral hemispheres, is reduced in individuals with ASD. In both children and adults, all subregions of the corpus callosum are observed to be reduced. For example, Manes and colleagues utilized structural MR imaging scans to determine the size of the corpus callosum in individuals with ASD (n = 27) and in controls without the disorder (n = 17). The researchers determined that the corpus callosum was significantly smaller (most notably in the body) in individuals with ASD, while the cerebellum areas showed no difference in volume when compared with controls. The difference in corpus callosum volume was observed in both high-functioning individuals and low-functioning individuals. The volume of an individual’s corpus callosum, when compared to healthy controls, may be indicative of ASD. This consistent, measurable alteration may be a potential biomarker for ASD. Reduced white matter volume, in the largest white matter tract in the brain, could obstruct interhemispheric connectivity and contribute to ASD pathology and the developmental disabilities observed in individuals with ASD. Recent experiments conducted by Lee and colleagues utilizing resting state fMR imaging (rs-fMR imaging) data support this conclusion.
Another analytical method, surface-based morphometry (SBM), that researchers apply to MR imaging data suggests an alteration in cortical thickness in individuals with ASD. While conflicting evidence exists regarding the temporal and frontal lobes, most research indicates autistic individuals have increased cortical thickness in the parietal lobes. Increased cortical thickness suggests increased gray matter volume, which is consistent with MR imaging brain volumetry data obtained from individuals with ASD. Hardan and colleagues suggests that increases in cortical thickness influence the abnormalities in cortical connectivity observed. , Jiao and colleagues developed a successful diagnostic model for ASD, informed by regional thickness measurements, demonstrating a step forward in ASD classification and predictive modeling.
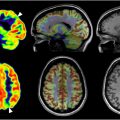
Researchers also utilize SBM to obtain a measurement of cortical folding, the gyrification index. Libero and colleagues conducted a longitudinal study that utilized structural MR imaging to determine local gyrification data in boys (at 3- and 5 y-of-age) with ASD (n = 105) and in controls without the disorder (n = 49). The researchers determined that at 3 y-of-age, boys with ASD had bilateral reductions of gyrification in the fusiform gyrus (ie, fewer folds of the cerebral cortex) compared to controls. Functionally, this region is essential in the processing of complex visual information, such as faces. There is an area of the fusiform gyrus specifically for this purpose, the fusiform face area. ASD is classically associated with a poor impairment in the processing of faces. Additionally, Libero and colleagues found that in boys with ASD, from age 3 to age 5, local indices of gyrification increased in the frontal, temporal, parietal lobes whereas in boys without ASD, local indices of gyrification were stable or decreased over the period of time. In 2014, Libero and colleagues examined age-related structural changes in ASD. The experimenters found that as individuals with ASD age, areas associated with the social brain degrade in terms of cortical thickness and gyrification ( Fig. 1 ).

Additional longitudinal research must be conducted, following subjects across adolescence and into adulthood, in order to observ neurologic development and the cortical changes associated with ASD. The results indicate that in young children, patterns of abnormal gyrification represent a potential biomarker. Resultant behavioral deviations are currently utilized in the classification and diagnosis of autism; it is for the benefit of the patients that these findings are further developed, and structural information can be utilized in diagnosis.
Functional MR imaging
Similar to structural MR imaging, functional MR imaging (fMR imaging) is a noninvasive imaging technique with good spatial resolution, utilized in preoperative planning, cognitive neuroscience research, and psychiatry. Unlike structural MR imaging, fMR imaging demonstrates changes and alterations in brain metabolism. Neural activation patterns can be inferred, as the fMR imaging provides a depiction of deoxyhemoglobin concentration (Blood Oxygen Level Dependent, or BOLD) or local cerebral blood flow (CBF). While structural MR imaging captures neuroanatomy with superior spatial resolution, fMR imaging provides information regarding temporal resolution and, in the case of task activation fMR imaging studies, can assist researchers in understanding the relationship between neural structure, behavior, and cognitive process. fMR imaging activation can be measured as the subject performs a task (task-dependent fMR imaging) or to determine functional connectivity between spatially remote anatomic areas, observing resting state network properties (rs-fMR imaging). Research has shown that individuals with autism and typically developing controls have differences in functional connectivity between widespread brain regions (eg, the default mode and executive control networks). Biomarkers generated from these networks, along with information obtained from task-dependent fMR imaging experiments, can bridge basic and clinical science research, assisting clinicians in diagnosis and treatment.
With the development of fMR imaging, Biswal and Raichle measured the BOLD signal, influenced by physiologic blood-flow, to determine that spatially and physiologically distributed brain regions can operate in concert. A substantial portion of cognitive neuroscience research rests on the assumption and observation that distant regions within the brain with correlated activity are part of the same functional network. rs-fMR imaging is an imaging method in which the participant’s brain is scanned while no explicit task is performed. The default network (the medial frontoparietal network) is one of many resting state networks thought to be active when the participant is awake and at rest. , ASD is one disease condition that results in altered resting state functional connectivity. The patterns observed may one day have significant clinical applications, as the data obtained from rs-fMR imaging could obtain prognostic and diagnostic information about the patient and pathologically relevant knowledge about the disease course.
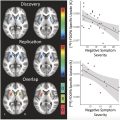
Today, ASD is diagnosed primarily based on patient and parent interviews. Behavioral assessments are a vital component of the process; however, behaviorally asymptomatic at-risk groups exist, and the modern medical pipeline may indirectly delay or preclude treatment in select situations. Researchers argue that the incorporation of rs-fMR imaging data in a work-up and the establishment of neural biomarkers could provide additional helpful information that clinicians may utilize when making a diagnosis. In a meta-analysis conducted by Lau and colleagues, it was determined that resting-state local connectivity was reduced in individuals with ASD (n = 224) when compared to control participants (n = 220). It was shown that in multiple studies, subjects with ASD demonstrated lower resting-state local connectivity in the dorsal posterior cingulate cortex (PCC) and right medial paracentral lobule. The consistent evidence of a neural pattern is promising. The underconnectivity observed can be utilized as a biomarker, providing patients, physicians, and neuroscientists with more knowledge about ASD. ( Fig. 2 )

While most fMR imaging research conducted on subjects with ASD has focused on functional connectivity, determining the interaction between different neural networks, task-based fMR imaging data have also been collected and can be utilized in the development of neuroimaging biomarkers for ASD. For example, Allen and colleagues analyzed fMR imaging activation during a motor task to determine cerebellar function in autism. The simple motor task was performed with 8 ASD subjects and included pressing a button in a go-nogo paradigm. The experimenters determined that relative to controls, subjects with ASD displayed increased activation in the ipsilateral anterior cerebellar hemisphere, suggesting a disfunction of the cerebellum in individuals with ASD. The researchers reported that increased activation of this region was correlated with structural abnormality. , Coupled with recent evidence demonstrating the cerebellum’s involvement in emotional and cognitive processing, the conclusion that cerebellar abnormality begets autism symptomology is not far-fetched. It is possible that one day clinicians will use a standard motor task and fMR imaging to generate biomarkers and obtain informations regarding a patient’s neurocognitive performance.
In a landmark 1999 study, conducted by Baron-Cohen and colleagues, utilized fMR imaging to validate the amygdala theory of autism and better define ASD. Subjects with ASD (n = 6) and subjects in the control group (n = 12) participated in a gender recognition task (Task A) and a theory of mind task (Task B). The experimenters were able to infer neurologic activity associated with emotion processing in healthy controls and subjects with ASD. Controls performed better in both the gender recognition task and the theory of mind task. In the theory of mind task, it was shown that individuals with ASD display greater activation in temporal lobe structures, while controls utilize the amygdala (hypothesized to be integral to the identification and processing of emotional information). The study is frequently cited as support for the hypothesis that individuals with ASD have impaired metarepresentational ability, and therefore a diminished proficiency in theory-of-mind. In the literature, the abnormal development and function of the amygdala is consistently associated with ASD. Amygdala volume and connectivity is a candidate biomarker for ASD and the disorder’s severity. Large longitudinal cohorts are required to determine the practicality, accuracy, and utility of using fMR imaging data for clinical purposes. These findings suggest that to compensate for amygdala dysfunction, autistic patients may use both language and facial memory functions to solve tasks.
PET
PET is a metabolic imaging modality that enables clinicians to track and compare particular brain regions involved in synthesis, transportation, and metabolism of specific molecules. PET is highly adaptable, as it makes use of radioactive tracers, which can be used to highlight a chosen compound or neurotransmitter. Typically, PET studies on autistic patients focus on the locations and symmetry of serotonin, dopamine, and gamma-aminobutyric acid (GABA) in the brain, though glucose uptake and CBF are often also monitored. This chemical and regional specificity may enable researchers to establish more rigorous, compound-specific biomarkers for ASD.
The neuromodulator molecule dopamine is frequently the subject of ASD neuroimaging studies and is most often modeled through the use of its precursor l -DOPA. In a study by Ernst and colleagues, fluorodopa ([ 18 F]FDOPA) was employed due to its capability to model dopaminergic terminal behavior as a radiolabeled version of the precursor. [ 18 F]FDOPA PET detected a 39% reduction in uptake in the anterior medial prefrontal cortex. This may be in part responsible for the cognitive impairments observed in autistic individuals. Nakamura and colleagues measured the dopamine transporters (DAT) of high-functioning ASD males and neurotypical males using [ 11 C]-labeled 2 β -carbomethoxy-3- β -(4-fluorophenyl) tropane ([ 11 C]WIN35,428). Males with ASD were found to have greater binding of DAT in the orbitofrontal cortex. This binding had a negative correlation with the binding of SERT, the serotonin transporter, in this region. Kubota and colleagues studied the differences between behavior of the dopamine D 1 receptor in autistic subjects (n = 18) and non-autistic subjects (n = 20) using [ 11 C]SCH23390 PET. The authors reported no differences in uptake between experimental groups in the anterior cingulate cortex, temporal cortex, and striatum though a negative correlation was found between uptake and attention-to-detail scores. A positive correlation was also found between uptake and emotional perception scores.
Due to its diverse mechanism in cognition, serotonin has been continually studied in the search for ASD biomarkers. In 1961, Schain and Freedman were the first researchers to recognize a relationship between elevated blood serotonin levels and a diagnosis of autism in children compared to non-autistic, intellectually disabled children. Chugani and colleagues utilized PET with α-[ 11 C]methyl-L−tryptophan (AMT), the radiolabeled serotonin precursor, in an effort to model global serotonin synthesis in autistic and non-autistic children over time. The authors found that autistic children have a serotonin synthesis capacity that increases from the 2 y of age to 15 y of age with changes plateauing at that point to 1.5 times that of adults. On the other hand, non-autistic children have a serotonin synthesis capacity 2 times that of adults up until 5 y of age, where levels decrease until reaching values typical of adults. In a prior AMT PET study of 8 autistic children (7 male, 1 female), Chugani and colleagues reported asymmetrical serotonin synthesis in the 7 males with 5 showing decreased synthesis in the left frontal cortex and thalamus while the other 2 showed decreased synthesis in the right frontal cortex and thalamus. All males displayed increased synthesis in the opposite dentate nucleus from where the decreased synthesis was noted. The authors note the significance of these structures to language production and sensory organization, cognitive functions that are often altered in autistic patients.
Chandana and colleagues also employed AMT PET to examine serotonin synthesis, with particular regard to cortical asymmetry. The researchers reported 55% of the autistic children showing abnormal cortical asymmetry with 48% of those subjects displaying left cortical hemisphere decreases, 45% with right cortical hemisphere decreases, and 6% with bilateral cortical decreases. AMT uptake decreases were notable in the frontal cortex and temporal and parietal lobes. Autistic children with AMT uptake decreases in the left cortical hemisphere were found to be statically significantly more likely to have severe speech impairment compared to autistic children with decreases in the right cortical hemisphere ( P =.002). In a PET study with the radioligand [ 11 C](+)McN-5652), Nakamura and colleagues found that serotonin transporters had statistically significantly lower binding in the brains of autistic subjects, particularly in the anterior and posterior cingulate cortices ( P <.05). The authors also reported a significant relationship between obsessive behavior and reduced binding of the serotonin transporter in the thalamus ( P <.05).
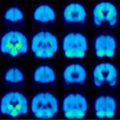
Beversdorf and colleagues examined the role of the 5-HT 2 receptor in autistic cognition compared to its role in the cognitive capabilities in non-autistic subjects. The authors utilized [ 18 F]-labeled setoperone, the ligand for the 5-HT 2 receptor, in conjunction with PET and measured decreased thalamic binding in autistic subjects compared to controls. An inverse correlation between thalamic binding and linguistic disorders in autistic was also observed. ( Fig. 3 ) Girgis and colleagues found that individuals with Asperger’s Disorder, now a subcategory of ASD, did not have statistically significant differences in regional binding at 5-HT 2A receptors or serotonin transporters as measured by [ 11 C]MDL 100907 PET and [ 11 C]DASB PET.

Related posts:
 Metabolic Brain PET Connectivity
Movement Disorders and Its Variants
Metabolic Brain PET Connectivity
Movement Disorders and Its Variants
 A Brief History and the Use of PET in the Diagnosis and Management of Schizophrenia
 Brain PET Imaging in the Presurgical Evaluation of Drug-Resistant Focal Epilepsy
 Clinical Applications of PET Imaging in Alzheimer’s Disease
Brain Tumor Assessment
Clinical Applications of PET Imaging in Alzheimer’s Disease
Brain Tumor Assessment
Stay updated, free articles. Join our Telegram channel

Full access? Get Clinical Tree


