Abstract
Objective
To determine the CEUS parameters that predict the likelihood of postoperative EAD.
Methods
Clinical and imaging data for 75 pairs of donors and recipients collected between September 2022 and July 2023 were retrospectively analyzed. Subjects were divided into those with early allograft dysfunction (EAD) and those without EAD. The liver parenchyma was selected as the region of interest to plot the CEUS time–intensity curve. CEUS parameters were compared between the two groups.
Results
Peak intensity, area under the curve (AUC), and cholinesterase values were significantly lower in the EAD group than in the non-EAD group. The hepatic arterial–portal arrival interval (APAI) and aspartate aminotransferase level were significantly higher in the EAD group. Multivariate logistic analysis identified the APAI to be an independent risk factor for EAD (odds ratio 0.755; 95% confidence interval 0.577–0.989; p = 0.041). Receiver-operating characteristic curve analysis showed that the prediction probability P, which represents a combination of CEUS and clinical data, was best able to predict EAD (AUC 0.802; 95% confidence interval 0.679–0.926; p < 0.0001). Comparison of the AUC for prediction probability P and each single parameter identified statistically significant differences between the predicted probability P and aspartate aminotransferase and cholinesterase values ( p = 0.042 and p = 0.020, respectively).
Conclusion
A longer APAI can be used as a biomarker to predict EAD after brain-dead donor liver transplantation. CEUS could be a valuable tool for assessment of donor livers and identifying recipients potentially at risk of developing postoperative EAD.
Introduction
Liver transplantation is widely accepted as the most effective treatment for end-stage liver disease. In recent years, the number of patients waiting for liver transplantation has been increasing, and organ shortage has become an urgent problem that restricts the development of transplantation worldwide. Although liver transplantation has brought hope to many patients with end-stage liver disease, the complexity of liver transplantation surgery leads to postoperative complications that affect the quality of life of recipients and long-term survival of grafts.
Early allograft dysfunction (EAD) is a significant early complication of liver transplantation [ ]. EAD has been shown to be associated with an inferior post-transplantation prognosis and to negatively affect survival of both the graft and the recipient [ ]. Many researchers have investigated factors related to EAD after liver transplantation. Although sample data vary from center to center, the occurrence of EAD appears to be multifactorial and to depend on the unique characteristics of both the graft and recipient [ ]. The risk factors for EAD can be broadly divided into donor graft, recipient, and surgical factors [ ]. Our review of the substantial literature on risk factors for EAD has identified several donor characteristics to be independent risk factors for EAD after liver transplantation [ , ].
Previous studies have often used ultrasound as a first-line imaging method to screen for and identify common liver diseases, evaluate incidentally discovered focal liver lesions, and monitor patients with chronic liver diseases [ , ]. The interobserver agreement for basic grayscale ultrasound is relatively poor owing to its subjective nature [ ]. Contrast-enhanced ultrasound (CEUS), which involves injection of a contrast agent into a peripheral vein to enhance the backscatter of blood and display microvascular structures in liver tissue [ , ], is more widely used than contrast-enhanced computed tomography or magnetic resonance imaging in the field of liver transplantation. There is some literature indicating that ultrasound and CEUS are useful for monitoring and evaluating changes in hepatic hemodynamics and the extent of donor liver damage after brain death [ , ]. However, research on whether preoperative imaging evaluation can predict the likelihood of postoperative EAD has been limited [ ].
In this study, we quantitatively analyzed differences in the perfusion status of the liver parenchyma between donor livers with and without EAD using the CEUS time–intensity curve in the hope of identifying CEUS parameters that predict the likelihood of postoperative EAD.
Materials and methods
Data collection
The study had a single-center retrospective design and was approved by the Institutional Review Board of the Affiliated Hospital of Qingdao University (IRB approval number: QYFYWZLL 28150). All grafts were sourced from brain-dead donors. Before organ donation, consent was obtained from the donor or their family. Details of the examinations required were explained to the families of all donors, and written informed consent was obtained in accordance with the principles of the Declaration of Helsinki (Edinburgh Revision, 2000).
Clinical and imaging data collected between September 1, 2022 and July 31, 2023 for patients who received liver transplantation were reviewed to identify those who met our study eligibility criteria. The inclusion criteria were as follows: ultrasound and CEUS examinations completed for the brain-dead donor on the same day as surgery to harvest the liver; recipient underwent whole liver transplantation at our hospital; and CEUS image stacks recorded in DICOM format available. The following exclusion criteria were applied: age younger than 18 years; corresponding recipient underwent split liver or multiple organ transplantation; CEUS image quality too poor for analysis. The study enrollment process is summarized in Figure 1 .

Information was collected on the following variables previously mentioned in the literature to be potential risk factors for EAD: donor characteristics (including age, sex, blood type, length of stay in the ICU), 24-hour preoperative laboratory indicators (including γ-glutamyl transpeptidase, serum creatinine, and hemoglobin), intraoperative data (including operation time, anhepatic phase, and cold ischemia time), and recipient characteristics (including age, sex, and blood type). Noteworthy is that our center obtains donor liver tissue for biopsy during the operation. And the degree of steatosis was graded and recorded based on the pathology results.
The study participants were divided into those who developed EAD (the EAD group) and those who did not (the non-EAD group). EAD was defined as the presence of one or more of the following [ ]: bilirubin >10 mg/dL on day 7 after liver transplantation; an international normalized ratio >1.6 on day 7 after liver transplantation; and an aspartate aminotransferase (AST) or alanine aminotransferase level >2000 U/L within the first 7 days after liver transplantation.
US and CEUS examinations
Ultrasound and CEUS were performed by a trained radiologist with 6 years of experience who was unaware of the clinical information and test results for the donors. All donors underwent ultrasound and CEUS examinations while maintaining stable vital signs after brain death. The study data were obtained using an iU Elite Ultrasound system (Philips Healthcare, Eindhoven, Netherlands) with a C5-1 transducer. The ultrasound scanning protocol consisted of both grayscale ultrasound and Doppler ultrasound. Grayscale ultrasound was performed to observe liver size, echotexture of the hepatic parenchyma, and presence of tumors in the liver. Doppler ultrasound was performed to explore vascularity in vascular structures. During the ultrasound examinations, hepatic artery resistive index, systolic acceleration time in the hepatic artery, portal venous flow, and portal venous velocity were measured and recorded.
In the subsequent CEUS examination, the same examiner performed a longitudinal scan of the liver parenchyma via a right intercostal approach, clearly identifying the main portal vein, right branch, and liver parenchyma. The probe was fixed in the long-axis section of the right branch of the portal vein, after which the examiner switched to the dual-phase contrast imaging mode and used a low mechanical index (0.06). A bolus injection of a second-generation contrast agent (SonoVue; Bracco, Milan, Italy) diluted in 2.0 mL of saline was administered via a peripheral vein, followed by 5.0 mL of saline solution. The timer was started at the same time as injection of the contrast agent, and dynamic perfusion of the liver was recorded for at least 2 minutes. Injection of the contrast agent was repeated, the entire liver was scanned dynamically, and any areas of abnormal enhancement were observed.
Imaging analysis
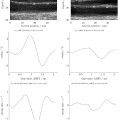
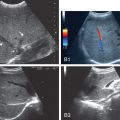
Dynamic imaging data were extracted in DICOM format using QLAB software (Philips Healthcare). One of the radiologists, who was blinded to all clinical information, independently analyzed the images and video recordings. The regions of interest (ROIs) in the liver parenchyma were 3 cm below the liver capsule and major intrahepatic vessels; they were located at a similar depth to minimize the effect of ultrasound beam attenuation. We obtained a time–intensity curve in the arterial phase for 2 minutes at each ROI and measured the ascending slope, time to peak, peak intensity (PKI), area under the curve (AUC), mean transition time, and rising time. The mean values of the parameters in the three ROIs were calculated for statistical analysis. Owing to the lack of inconsistency in the peripheral vein selected for injection of contrast agent, the interval between the first arrival time in the hepatic artery and the first arrival time in the portal vein was selected as the reference index, which we defined as the hepatic arterial–portal arrival interval (APAI) as follows: first arrival time of portal vein − first arrival time of hepatic artery [ ] ( Fig. 2 ).

Statistical analysis
Continuous variables are summarized as the mean ± standard deviation or as the median (interquartile range). Categorical variables are shown as the count (percentage). Differences in quantitative variables were compared between groups using the t -test and the Wilcoxon test. Between-group differences in qualitative variables were compared using the chi-squared test or Fisher’s exact test. Risk factors were examined in univariate analysis, and variables with a p value <0.05 were entered into a multivariate logistic regression model. The best cut-off value was determined by receiver-operating characteristic (ROC) curve analysis with calculation of sensitivity and specificity. The statistical analysis was performed using SPSS software (version 27.0; IBM Corp., Armonk, NY, USA). All tests were two-sided, and a p value <0.05 was considered statistically significant.
Results
We collected data for 142 potential donors. Four donor livers were discarded because of severe fatty liver or hepatocellular carcinoma, and 18 were in donors who were transferred to other hospitals. Finally, 120 patients underwent liver transplantation at our center during the study period, 92 of whom met the eligibility criteria for this study. Twenty of these 92 patients were excluded because of pediatric liver transplantation, split liver transplantation and multiple organ transplantation, leaving 72 patients for inclusion in the study. CEUS examination of the 72 donor livers identified 6 cases of hepatic hemangioma and 8 of liver cysts, all of which were documented. Sixteen recipients were diagnosed with EAD within the first 7 days after liver transplantation and were allocated to the EAD group with their corresponding donors. The remaining recipients were allocated to the non-EAD group ( Fig. 1 ). In our cohort of 72 patients, the incidence of EAD was 22.2%.
The cause of brain death in the donors in the EAD group (13 men, 3 women; aged 50.2 ± 12.7 years) varied, with the most common being cerebral hemorrhage (n = 10; 62.5%). Cerebral hemorrhage (n = 22; 39.3%) and traumatic brain injury (n = 21; 37.5%) were the most common causes of death in the non-EAD group (43 men, 13 women; 54.8 ± 12.8 years). The proportion of donor livers without hepatic steatosis was similar between the two groups. Liver function tests showed that the AST was significantly higher in the EAD group than in the non-EAD group (52.5 U/L vs. 32.0 U/L, p = 0.045) and that the cholinesterase (ChE) level was significantly lower in the EAD group (3473.4 U/L vs. 4318.6 U/L, p = 0.039). The recipient’s MELD score was slightly higher and the operation time and anhepatic phase were slightly longer in the EAD group than in the non-EAD group, but the differences were not statistically significant. There were no statistically significant between-group differences in the recipient or surgical data. The patient details are summarized in Table 1 .
| EAD (n = 16) | non-EAD (n = 56) | OR (95% CI) | p | |
|---|---|---|---|---|
| Donor data | ||||
| Sex (Female) | 3 (18.8%) | 13 (23.2%) | 0.763 (0.188,3.096) | 0.705 |
| Age (years) | ||||
| <45 | 6 (37.5%) | 12 (21.4%) | 2.200 (0.665,7.279) | 0.190 |
| ≥45 | 10 (62.5%) | 44 (78.6%) | ||
| Blood Type | ||||
| Match | 14 (87.5%) | 51 (91.1%) | 0.686 (0.120,3.922) | 0.672 |
| Nonmatch | 2 (12.5%) | 5 (8.9%) | ||
| BMI (kg/m²) | 23.9 ± 2.3 | 24.1 ± 4.0 | 1.015 (0.872,1.181) | 0.850 |
| Cause of brain death | ||||
| Cerebral hemorrhage | 10 (62.5%) | 22 (39.3%) | – | 0.386 |
| Traumatic brain injury | 4 (25.0%) | 21 (37.5%) | ||
| Hypoxic-ischemic brain damage | 1 (6.3%) | 4 (7.1%) | ||
| Cerebral infarction | 1 (6.3%) | 9 (16.1%) | ||
| ICU stay (h) | 124.5 (87.5,160.5) | 116.0 (79.0,161.0) | 1.000 (0.992,1.009) | 0.947 |
| Weight of donor liver (g) | 1525.0 (1415.0,1895.0) | 1495.0 (1284.7,1827.5) | 0.999 (0.997,1.000) | 0.143 |
| Degree of hepatic steatosis | ||||
| Normal | 11 (68.8%) | 39 (69.6%) | – | 0.739 |
| Mild | 4 (25.0%) | 15 (26.8%) | ||
| Moderate | 1 (6.3%) | 1 (1.8%) | ||
| Severe | 0 (0.0%) | 1 (1.8%) | ||
| ALT (U/L) | 52.5 (21.8,122.8) | 32.0 (19.0,66.5) | 0.995 (0.990,1.000) | 0.051 |
| AST (U/L) | 84.0 (44.8,159.5) | 54.0 (29.8,89.8) | 0.995 (0.991,1.000) | 0.045 |
| TBiL (μmol/L) | 22.1 (15.3,40.5) | 18.3 (13.6,23.4) | 0.985 (0.966,1.004) | 0.118 |
| Scr (μmol/L) | 67.2 (37.2,143.9) | 58.7 (38.7,79.8) | 1.001 (0.997,1.005) | 0.766 |
| HSA (g/L) | 39.8 ± 4.3 | 39.6 ± 5.1 | 0.993 (0.886,1.112) | 0.901 |
| ChE (U/L) | 3473.4 ± 1368.5 | 4318.6 ± 1355.3 | 1.000 (1.000,1.001) | 0.039 |
| GGT (U/L) | 38.0 (21.3,70.0) | 35.0 (17.3,74.3) | 0.999 (0.993,1.006) | 0.867 |
| LDH (U/L) | 351.5 (230.0,791.8) | 248.5 (207.3,395.0) | 0.999 (0.997,1.001) | 0.205 |
| Na (mmol/L) | 139.5 (136.8,143.3) | 140.1 (138.2,143.5) | 0.993 (0.905,1.090) | 0.883 |
| HB (g/L) | 94.7 ± 23.3 | 94.9 ± 20.6 | 1.000 (0.974,1.027) | 0.981 |
| PLT (10×109) | 104.0 (48.8,204.8) | 175.0 (93.8,275.5) | 1.006 (1.000,1.012) | 0.052 |
| PO2 (mmHg) | 160.5 (123.3,193.5) | 162.0 (134.0,190.3) | 1.005 (0.994,1.016) | 0.389 |
| INR | 1.3 (1.1,1.4) | 1.1 (1.0,1.3) | 0.325 (0.029,3.655) | 0.362 |
| Recipient data | ||||
| Sex (Female) | 1 (6.3%) | 14 (25.0%) | 5.000 (0.605,41.352) | 0.135 |
| Age (years) | 51.0 (46.5,55.7) | 54.0 (47.0,60.0) | 1.052 (0.986,1.123) | 0.122 |
| BMI (kg/m²) | 22.1 (20.8,27.1) | 24.2 (21.8,28.1) | 1.061 (0.933,1.207) | 0.365 |
| Cause of LT | ||||
| Tumor | 10 (62.5%) | 24 (42.9%) | – | 0.196 |
| Cirrhosis/hepatic failure/fulminant hepatitis | 5 (31.2%) | 31 (55.3%) | ||
| Others | 1 (6.3%) | 1 (1.8%) | ||
| MELD∗ | 15.5 (10.5,26.2) | 14.0 (10.0,21.0) | 0.964 (0.904,1.029) | 0.276 |
| Child-Pugh | 7.5 (6.2,8.0) | 7.0 (6.0,8.0) | 1.067 (0.778,1.465) | 0.687 |
| Surgical data | ||||
| Duration of surgery (min) | 560.5 (468.7,672.5) | 480.0 (431.2,577.5) | 0.997 (0.992,1.001) | 0.136 |
| An-hepatic phase (min) | 43.0 (36.5,60.5) | 42.5 (35.0,52.7) | 0.975 (0.940,1.012) | 0.185 |
| Cold ischemic time (min) | 285.0 (261.7,312.0) | 287.0 (247.0,350.2) | 1.002 (0.992,1.012) | 0.707 |
| Amount of blood loss (mL) | 900.0 (500.0,1000.0) | 500.0 (500.0,800.0) | 0.999 (0.998,1.001) | 0.330 |
| Surgical modality | ||||
| Classic Orthotopic LT | 15 (93.8%) | 52 (92.9%) | 1.154 (0.120,11.117) | 0.901 |
| Ameliorated piggyback LT | 1 (6.3%) | 4 (7.1%) | ||
| Biliary duct anastomosis | ||||
| Duct to duct | 13 (81.2%) | 52 (92.9%) | 0.333 (0.066,1.677) | 0.183 |
| Roux-en-Y | 3 (18.8%) | 4 (7.1%) |
Related posts:
 Sonosensitizers for Sonodynamic Therapy: Current Progress and Future Perspectives
 Safety of Shear Wave Elastography as Evidenced From Carotid Artery Strain and Strain Rate Induced by Acoustic Radiation Force Impulse and Arterial Pulsations
 SegFormer3D: Improving the Robustness of Deep Learning Model-Based Image Segmentation in Ultrasound Volumes of the Pediatric Hip
 A Bi-modal Temporal Segmentation Network for Automated Segmentation of Focal Liver Lesions in Dynamic Contrast-enhanced Ultrasound
 Endotracheal tubes
 Conventional ultrasound findings in chronic liver disease
Stay updated, free articles. Join our Telegram channel

Full access? Get Clinical Tree


