Abstract
Objective
To explore the value of RF-data-based quantitative analysis on vessel stiffness (R-QVS) combined with dynamic vector flow imaging (VFI) in evaluating structural and functional changes in the carotid arteries of patients with type 2 diabetes mellitus (T2DM).
Methods
A prospective study was conducted between October 2022 and April 2024, including 275 consecutive subjects (50 volunteers as controls, 108 patients with T2DM and normal carotid intima-media thickness (CIMT), and 117 patients with T2DM and thickened CIMT). Carotid intima-media thickness (IMT) was measured using real-time intima-media thickness (RIMT) technology, while R-QVS was employed to measure the systolic diameter (Diam), displacement (Dist), hardness coefficient (HC), and pulse wave velocity (PWV) of the distal segment of the carotid artery. VFI was used to measure the maximum wall shear stress (WSS max ), mean wall shear stress (WSS mean ), and maximum instantaneous velocity (V max ) of the vessel wall. Differences in ultrasound parameters among the three groups were compared, and receiver operating characteristic (ROC) curves were plotted to calculate the area under the curve (AUC), evaluating the efficacy of these parameters in assessing structural and functional changes in the carotid arteries of patients with T2DM.
Results
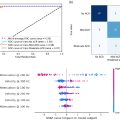
There were statistically significant differences in carotid IMT, Diam, Dist, HC, PWV, WSS max , and Vmax among the three groups (all p < 0.01). The AUCs for evaluating structural and functional changes in the carotid arteries of patients with T2DM using carotid ultrasound parameters Diam, Dist, HC, PWV, WSS max , and V max were 0.64, 0.68, 0.83, 0.88, 0.86, and 0.82, respectively. Multiple linear regression analysis identified Dist., HC, PWV, WSS max , and WSS mean as influencing factors for CIMT in T2DM patients (with β values of -0.406, 0.515, 0.564, -0.472, and -0.438, respectively; all p < 0.05).
Conclusion
R-QVS and VFI techniques contribute to the early assessment of structural and functional changes in the carotid arteries of patients with type 2 diabetes mellitus. Compared with controls, T2DM patients exhibit more advanced functional changes than morphological changes despite normal CIMT. The enhanced sensitivity, reproducibility, and detailed assessment capabilities of these methods make them valuable tools in the early detection and intervention of cardiovascular risk in T2DM.
Introduction
Type 2 diabetes mellitus (T2DM) represents a persistent and highly varied condition, influenced by multiple factors and characterized by both inherited and acquired insulin resistance, alongside disturbances in insulin secretion both qualitatively and quantitatively. The global prevalence of diabetes mellitus among adults has escalated from 4.7% in 1980 to 8.5% in 2014. Notably, in high-income countries, the incidence of undiagnosed diabetes patients can be as high as 30% [ ]. T2DM stands as a significant risk factor for atherosclerosis and cardiovascular events. Atherosclerosis, a systemic arterial disease, results from arterial degeneration, calcification, and fibrous tissue proliferation, culminating in plaque formation [ ]. Consequently, individuals with T2DM are predisposed to cardiovascular incidents such as myocardial infarction and an increased risk of complications, including sudden death, often missing the optimal window for intervention. Atherosclerosis encompasses a complex process involving both morphological thickening and functional stiffening of arterial walls [ ].
Historically, research primarily relied on high-frequency ultrasound to detect structural changes in carotid arteries, serving as a common method for assessing carotid atherosclerosis. These assessments reveal intimal thickening, luminal narrowing or occlusion, and the formation of atherosclerotic plaques. Further, quantification via IMT monitoring has been pivotal in observing the development of atherosclerosis [ , ]. Despite lipid accumulation and smooth muscle proliferation contributing to morphological alterations, the manifestation of atherosclerosis, evident through IMT thickening and plaque formation, signifies disease progression to an advanced stage, where even with intervention, reversal is unlikely. Prospective studies demonstrate that less than 20% of T2DM patients exhibit significant macrovascular changes nine years after diagnosis, often due to the absence of typical clinical symptoms of atherosclerosis in the early stages of diabetes. In cases where IMT remains unchanged and plaque formation is absent, vascular alterations may not be apparent [ ].
CIMT serves as a well-established surrogate marker for evaluating morphological changes and predicting future cardiovascular events [ , ]. However, recent consensus guidelines suggest that CIMT is not recommended for assessing the risk of initial cardiovascular events [ ]. Additionally, regarding T2DM, one study revealed that CIMT progression cannot reliably serve as a surrogate endpoint in clinical trials [ ]. These conflicting findings may stem from variations in measurement protocols, as slight differences in IMT measurements between assays can obscure actual morphological changes.
Recently introduced, R-QVS provides a more objective and sensitive assessment of vascular elasticity by measuring parameters such as the HC and PWV [ ]. PWV reflects the ratio of the distance between two predetermined points on the vessel surface to the corresponding time taken by the pulse wave to traverse this distance. As a novel technique for assessing vascular function, PWV sampling rates can reach up to 2000 Hz/s, enabling the detailed recording of pulse wave details spanning 2‒3 cardiac cycles and propagating within 5 cm. Moreover, by recording probe-to-arterial wall relative velocity and displacement in red and blue, and processing data at speeds of 3 GB/s, PWV accurately reflects carotid artery wall elasticity, allowing timely assessment of carotid arterial elasticity. Furthermore, PWV serves as an independent predictor of early cardiovascular risk and prognosis, reflecting changes in vascular wall elasticity function earlier in the progression of atherosclerosis, making it a valuable tool for early assessment of cardiovascular risk and prognosis [ , ].
Doppler ultrasonography is conventionally employed to identify abnormal blood flow patterns. However, conventional Doppler techniques are limited to assessing the axial component of blood flow velocity and are angle-dependent [ , ]. A novel method, Vector Flow Imaging (VFI), provides multidimensional angle-independent estimates of flow velocity, quantitatively evaluating velocity vector amplitude and direction at any location within a vessel [ , ]. High frame rate VFI, based on plane wave imaging, enables dynamic visualization of complex flow patterns, including transient events otherwise undetectable. VFI allows real-time assessment and quantification of complex arterial flow patterns, overcoming limitations associated with conventional Doppler-generated datasets [ , ].
To our knowledge, there have been no reports on the changes in carotid artery structure and function in patients with type 2 diabetes using quantitative analysis on vessel stiffness combined with vector flow imaging. In the present study, we aimed to assess the value of R-QVS and VFI in evaluating changes in carotid artery structure and function in patients with type 2 diabetes. Additionally, we compared the changes in carotid artery stiffness and blood flow between three groups: type 2 diabetes patients with and without carotid artery plaques and a normal control group. This study seeks to explore early predictive indicators of carotid artery changes in type 2 diabetes through the utilization of R-QVS and VFI, providing guidance for early vascular intervention in type 2 diabetes.
Materials and methods
Study population
This prospective study received approval from the institutional review board, and written informed consent was obtained from all patients. We estimated that a sample size of 90 patients, with 18 independent variables and using a 5 events per variable (5 EPV) rule for multivariate linear regression analysis, would provide more than 99% power to detect between-group differences. Between October 2022 and April 2024, the endocrine department of the medical center recruited 653 patients diagnosed with established T2DM to undergo carotid ultrasound examinations using RIMT. Subsequently, R-QVS and VFI data were collected from all patients. T2DM was diagnosed according to the criteria outlined by the American Diabetes Association [ ]. A total of 428 patients were excluded based on predefined exclusion criteria ( Fig. 1 ). Plaque was defined as a focal region with maximal IMT ≥ 1.5 mm [ ]. Of the remaining patients, 108 individuals with normal CIMT were classified into T2DM group 1, while 117 patients with thickened IMT were classified as T2DM group 2. The upper limit values of normal CIMT were defined as less than the upper 90th percentile of CIMT obtained from 24,871 healthy individuals categorized by age and gender groups [ ]. The study also enrolled 50 healthy volunteers (control group) who visited the hospital for physical examination during the same period. All volunteers exhibited normal CIMT and were free from plaque, diabetes, hypertension, hyperlipidemia, cardiovascular or cerebrovascular diseases, chronic kidney disease, and arrhythmias.

Exclusion criteria included: (i) Individuals with a history of myocardial infarction, heart failure, structural heart disease (including clinically significant valvular heart disease such as aortic valve disease), cardiomyopathy, severe arrhythmias, stroke, or prior cardiovascular surgery; (ii) Patients with other autoimmune diseases or peripheral vascular diseases; (iii) Chronic kidney disease or diabetic nephropathy; (iv) Smokers or heavy alcohol drinkers; (v) Chronic kidney disease or diabetic nephropathy; (vi) Individuals with malignancies; (vii) Subjects with poor image quality or those unable to complete the examination.
Ultrasound measurement of CIMT
CIMT is characterized as the region of tissue extending from the luminal-intimal interface to the media-adventitia interface of the common carotid artery (CCA). Given that B-mode ultrasonography provides a safe, noninvasive, and cost-effective method for assessing CIMT, this study further delineated CIMT as the double-line pattern observed via real-time intima-media thickness imaging ( Fig. 2 ) . This pattern consists of two parallel echogenic lines representing the junction of the vessel lumen with the intima and the interface between the media and adventitia.

Equipment and methodology
This study employed the Mindary Resona R9S color Doppler ultrasound diagnostic instrument, equipped with a frequency range of 3.8‒11.8 MHz L14-3 WU superficial probe, and configured with holographic software for real-time intima-media thickness (RIMT), R-QVS, and VFI analysis. Participants were instructed to rest in a supine position for 10 min before measurements of systolic (SBP) and diastolic (DBP) pressures of the left and right brachial arteries were taken using an electronic blood pressure monitor. A senior physician with five years of ultrasound diagnostic experience sequentially scanned both sides of the carotid arteries. The RIMT sampling frame was placed 1.0‒2.0 cm below the bifurcation of the carotid artery to automatically obtain the maximum and mean intima-media thickness (TMT) values over six cardiac cycles. The R-QVS program was initiated to automatically obtain the Diam, Dist, and mean values of the systolic phase of the left and right carotid arteries over six cardiac cycles, from which the carotid artery HC and PWV were generated based on the SBP and DBP of the left and right brachial arteries. Using the VFI mode, measurements were taken of the WSS max , WSS mean , and V max of the posterior wall of both carotid arteries, repeated three times and averaged.
Finally, a random sample of 30 participants was selected from the entire cohort, and the same parameters were measured again by the senior physician and another senior physician with two years of ultrasound diagnostic experience using the same methodology.
Clinical parameters
Total cholesterol (TC), triglycerides (TG), high-density lipoprotein (HDL), low-density lipoprotein (LDL), fasting blood glucose (FBG), and glycated hemoglobin A1c (HbA1c) are recorded for each group.
Statistical analysis
The statistical analysis was conducted using SPSS 26.0 statistical analysis software. Normally distributed continuous data were described using mean ± standard deviation (x̅±s), while non-normally distributed continuous data were described using median (interquartile range). For normally distributed data, one-way analysis of variance (ANOVA) was employed for comparisons among multiple groups, followed by post-hoc pairwise comparisons using the least significant difference test (LSD). When data were non-normally distributed, the Kruskal‒Wallis H test was used for comparing differences among multiple groups, with post-hoc pairwise comparisons conducted using the Bonferroni method. Non-normally distributed data between two groups were compared using the Mann-Whitney U test. Single-factor linear analysis was performed for laboratory and clinical variables that might influence CIMT. Variables with statistically significant differences were included in the multiple-factor linear regression analysis to identify risk factors. Intra-class correlation coefficient (ICC) was calculated to assess the consistency of measurements within and between observers, with ICC > 0.75 indicating good consistency. Receiver operating characteristic (ROC) curves were plotted, and the area under the curve (AUC) was calculated to analyze the efficacy of various ultrasound parameters in evaluating structural and functional changes in the carotid arteries of patients with type 2 diabetes mellitus. A significance level of p < 0.05 was considered statistically significant.
Results
Comparison of general data and clinical indicators
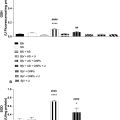
In this study, there were no statistically significant differences in age, gender, HDL, and LDL levels among the three groups of subjects (T2DM with normal CIMT, T2DM with thickened CIMT, and Control group) ( p > 0.05). However, significant differences were observed in BMI, SBP, DBP, HbA1c, FBG, TC, and TG among the groups ( p < 0.05). Specifically, within-group comparisons indicated that BMI, SBP, HbA1c, and FBG levels in both the T2DM with normal CIMT group and the T2DM with thickened CIMT group were significantly higher than those in the Control group ( p < 0.01). Additionally, DBP levels in both T2DM groups were higher than those in the Control group, and the DBP level in the T2DM with normal CIMT group was higher than that in the T2DM with thickened CIMT group ( p < 0.01). Furthermore, TC and TG levels in the T2DM with thickened CIMT group were higher than those in the T2DM with normal CIMT group and the Control group ( p < 0.05) ( Table 1 ).
| Variables | Control group | T2DM with normal ClMT group | T2DM wih thickened CIMT group | F/H- value | p -value |
|---|---|---|---|---|---|
| (n = 50) | (n = 108) | (n = 117) | |||
| Age (years) | 58.25±7.29 | 57.74±7.20 | 59.02±7.35 | 0.8773 | 0.417 |
| Gender (cases, male/female) | 27/23 | 50/58 | 63/64 | 1.514 | 0.469 |
| BMI (kg/m༒) | 22.23±1.41 | 24.05±1.58 a | 24.28±1.40 a | 36.045 | p < 0.001 |
| SBP (mmHg) | 108.62±10.24 | 127.80±10.15 a | 130.10±10.30 a | 82.560 | p < 0.001 |
| DBP (mmHg) | 75.26±7.44 | 82.49±7.38 a | 80.82±7.42 a | 16.512 | p < 0.001 |
| HbA1c (%) | 5.60±0.84 | 8.27±0.99 a | 8.43±1.06 a | 157.047 | p < 0.001 |
| FBG | 5.23±0.97 | 8.04±1.15 a | 8.12±1.18 a | 129.723 | p < 0.001 |
| TC (mmol/L) | 4.25±0.60 | 4.37±0.73 | 4.84±0.78 a b | 16.704 | p < 0.001 |
| TG (mmol/L) | 1.21±0.48 | 1.35±0.50 | 1.54±0.53 a b | 8.397 | p < 0.001 |
| HDL (mmol/L) | 1.31±0.28 | 1.23±0.30 | 1.21±0.32 | 1.914 | 0.150 |
| LDL (mmol/L) | 2.46±0.62 | 2.63±0.69 | 2.70±0.78 | 0.505 | 0.478 |
a Compared with the control group, p < 0.05;
b Compared with the T2DM with normal ClMT group, p < 0.05. BMI, body mass index; SBP, systolic blood pressure; DBP, diastolic blood pressure; HbA1c, glycated hemoglobin; FBG, fasting blood glucose; TC, total cholesterol; TG, triglycerides; HDL, high-density lipoprotein cholesterol; LDL, low-density lipoprotein cholesterol.
Comparison of bilateral common carotid artery ultrasound parameters in the T2DM with normal CIMT group
To assess the stability of the two ultrasound techniques, we measured several parameters (IMT, Diam, Dist, PWV, HC, WSS max , WSS mean , and V max ) in the bilateral carotid arteries of the T2DM with normal CIMT group using R-QVS and VFI techniques. The results indicated no statistically significant differences in ultrasound parameters between the left and right carotid arteries in this group ( p < 0.05) ( Table 2 ).
| Side | Cases | IMT (mm) | Diam(mm) | Dist(mm) | HC | PWV(m/s) | WSS max (Pa) | WSS mean (Pa) | V max (cm/s) |
|---|---|---|---|---|---|---|---|---|---|
| Left Side | 108 | 0.74+0.12 | 7.37±0.80 | 3.58(3.16,4.10) | 4.23±0.72 | 7.08±0.84 | 2.81±0.63 | 0.97±0.24 | 57.40±9.16 |
| Right Side | 108 | 0.75+0.11 | 7.44±0.75 | 3.60(3.20,4.17) | 4.27±0.76 | 7.12±0.81 | 2.70±0.68 | 0.95±0.28 | 56.32±9.25 |
| པ/Z -value | 0.408 | 0.440 | 0.557 | 0.158 | 0.127 | 1.521 | 0.318 | 0.743 | |
| ༰ -value | 0.524 | 0.508 | 0.453 | 0.692 | 0.722 | 0.219 | 0.574 | 0.390 |
Related posts:
 Strain Patterns With Ultrasound for Assessment of Abdominal Aortic Aneurysm Vessel Wall Biomechanics
 A Bioengineered Cathepsin B-sensitive Gas Vesicle Nanosystem That Responds With Increased Gray-level Intensity of Ultrasound Biomicroscopic Images
 Contrast-Enhanced Ultrasound of Mouse Models of Hindlimb Ischemia Reveals Persistent Perfusion Deficits and Distinctive Muscle Perfusion Patterns
 Classification of Neoadjuvant Therapy Response in Patients With Colorectal Liver Metastases Using Contrast-Enhanced Ultrasound—With Histological Pathology as the Gold Standard
 Attenuation Measuring Ultrasound Shearwave Elastography (AMUSE) as Noninvasive Imaging Biomarker for Liver Acute Cellular Rejection
 Ultrasound and Gold Nanoparticles Improve Tissue Repair for Muscle Injury Caused by Snake Venom
Stay updated, free articles. Join our Telegram channel

Full access? Get Clinical Tree


