Abstract
Objective
To develop and compare methods to automatically estimate regional ultrasound image quality for echocardiography separate from view correctness.
Methods
Three methods for estimating image quality were developed: (i) classic pixel-based metric: the generalized contrast-to-noise ratio (gCNR), computed on myocardial segments (region of interest) and left ventricle lumen (background), extracted by a U-Net segmentation model; (ii) local image coherence: the average local coherence as predicted by a U-Net model that predicts image coherence from B-mode ultrasound images at the pixel level; (iii) deep convolutional network: an end-to-end deep-learning model that predicts the quality of each region in the image directly. These methods were evaluated against manual regional quality annotations provided by three experienced cardiologists.
Results
The results indicated poor performance of the gCNR metric, with Spearman correlation to annotations of ρ = 0.24. The end-to-end learning model obtained the best result, ρ = 0.69, comparable to the inter-observer correlation, ρ = 0.63. Finally, the coherence-based method, with ρ = 0.58, out-performed the classical metrics and was more generic than the end-to-end approach.
Conclusion
The deep convolutional network provided the most accurate regional quality prediction, while the coherence-based method offered a more generalizable solution. gCNR showed limited effectiveness in this study. The image quality prediction tool is available as an open-source Python library at https://github.com/GillesVanDeVyver/arqee .
Introduction
Image quality is one of the main challenges in ultrasound imaging and can differ significantly between patients and imaging equipment. Many factors influence image quality in echocardiography such as the ultrasound scanner, the patient and the probe. Several quantitative measurements using the images are performed. However, this requires image quality good enough for the given measurement. Different measurements have different image quality requirements; e.g. , left ventricular (LV) volume, ejection fraction (EF) and strain measurements require good image quality across the entire myocardium. On the other hand, mitral annular plane systolic excursion only requires good image quality in the annulus. We also believe it is important to estimate regional image quality for each frame. For instance, end-diastole and end-systole frames are used for EF measurements, thus good image quality is required for both those frames. For measurements such as strain, which uses frame-by-frame tracking, the image quality of each segment of every frame is important as low quality in some frames may ruin the tracking in that segment. Good image quality should generally provide measurement values with low uncertainty. Estimating image quality can be useful in the following ways:
- •
To guide operators to achieve as good image quality as possible while scanning.
- •
To automatically select the best images and recordings, and the best cardiac cycles to use for a given measurement.
- •
As quality assurance, e.g. , to warn the user when an image is not good enough for a measurement, and to automatically approve/disapprove individual myocardial segments based on image quality.
- •
In data mining projects, to exclude cases with insufficient quality for reliable measurements.
Image quality is subjective and can vary depending on the application or the specific measurement being performed. What qualifies as “good” or “acceptable” depends on the context. In this study, we used the definitions outlined in Table 1 .
| Image quality label | Definition | Quality score |
|---|---|---|
| Not visible | Less than 50% of what is inside the sector is visible | 1 |
| Poor | Low signal-to-noise ratio and/or smearing/low resolution, but can still see at least 50% of the myocardium/annulus. Diffuse border between annulus and cavity | 2 |
| Ok | Medium signal-to-noise ratio and/or some smearing/lower resolution, can see at least 70% of the myocardium/annulus | 3 |
| Good | Good signal-to-noise ratio and clear border in at least 80% of the myocardium/annulus. Very little smearing/good resolution. Clear border between annulus and cavity | 4 |
| Excellent | Within the best 10% of what you have seen on this system | 5 |
We distinguished between two types of quality of ultrasound images: view quality/correctness and image quality. In this work we focused on image quality specifically. For view correctness, previous work demonstrated that 3-D ultrasound can serve as training data to automatically identify the transducer rotation and tilt in relation to the desired standard view and can guide the user to the correct position [ ]. For image quality, the classic ultrasound signal-processing metrics include contrast ratio (CR) [ ], contrast-to-noise ratio (CNR) [ ] and generalized CNR (gCNR) [ ]. These three metrics need a region of interest (ROI) and a background region to compare against. More recently, global image coherence (GIC) [ ] was proposed as a general quality metric that does not require the selection of these two regions. Image coherence measures how well the signals of the transducer elements align after delay compensation, with more alignment corresponding to clearer and sharper images. From the above-mentioned methods, only GIC can be used directly and automatically for measuring image quality separately as it does not require selecting an ROI and noise region. However, this approach requires channel data, which are not readily available in practice and do not give regional metrics.
Several automatic methods for measuring ultrasound image quality have been published applicable to cardiac imaging. Abdi et al. [ ] used a recurrent neural network to predict the global quality of cardiac cine loops. Criteria for quality assessment took both image quality and view correctness into account. In subsequent studies [ , ], they used an architecture that performed both view classification and global quality prediction simultaneously. The image quality metric is a global criterion based on the manual judgment of the clarity of the blood-tissue interface. Labs et al. [ ] used a multi-stream neural network architecture where each stream took in a sequence of frames and predicted a specific quality criterion. The criteria are global and take both view correctness and image quality into account. Karamalis et al. [ ] detected attenuated shadow regions with random walks resulting in a pixel-level confidence map. Unlike the other methods above, this method was not based on deep learning. It provided a local, pixel-level metric, but only measured the visibility of regions and not the quality of their content.
All of the automatic methods mentioned above have the limitation that they only provide a global image quality evaluation and/or do not assess image quality separate from view correctness. The novelty of this work is automatic quality estimation on a regional level. To the best of our knowledge, this is the first study to propose a method for automatic regional image quality assessment in echocardiography. Our method focuses specifically on quantifying image quality within different myocardial segments and in the annulus points, which can provide more granular and precise insights into the suitability of specific regions for various measurements.
Methods
In this work, we developed and compared three fully automatic methods to assess regional image quality in cardiac ultrasound separate from view correctness:
- •
Classical ultrasound image quality metrics, such as CR and CNR, applied in cardiac regions automatically extracted using deep-learning segmentation.
- •
Deep learning-predicted ultrasound coherence, which is a measure of how coherent a signal is received by the transducer elements, together with deep-learning segmentation.
- •
End-to-end prediction of regional image quality.
The rest of this section presents the datasets used to develop these methods and then presents each of the three methods.
Datasets
VLCD. The Very Large Cardiac Channel Data Database (VLCD) consists of channel data from 33,280 frames from 538 recordings of 106 study participants. It contains parasternal short axis (PSAX), parasternal long axis (PLAX), apical long axis (ALAX), apical two-chamber (A2C) and apical four-chamber (A4C) views. We split the VLCD dataset at the study participant level into train, validation and test sets, allocating 70%, 15% and 15%, respectively.
HUNT4. The Nord-Trøndelag Health Study dataset (HUNT4Echo) is a clinical dataset including, among others, PSAX, PLAX, ALAX, A2C and A4C views acquired using a GE Vivid E95 scanner and GE M4S probe. Each recording contains three cardiac cycles. We used two subsets of the HUNT4Echo dataset:
- •
Segmentation annotation dataset: a fraction of 311 study participant exams, the segmentation annotation set [ ] contains single-frame segmentation annotations in both end diastole and end systole as pixel-wise labels of the LV, left atrium (LA) and myocardium (MYO) in ALAX, A2C and A4C views.
- •
Regional image quality dataset: for this work, we created an additional dataset of image quality labels. Local image quality labels were manual annotations that assessed the image quality of the cardiac ROIs on a subset of the HUNT4 dataset in ALAX, A2C and A4C views.
Regional image quality annotation on HUNT4
An annotation tool was developed specifically for this project using open-source Annotation Web software ( https://github.com/smistad/annotationweb ) [ ], which was developed to enable clinicians to annotate regional image quality as efficiently and accurately as possible. The tool is freely available and can be adapted to other image quality projects. Table 1 defines the quality levels used in this work. Three cardiologists, each of whom performed more than 10,000 echocardiographic examinations and were European Association of Cardiovascular Imaging certified in transthoracic echocardiography, performed the quality annotations. The cardiologists used the following protocol:
- 1.
Annotate the end-diastole and end-systole frame of each recording, and optionally other frames if the image quality changes significantly during the recording.
- 2.
If the majority of the cardiac ROIs is out of sector, label it as out of sector. Otherwise, label the part of the region that is inside the sector according to the definitions in Table 1 . Out-of-sector regions were ignored in the remainder of this work.
For the first round of annotations, each of the three clinicians annotated the same 10 frames from 5 recordings of 2 study participants. This dataset was used to calculate the inter-observer variability. For the second round of annotations, the three clinicians collectively annotated 458 frames from 158 recordings of 65 study participants. The annotations from the second round formed the regional image quality dataset. This dataset was split randomly at study participant level into train, validation and test sets, allocating 70%, 15% and 15% of the data to each set, respectively. Table 2 shows the consistency of each split across the ALAX, A2C and A4C views.
| Set | Number of ALAX study participants/recordings/frames | Number of A2C study participants/recordings/frames | Number of A4C study participants/recordings/frames |
|---|---|---|---|
| Train | 31/31/99 | 42/43/120 | 33/34/102 |
| Validation | 8/8/20 | 10/10/31 | 8/8/27 |
| Test | 7/7/18 | 9/9/22 | 8/8/19 |
Regional image quality estimation
Classical ultrasound image quality metrics. For classical image quality metrics, deep-learning segmentation was used to extract the annulus regions and each of the myocardial segments as ROIs, with the LV as the background region. Appendix A gives more details on the procedure for dividing the segmentation into regions. The four classical ultrasound image quality metrics below were tested. We applied histogram matching [ , ] to a Gaussian distribution ( μ = 127, σ = 32) for the B-mode grayscale images before calculating pixel-based quality metrics.
- •
Pixel intensity is the average pixel intensity value in each region.
- •
Contrast ratio (CR) [ ] was defined as (eqn [ 1 ]):
<SPAN role=presentation tabIndex=0 id=MathJax-Element-1-Frame class=MathJax style="POSITION: relative" data-mathml='CR=μsegmentμLV’>??=?segment?LVCR=μsegmentμLV
C R = μ segment μ LV
- •
Contrast-to-noise ratio (CNR) [ ] was defined as (eqn [ 2 ]):
<SPAN role=presentation tabIndex=0 id=MathJax-Element-2-Frame class=MathJax style="POSITION: relative" data-mathml='CNR=μsegment−μLVσsegment2+σLV2′>???=?segment−?LV?2segment+?2LV√CNR=μsegment−μLVσsegment2+σLV2
C N R = μ segment − μ LV σ segment 2 + σ LV 2
- •
Generalized CNR (gCNR) [ ] is defined as the maximum performance that can be expected from a hypothetical pixel classifier based on intensity using a set of optimal thresholds. It was calculated as follows (eqn [ 3 ]):
<SPAN role=presentation tabIndex=0 id=MathJax-Element-3-Frame class=MathJax style="POSITION: relative" data-mathml='gCNR=1−12∑i=0MAXimin{psegment(i),pLV(i)}’>????=1−12∑?????=0min{?segment(?),?LV(?)}gCNR=1−12∑i=0MAXimin{psegment(i),pLV(i)}
g C N R = 1 − 1 2 ∑ i = 0 M A X i min { p segment ( i ) , p LV ( i ) }

Local, deep-learning predicted image coherence as quality metric
We used the VLCD dataset to calculate the coherence factor [ ] for each pixel in the ultrasound image. This factor is the ratio between the amplitude of the sum of the received signals to the sum of the amplitudes of those signals, where S i is the delayed signal for the i-th transducer element. This is equivalent to taking the coherent sum of the signal and dividing it by the incoherent sum of each signal. Thus, the coherence factor measures how well the complex signals of all transducer elements align. The remainder of the signal-processing chain comprised native processing of the GE HealthCare Vivid E95 system but without log compression. This signal-processing chain is described in more detail by Gundersen et al. [ ]. The result was a coherence image with the same dimension as the B-mode image. The final preprocessing step applied gamma normalization with 7 = 0.5 on the coherence images (eqn [ 4 ]):
ti,normalized=tiγ
Related posts:
 Advances in the Application of Artificial Intelligence in the Ultrasound Diagnosis of Vulnerable Carotid Atherosclerotic Plaque
 Changes in Muscle Quality Following Short-Term Resistance Training in Older Adults: A Comparison of Echo Intensity and Texture Analysis
 Validation of Muscle Ultrasound Speckle Tracking and the Effect of Nordic Hamstring Exercise on Biceps Femoris Displacement
 Combined Nanodrops Imaging and Ultrasound Localization Microscopy for Detecting Intracerebral Hemorrhage
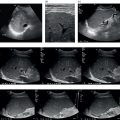
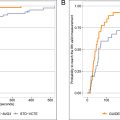 Guided-VCTE: An Enhanced FibroScan Examination With Improved Guidance and Applicability
 Shear Wave Elastography for Liver Disease: Part 2
Stay updated, free articles. Join our Telegram channel

Full access? Get Clinical Tree


