Introduction
Chronic liver disease is a major worldwide health problem. It may be due to several etiological factors that lead to necroinflammation with subsequent fibrosis (i.e., formation of scar tissue). Fibrosis, which is the consequence and not the cause of liver injury, may progress to cirrhosis and its complications if the cause of liver injury is left untreated. The prevalence of cirrhosis is probably underestimated as most patients remain asymptomatic with symptoms developing at a late stage. A recent study based on the National Health and Nutrition Examination Survey data source estimated that the prevalence of cirrhosis was 0.27% of the general U.S. population, with hepatitis C, alcohol, and diabetes mellitus playing a significant role. Furthermore, it found that nearly 70% of the participants with cirrhosis replied that they were never informed that they had liver disease.
With the availability of effective treatments for viral hepatitis, the rate of virus-induced chronic liver disease will significantly decrease, whereas the proportion of nonalcoholic fatty liver disease (NAFLD)/nonalcoholic steatohepatitis (NASH) will increase due to the obesity epidemic and sedentary lifestyles.
The stage of liver fibrosis is important to determine the prognosis, for surveillance, for prioritization for treatment, and even to determine the potential for reversibility. Therefore it is important to diagnose liver fibrosis and assess its severity to provide appropriate management and to prevent further liver damage.
With the availability of shear wave elastography (SWE) techniques, the number of liver biopsies performed for staging liver fibrosis in several clinical settings has drastically decreased, and liver biopsy is now seldom required outside the research setting.
SWE techniques were validated using liver histology as the reference standard. However, it should be kept in mind that elastography measures the stiffness, not the fibrosis, and therefore it is inappropriate to report and interpret the values using a histological classification. Moreover, stiffness is a quantitative estimate, whereas the histological scoring systems for liver fibrosis are based on categorical scales. Therefore even in the “ideal” conditions, an overlap between consecutive stages of liver fibrosis is inevitable when using liver stiffness as a surrogate marker of liver fibrosis.
The spectrum of advanced fibrosis (METAVIR F3 stage) and cirrhosis (METAVIR F4 stage) is a continuum in asymptomatic patients, and distinguishing between the two is often not possible on clinical grounds. The Baveno VI consensus on portal hypertension considered these uncertainties, and has proposed the term compensated advanced chronic liver disease (cACLD), which includes F3 and F4 stages.
Before performing elastography, the patient should be evaluated clinically. As highlighted by guidelines/consensus on liver SWE, the interpretation of liver stiffness measurement (LSM) depends on the specific clinical scenario, the prevalence of disease in the population under investigation, the current patient’s comorbidities, and the etiology of the liver disease. , , Therefore anamnesis, clinical examination, and abdominal ultrasound examination are suggested prior to the elastography evaluation, and elastography should not be performed without information on the patient’s current complaints, past medical history, and laboratory tests.
The operator performing the examinations must acquire appropriate knowledge and training in ultrasound elastography. Moreover, for the acoustic radiation force impulse (ARFI) techniques (point shear wave elastography [pSWE] and two-dimensional SWE [2D-SWE]), experience in B-mode ultrasound is mandatory.
Chronic viral hepatitis and nonalcoholic fatty liver disease
Staging liver fibrosis
There are differences among elastography modalities, therefore the cutoff values for fibrosis staging are not the same for every ultrasound system. However, the differences between the different systems are smaller in patients with LSMs up to 15 kPa, which is the most clinically relevant range of values for the staging of liver fibrosis. From a clinical point of view it is more important to rule in or rule out advanced disease (cACLD) than it is to provide an exact stage of liver fibrosis by using a histological scoring system.
Differences in cutoffs among published studies may also be due to differences in cirrhosis prevalence and severity in the studied populations (i.e., the spectrum effect). For patients chronically infected with hepatitis C virus (HCV), it is recommended to start treatment with direct-acting antiviral (DAA) drugs no matter the stage of liver fibrosis. Considering all these points, the use of clinical categories based on low/high likelihood of disease is suggested.
In patients with virus-related chronic hepatitis or with NAFLD, guidelines have been suggested to interpret LSMs by VCTE by using the rule of 5: LSM ≤ 5 kPa has a high probability of being normal; LSM < 10 kPa in the absence of other known clinical signs rules out cACLD; LSM between 10 and 15 kPa is suggestive of cACLD but needs further tests for confirmation; LSM > 15 kPa is highly suggestive of cACLD, whereas LSM ≥ 20–25 kPa indicates clinically significant portal hypertension. ,
ARFI-based techniques give different values with different ultrasound systems. However, the update to the Society of Radiologists in Ultrasound (SRU) consensus has highlighted that the overlap of LSMs between METAVIR stages is as large if not larger than the difference between vendor’s techniques. The SRU consensus recommends using a low cutoff value below which there is a high probability of no or mild fibrosis and a high cutoff value above which there is a high probability of cACLD.
It also suggests, based on published studies, to use a “rule of 4” for fibrosis staging with ARFI-based techniques in patients with chronic viral hepatitis or NAFLD: LSM ≤ 5 kPa (1.3 m/s) has high probability of being normal; LSM < 9 kPa [1.7 m/s] in the absence of other clinical signs of chronic liver disease rules out cACLD; LSM between 9 and 13 kPa (2.1 m/s) is suggestive of cACLD but may need further tests for confirmation; and LSM > 13 kPa is highly suggestive of cACLD. There is a high risk of clinically significant portal hypertension with LSMs > 17 kPa (2.4 m/s), but additional tests may be required ( Table 7.1 ). In patients with NAFLD, the cutoff values for cACLD may be lower, and follow-up or additional testing even among those with LSMs between 7 and 9 kPa is recommended. Each vendor’s technique has its own sensitivity and specificity using these cutoffs.
| Liver Stiffness Value | Recommendations |
|---|---|
| ≤ 5 kPa (1.3 m/s) | High probability of being normal |
| < 9 kPa (1.7 m/s) | In the absence of other known clinical signs, rules out cACLD. If there are known clinical signs, may need further test for confirmation |
| 9–13 kPa (1.7–2.1 m/s) | Suggestive of cACLD but need further test for confirmation |
| > 13 kPa (2.1 m/s) | Rules in cACLD |
| > 17 kPa (2.4 m/s) | Suggestive of CSPH |
The SRU consensus has highlighted that most studies that used ARFI-based techniques (pSWE and 2D-SWE) suggest that a liver stiffness value of less than 7 kPa (1.5 m/s) can help rule out significant fibrosis.
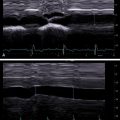
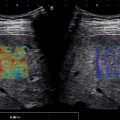
Figs. 7.1–7.6 show some cases of liver stiffness assessment in patients with chronic liver disease.


Due to the rapid decline of liver stiffness in patients with chronic viral hepatitis who achieve sustained virologic response (SVR) after treatment, the “rule of 4” (ARFI techniques) or the “rule of 5” (VCTE) cannot by applied to stage liver fibrosis in these cases ( Fig. 7.7 ).

Given the NAFLD disease burden, the use of noninvasive tests is a cost-saving measure and can decrease the risk related to performing a liver biopsy. A recent individual-patient-data metaanalysis (37 studies with 5735 subjects) that evaluated noninvasive tests versus liver histology has reported that sequential combinations of noninvasive markers with a lower cutoff to rule out advanced fibrosis and a higher cutoff to rule in cirrhosis can reduce the need for liver biopsy in patients with NAFLD. This algorithm can identify patients with low-risk NAFLD who can be managed in primary care and evaluate the severity of NAFLD without the need for liver biopsy in secondary care settings. The combinations were: Fibrosis-4 Index (FIB-4) < 1.3 followed by LSM by VCTE < 8 kPa to rule out advanced fibrosis, and FIB-4 ≥ 2.67 followed by LSM ≥ 10 kPa to rule in advanced fibrosis (66% sensitivity and 86% specificity). With cutoffs of FIB-4 and LSM, respectively, ≥ 3.48 and ≥ 20 kPa, the specificity increased to 90%.
Monitoring fibrosis: Hepatitis C and antiviral treatment
In patients with chronic hepatitis C who have been successfully treated with DDAs, a rapid decline of liver stiffness has been reported by several studies. , ,
A metaanalysis has estimated the decrease in liver stiffness by VCTE in patients with HCV who achieved SVR either after DAAs or interferon-based therapies. Twenty-four studies on 2934 patients with HCV and with paired VCTE before and after antiviral therapy were included. SVR was achieved in 75.5% of patients. With respect to baseline values, the decrease in liver stiffness was 2.4 kPa at the end of treatment, 3.1 kPa 1–6 months after therapy, 3.2 kPa 6–12 months after therapy, and 4.1 kPa 1 year or more after treatment. The median decrease at 6–12 months after end of treatment was 28.2%. No significant changes were observed in patients who did not achieve SVR, and the decreases in liver stiffness were significantly greater in patients treated with DAAs than with interferon-based therapy (4.5 kPa vs. 2.6 kPa). The decline in LSMs was higher in patients with higher alanine aminotransferase (ALT) baseline values (i.e., a marker of hepatic inflammation). The early decline in LSM observed at the end of treatment is likely due to resolution of hepatic inflammation, whereas the slow and continued decline beyond 1 year after end of treatment may be related to fibrosis regression.
By using liver histology as the reference standard, a study using a pSWE technique determined that the optimal cutoff values of shear wave speed for the staging of liver fibrosis in patients with chronic hepatitis C were significantly higher in untreated patients than in patients who had achieved SVR after treatment: 1.49 m/s vs. 1.26 m/s for ≥ F2; 1.51 m/s vs. 1.31 m/s for ≥ F3; and 1.51 m/s vs. 1.49 m/s for F4.
Therefore the use of liver stiffness cutoff values obtained in treatment-naïve patients can underestimate liver fibrosis in patients who have achieved SVR with DAAs.
To overcome this limitation, the SRU consensus has proposed to use the delta change of LSM over time instead of the absolute value as the best method to assess progression or regression of chronic liver disease. Due to the rapid decline of stiffness values after viral eradication observed in patients with HCV who were treated with DAAs, the baseline stiffness value for follow up must be the one obtained at the end of the treatment. It must be emphasized that guidelines have recommended that changes of liver stiffness values after successful anti-HCV treatment should not affect the management strategy (e.g., monitoring for hepatocellular carcinoma [HCC] and portal hypertension in patients at risk). ,
A study in which 84 HCV infected liver transplant recipients with at least METAVIR stage F1 had paired liver biopsy at baseline and at 12 months post-SVR (achieved either with interferon-based therapies or DAAs) showed that 67% presented a decrease of at least 1 stage in the METAVIR stage at follow-up biopsy. However, of the 37 patients with cirrhosis, 92% remained at F4 fibrosis or decreased to F3 fibrosis; that is, most remained with advanced fibrosis. Hepatic venous pressure gradient > 10 mmHg and liver stiffness by VCTE > 21 kPa, as well as liver decompensations before treatment, identified patients with a lower likelihood of fibrosis regression. Of note, posttreatment LSMs below 10 kPa were observed in some patients who remained with advanced fibrosis. Because complications such as HCC may occur in patients with regression to METAVIR F3 fibrosis and normalization of liver stiffness values after successful antiviral therapies, liver stiffness cutoffs obtained in treatment-naïve patients cannot rule out the presence of advanced fibrosis and guide screening strategies in patients who achieve SVR ( Fig. 7.8 ).

Monitoring fibrosis: Hepatitis B and antiviral treatment
VCTE has been largely used for evaluating the longitudinal changes in LSMs in patients with chronic hepatitis undergoing antiviral treatment. All the studies have shown a significant decline of liver stiffness in the long-term follow-up. However, without histological confirmation with paired liver biopsies, whether the decrease in LSMs is associated with regression of liver fibrosis, improvement in necroinflammation, or both, is unclear. In fact, in patients with chronic infection with hepatitis B virus (HBV), transaminases flares may occur. High ALT level is one of the major confounding factors for LSM, and even patients with HBV with mild to moderate ALT elevation (1–5 times the upper limit of normal) seem to have higher LSM than those with normal ALT levels.
Whether the decline in liver stiffness value results from regression of fibrosis, stabilization of activity, or both, it can be regarded as a beneficial effect of antiviral treatment.
Only a few studies have used paired liver biopsies. A multicenter study in which paired liver biopsies at baseline and after 2 years were available for some 30% of the patients showed a rapid to slow decline of liver stiffness values, and the decline continued even after the normalization of ALT values. The pattern of decline in liver stiffness likely reflected the remission of both liver inflammation and fibrosis during the first 24 weeks and fibrosis regression during long-term antiviral therapy, in particular, after ALT normalization. The LSM decline was greater in patients with higher baseline necroinflammatory activity and with a higher baseline fibrosis stage. After 2 years of treatment, regression of fibrosis was documented in 59.8% (98/164) of patients, with 64.3% (63/98) having at least a one-point decrease in Ishak fibrosis stage scores.
Another multicenter study with a large series of patients with paired liver biopsy results at baseline and at week 72 demonstrated that the regression of fibrosis and the improvement of inflammation were obtained in 51.2% and 74.4% of cases, respectively, and a liver stiffness decrease of ≥ 30% was associated with regression of fibrosis, significant histological response, and ALT normalization.
Clinical outcomes
Elastography has been proposed as a tool to predict the risk of death or complications in patients with chronic liver disease. LSM by VCTE combined with platelet count is a validated noninvasive method for varices screening, with very good results in terms of invasive procedures being spared. ARFI-based techniques also show promising results in this setting. This topic is presented in detail in Chapter 8 .
In patients with cACLD, the risk of liver decompensation increases with increasing LSM. A study that followed patients up to 4 years found that there were no events in the population with an LSM by VCTE < 21 kPa. An LSM of more than 35 kPa was associated with a decompensation risk of 39% at 4 years. For each unit increase in the LSM above 20 kPa, the risk of liver-related outcome increased by 6% after adjusting for age, sex, the model for end stage liver disease (MELD) score, cohort source, and etiology of liver disease.
A metaanalysis that included studies performed with VCTE or magnetic resonance elastography (MRE) found that each kilopascal unit increase in LSM was associated with a 7% higher risk of developing decompensated cirrhosis and with an 11% higher risk of HCC. In another metaanalysis, for each unit increment of liver stiffness by VCTE, the summary relative risk was 1.06 for all-cause mortality and liver-related events (i.e., hepatic decompensation, HCC, and/or liver-related mortality).
Using VCTE, a study in a small cohort of patients with cACLD as defined by an LSM ≥ 10 kPa reported that a combination of baseline LSM and its change over time was more useful in predicting the risk of presenting the endpoint (composite outcome that included death, liver decompensation, and impairment of at least one point in the Child-Pugh score) than either of the two parameters alone. In addition, patients with baseline LSM ≥ 21 kPa and an increase in delta-LSM ≥ 10% had a twofold risk of presenting the endpoint as compared with those with baseline LSM ≥ 21 kPa and delta-LSM < 10%. Of note, patients with LSM < 21 kPa and delta-LSM < 10% had zero risk of presenting the endpoint over a period of 43.6 months.
A study in a large series of U.S. veterans who initiated HCV treatment and had at least one liver stiffness before (n = 492) or after (n = 877) HCV therapy reported that posttreatment liver stiffness > 20 kPa by VCTE, but not pretreatment liver stiffness, was independently associated with the development of decompensated cirrhosis and the composite outcome of death, liver transplant, decompensated cirrhosis, or HCC.
A recent multicenter study has investigated the value of LSM to predict clinical outcomes in patients with ACLD due to several etiologies. , The patients were followed for a median period of 33.1 months. The best performance was obtained by combining the MELD score and LSMs. A MELD score of 10 points and an LSM of 20 kPa by 2D-SWE were the optimal cutoffs for stratifying the 2-year risk of mortality, and the authors named this algorithm M10LS20. By using the M10LS20 algorithm, the patients were stratified in three different risk groups: good prognosis (patients with both MELD score and LSM below the cutoffs), intermediate prognosis (patients with one parameter above and the other one below the cutoff), and poor prognosis (patients with both parameters above the cutoffs). The three groups had significantly different survival rates both at short-term (90 days) and long-term follow-up (2 years) and different risk of decompensation or further decompensation. The M10LS20 algorithm was tested also using LSMs obtained with pSWE and VCTE and showed a similar performance.
In patients with chronic hepatitis B, a score that includes age, albumin, HBV-DNA, and LSM has been proposed for predicting the risk of hepatocellular carcinoma (LSM-HCC).
The LSM-HCC score was obtained in a large cohort study of some 1500 consecutive patients. The cutoff values of 8.0 kPa and 12.0 kPa by VCTE were chosen to define three strata of LSM because these values had the highest sum of sensitivity and specificity, and specificity above 90% for HCC, respectively. By applying the cutoff value of 11.0, the score excluded future HCC with high negative predictive value (99.4%–100%) at 5 years.
Prediction of liver-related events or hepatocellular carcinoma after treatment
In patients with chronic viral hepatitis, the risk of developing liver-related events cannot be completely eliminated even in those who achieve complete virological response; this risk is mainly related to the degree of liver fibrosis before starting the treatment.
Some models that include LSM have been developed to predict the risk of HCC in patients with chronic hepatitis B treated with antivirals. The most used are modified risk estimation for hepatocellular carcinoma in chronic hepatitis B (mREACH-B) based on gender, age, ALT, hepatitis B e-antigen, and LSM and derived from the REACH-B score ; the cirrhosis and age (CAGE-B) score based on age at year 5 and cirrhosis in relation to LSM at year 5 of follow-up under therapy; and the stiffness and age (SAGE-B) score based on age and LSM at year 5 of follow-up under therapy.
In the study that developed the mREACH-B score, the incidence of development of liver-related events was 1.3% in patients with an LSM by VCTE after complete virologic response < 8.0 kPa, 14.8% in patients with an LSM between 8.0 and 13.0 kPa, and 28.8% in patients with an LSM > 13.0 kPa. Therefore these three different categories of liver stiffness values had an increasing weight in the score.
The mREACH-B score was obtained in an Asian cohort, whereas the CAGE-B and SAGE-B scores were developed in a White cohort of some 1500 patients. Both SAGE-B and CAGE-B have shown acceptable performance in predicting HCC after 5 years of antiviral therapy in Asian patients with chronic hepatitis B.
Successful treatment with DAAs in patients with compensated or decompensated cirrhosis is associated with reduced risk for HCC. The relative risk reduction is similar in patients with and without cirrhosis. Nonetheless, another study has demonstrated that patients with cirrhosis before SVR to treatment for HCV infection continue to have a high risk for HCC (>2% per year) for several years and should continue surveillance.
In a study that included more than 500 patients with HCV who achieved SVR after DAA therapy, at a median follow-up of 2.8 years the incidence of liver-related events was relatively low, and de novo HCC was the most frequent complication. The main predictors of HCC risk in the study were albumin level and follow-up LSM by VCTE. Two main risk groups were identified: (1) patients with LSM at follow-up < 10 kPa or patients with LSM between 10 and 20 kPa with albumin ≥ 4.4 g/dL at follow-up in whom the incidence of HCC was 0.6/100 patient-years and (2) patients with LSM ≥ 20 kPa at follow-up or those with LSM between 10 and 20 kPa but albumin < 4.4 g/dL at follow-up in whom the incidence was 2.9/100 patient-years. Of note, in contrast to what was reported in other studies, when patients were stratified for the risk of HCC according to LSM at baseline, there were no differences in HCC incidence among patients with LSM ≥ 20 kPa and those with LSM < 20 kPa.
Another study reported that a 30% decrease in LSM after DAAs was one of the predictors inversely associated with the risk of presenting with HCC.
Alcohol-related liver disease
Alcohol-related liver disease (ALD) is a major cause of severe liver disease worldwide; however, most patients with ALD are often unaware of their underlying condition. Therefore it can progress without patients seeking medical advice until a first sign of clinical decompensation such as jaundice, ascites, or variceal bleeding presents. Besides being diagnosed at a late stage, patients with ALD are more likely to die at a younger age and to experience liver-related events than patients with liver disease of any other etiology.
A population-based cohort study in Sweden reported that individuals with biopsy-proven ALD have a near fivefold increased risk of death compared with the general population. Individuals with ALD without cirrhosis were also at increased risk of death, which was highest in the first year after baseline but persisted after 10 or more years of follow-up.
Screening for ALD in at-risk patients should be routinely implemented because it is vital to allow an early intervention. In fact, cessation of drinking at any point in the natural history of the disease reduces the risks of disease progression and occurrence of complications from cirrhosis. It has been shown that the 5-year survival rate for people with cirrhosis who stop drinking is about 90% compared with 70% for those who continue to drink and that, even after the development of complications from cirrhosis, abstinence is essential because the survival rate is approximately 60% for those who stop drinking and 35% for those who do not. ,
ALD includes a wide spectrum of lesions ranging from steatosis, which is present in almost all heavy drinkers, to steatohepatitis, progressive liver fibrosis, and cirrhosis and its complications.
Similar to other chronic liver diseases, the severity of liver fibrosis correlates with patient outcomes: patients with stage F0–F2 fibrosis have 100% 10-year survival compared with only around 50% in patients with stage F3–F4. ,
cACLD is the main predictor of long-term survival, therefore it is of outmost importance to diagnose patients with advanced fibrosis before decompensation occurs to promote abstinence and improve survival.
A study performed in two cohorts of patients, one with a high pretest probability of alcohol-related cirrhosis and the other one with a low pretest risk, reported that VCTE and 2D-SWE had a high diagnostic accuracy for advanced fibrosis and cirrhosis in heavy drinkers and the performance of the two techniques was comparable. Both methods had a very high negative predictive value. The optimal cutoff values of VCTE and 2D-SWE were 9.6 and 10.2 kPa for significant fibrosis and 19.7 and 16.4 kPa for cirrhosis. Negative predictive values were high for both groups, but the positive predictive value for cirrhosis was > 66% in the high-risk group vs. approximately 50% in the low-risk group.
Several other studies have demonstrated that stiffness cutoff values are almost twofold higher in patients with ALD than in patients with HCV. An individual-patient-data metaanalysis that included 10 studies in 1026 patients who had undergone liver biopsy and were assessed with VCTE, reported that the cutoffs were 7 kPa for F ≥ 1 fibrosis, 9 kPa for F ≥ 2, 12.1 kPa for F ≥ 3, and 18.6 kPa for F = 4 with the areas under the receiver operating characteristic curve (AUROCs) of 0.83, 0.86, 0.90, 0.91, respectively. Aspartate aminotransferase (AST) and bilirubin concentrations had a significant effect on liver stiffness, and higher concentrations were associated with higher liver stiffness values and with significantly higher cutoff values for diagnosis of all fibrosis stages except F ≥ 1. Of note, this metaanalysis reported that for concentrations of AST and bilirubin within the normal range the liver stiffness cutoffs were similar to those reported in chronic hepatitis C for all fibrosis stages. It also showed that the increased liver stiffness was associated with nonsevere histological signs of alcoholic hepatitis. The median liver stiffness value was almost twice as high in patients with asymptomatic and nonsevere histological signs of alcoholic hepatitis than in patients without.
Therefore in patients with ALD, liver stiffness is markedly influenced by liver inflammation, and even minor increases in AST concentrations that would be considered indicative of mild inflammation in patients with HCV definitely affect liver stiffness values and might lead to overestimation of the severity of liver fibrosis. It has been suggested that AST and bilirubin concentrations should be taken into account when using liver stiffness cutoffs in clinical practice for the diagnosis of liver fibrosis in patients with chronic and excessive alcohol consumption.
An increase of liver stiffness associated with histological signs of alcoholic hepatitis has also been reported in studies performed using a pSWE technique. ,
Active drinking has also been shown to increase liver stiffness, and a rapid decrease in liver stiffness has been observed after alcohol withdrawal (0.5 to 4 weeks of abstinence). The decrease is associated with a normalization of transaminases, bilirubin, alkaline phosphatase, and/or gammaglutamyltransferase.
A study has suggested that AST levels should be considered when assessing fibrosis through liver stiffness values in patients with ALD and that elevated stiffness values observed at AST > 100 IU/L should be interpreted cautiously due to the possibility of false-positive results for the presence of steatohepatitis. The authors also underscore that even modest signs of liver inflammation become relevant for fibrosis stages lower than F4.
A recent multicenter study has addressed the issue of the ideal timing for liver stiffness assessment about the influence of alcohol consumption. VCTE and biochemistry data were obtained on the same day as the liver biopsy after a median of 6 days of abstinence in 259 patients hospitalized for alcohol detoxification. The cutoffs for ruling out and ruling in cACLD, respectively, were 10 and 25 kPa. The ruling-out cutoff remained very accurate regardless of alcohol consumption during 1- and 2-month follow-up. Of note, among patients with initial liver stiffness of 10 to 25 kPa (i.e., in the gray area), more than half of those with an absence of cACLD at histology had liver stiffness below 10 kPa during the same follow-up period.
Cholestatic and autoimmune liver disease
Studies for assessing liver fibrosis in primary biliary cholangitis (PBC), primary sclerosing cholangitis (PSC), and autoimmune hepatitis are very few and have been performed in a small number of subjects, mostly using VCTE.
It must be underlined that liver biopsy is no longer necessary in the diagnostic work up of PBC because of the diagnostic value of specific autoantibodies in the context of cholestatic liver biochemistry, unless there is suspicion of coexistence of autoimmune hepatitis, NASH, or other comorbidities or in cases unresponsive to the therapy. ,
In a diagnostic cohort of 103 patients with PBC, a liver stiffness cutoff of 10.7 kPa by VCTE was identified for advanced fibrosis, and an increase of stiffness of 2.1 kPa/yr or higher was associated with an 8.4-fold increased risk of liver decompensations, liver transplantations, or deaths in the monitoring cohort of 150 patients who were followed up with for up to 5 years. Of note, during the follow-up, liver stiffness was stable in the majority of patients with noncirrhotic PBC who were on treatment.
In patients with PSC, studies performed using VCTE have shown that LSM has a good accuracy in predicting advanced fibrosis and cirrhosis. In a series of 73 patients with PSC the threshold of liver stiffness by VCTE to identify patients with cACLD was 9.6 kPa with sensitivity, specificity, and accuracy above 80% and an AUROC > 0.90.
In patients with autoimmune hepatitis, hepatic inflammation is a confounding factor that can lead to overestimation of liver stiffness independently from fibrosis stage. Therefore guidelines have recommended to stage liver fibrosis after at least 6 months of immunosuppressive therapy.
Screening for liver fibrosis in the general population
The diagnosis of a chronic liver disease is seldom made in the precirrhotic stage or in early cirrhosis because generally the patients are asymptomatic and thus they do not seek medical advice. Sometimes the diagnosis is made when the disease has already reached the later stages with decompensation of cirrhosis or development of HCC. Fibrosis is the most important driver in determining the progression to cirrhosis, therefore the assessment of a patient with chronic liver disease is based on the assessment of fibrosis. Due to the high prevalence of chronic liver diseases and the role of cirrhosis and HCC as major causes of death worldwide, the possibility of screening the general population for liver fibrosis could be of interest.
Few studies have reported results on screening for liver fibrosis in the general population.
A study on subjects from the general population who were older than 45 years old, without previously known liver disease, and attending a primary care center for a medical check-up found that 89 out of 1190 (7.5%) subjects had LSM > 8 kPa including nine patients with LSM > 13 kPa. Even though the liver tests were normal in 43% of them, a specific cause of chronic liver disease was found in all subjects, and the most frequent etiologies were NAFLD and ALD. Among the patients undergoing liver biopsy, cirrhosis was confirmed in all subjects with LSM > 13 kPa (100% positive predictive value).
In another study, subjects from an Asian population were randomly selected from the government census database and were invited for a check-up. Subjects with positive hepatitis B surface antigen or antibody against HCV, secondary causes of fatty liver, and decompensated liver disease were excluded. The final analysis included 922 subjects ; of those, 264 (28.6%) had fatty liver detected by magnetic resonance spectroscopy, with a prevalence higher in men than in women. Eight (3.7%) patients with fatty liver and seven (1.3%) controls had liver stiffness by VCTE ≥ 9.6 kPa, a level suggestive of advanced fibrosis. Of note, fatty liver was found in 14.3% of subjects with normal ALT according to the updated lower cutoff values (< 30 IU/L in men and < 19 IU/L in women). Therefore the diagnosis of chronic liver disease would have been missed if patients had been evaluated with the standard diagnostic algorithms used in primary care.
In a European population-based study among individuals 45 years of age and older, 5.6% of the 3041 participants had LSM ≥ 8.0 kPa, which was the cutoff used to define clinically relevant fibrosis. The adjusted predicted probability of LSM ≥ 8.0 kPa increased per age decade, with probabilities ranging from 1.4% in participants ages 50–60 years old to 9.9% in participants older than 80 years old. Participants with both diabetes and steatosis had the highest probabilities of LSM ≥ 8.0 kPa.
A study that included 1918 diabetic patients from primary care and hospital clinics reported that some 18% had increased liver stiffness as assessed by VCTE (≥ 9.6 kPa by M probe or ≥ 9.3 kPa by XL probe). Patients with high body mass index, dyslipidaemia, and increased ALT were at highest risk of increased liver stiffness. Patients with suspected advanced fibrosis or cirrhosis based on LSMs were invited to undergo liver biopsy. Among patients with liver biopsy, 56% had steatohepatitis, 21% had advanced fibrosis, and 29% had cirrhosis.
In a study on patients with type 2 diabetes or excessive alcohol consumption and with abnormal blood biomarkers attending primary care practice, a liver stiffness > 8 kPa was found in 27% of cases.
Altogether the rate of undiagnosed chronic liver disease in apparently healthy subjects is not negligible. Considering the healthcare costs linked to treating patients with advanced liver disease, screening programs for liver fibrosis with noninvasive tests in categories of subjects at risk could be cost-effective. However, it must be emphasized that the interpretation of liver stiffness results should always take into consideration patient demographics, disease etiology, key laboratory findings, and confounding factors. , , , ,
Pediatrics
Chronic liver diseases are increasingly prevalent in the pediatric population worldwide. This increase in frequency is, in part, driven by the increasing prevalence of NAFLD in more developed countries, including the United States. There are numerous other causes of chronic liver disease in children, some of which are unique to the pediatric population and others that are also common in adults. Such causes may be congenital (e.g., biliary atresia, Alagille syndrome), metabolic/genetic (e.g., progressive familial intrahepatic cholestasis), inflammatory (e.g., autoimmune hepatitis, PSC), and infectious (HBV and HCV infections), among others. All of these disorders can cause progressive liver injury over time, leading to repeated attempts at healing and the deposition of scar tissue, or liver fibrosis.
As in adults, histologic evaluation is the current reference standard for detecting and staging liver fibrosis. However, liver biopsy has numerous disadvantages. These include poor patient acceptance, its invasive nature that can result in procedure-related complications (e.g., internal bleeding), its relatively high cost (children are commonly admitted to the hospital for observation following such procedures), the need for sedation or general anesthesia that also adds to procedural cost, and sampling error. Sampling error is a particularly clinically important concern, as liver biopsy procedures sample only very tiny fractions of the liver and as a result can both underestimate and overestimate the overall extent of liver fibrosis.
In part, due to the limitations previously mentioned, clinicians are increasingly turning to noninvasive quantitative diagnostic tools to detect and stage liver fibrosis, including SWE techniques.
Shear wave elastography in children: Challenges
There are several unique challenges when performing ultrasound SWE in children compared with adults. First, adult patients are typically requested to abstain from eating for at least 4 hours prior to imaging. In very young children (e.g., neonates and infants) this could potentially be harmful. Other children simply may be unable or unwilling to fast for 4 hours. In these situations, a fast of at least 2 hours is attempted. If fasting cannot be achieved, elastography is performed as it can still provide useful information. If the results are normal, there is no substantial liver fibrosis; if the results are markedly abnormal, there is likely substantial liver fibrosis. If the LSM is borderline or only mildly elevated, then repeat imaging should be considered as this apparent stiffening could be the result of increased blood flow to the liver. Another potential solution to this problem is to try to schedule these examinations early in the morning, soon after the patient has awoken from sleep.
Another challenge in the pediatric population relates to breath holding, typically required for ARFI techniques. Despite this potential challenge, 2D-SWE has high technical success rates in children. 2D-SWE demonstrated a 95% technical success rate in a mostly pediatric study containing 573 examinations. A few studies have assessed the feasibility of free breathing ultrasound SWE in children ( Figs. 7.9–7.11 ). No significant difference in LSMs using 2D-SWE during breath held and free breathing conditions (7.21 kPa vs. 7.22 kPa) has been reported in a series of 57 children. However, it was found that 2D-SWE values were 11% lower when measured during free breathing conditions in 45 children with liver disease.