The role of structural neuroimaging in the diagnosis of Alzheimer’s disease (AD) is becoming increasingly important. As a consequence, a basic understanding of what are normal brain changes in aging is key to be able to recognize what is abnormal. The first part of this article discusses normal versus pathologic brain aging, focusing on qualitative and quantitative magnetic resonance (MR) imaging markers. In the second part, the role of MR imaging in the (differential) diagnosis of AD is reviewed.
Structural neuroimaging in dementia has traditionally served the sole purpose of ruling out (treatable) disease as an alternative explanation for cognitive deterioration, for example a brain tumor or subdural hematoma. However, with more widespread use of magnetic resonance (MR) imaging and the development of more advanced imaging techniques (including diffusion-weighted and susceptibility-weighted imaging, positron emission tomography, or single-photon emission computed tomography), the role of neuroimaging in dementia has shifted gradually from exclusion of disease toward that of a highly valuable aid to the clinical diagnosis and subtyping of dementia. To this end, MR imaging is preferred over computed tomography (CT), because it has the advantage of not only assessing (regional) atrophy (for which CT is sufficient) but also depicting other brain changes such as white matter lesions (WMLs) and microbleeds. Furthermore, there is increasing evidence showing that the pathologic process associated with dementia may begin decades before diagnosis. Detecting such preclinical changes by means of imaging could imply a major role for neuroimaging in risk stratification and early disease prevention. Yet, many brain changes seen in dementia also occur in middle-aged and elderly individuals who are cognitively intact, and are considered part of the normal aging process. Distinguishing normal from abnormal aging is therefore a prerequisite when interpreting an imaging examination of an individual suspected of Alzheimer’s disease (AD) or non-Alzheimer’s dementia, and even more so when the goal of imaging shifts toward prediction of development of dementia. Structural MR imaging is the primary neuroimaging technique of choice in clinical practice to support the clinical diagnosis of dementia. This article focuses on structural MR neuroimaging in normal aging and in dementia, more specifically in AD. In the first part, normal versus pathologic brain aging is discussed, focusing on qualitative and quantitative MR imaging markers. In the second part, the role of MR imaging in the (differential) diagnosis of AD is reviewed.
Part I: structural imaging in aging
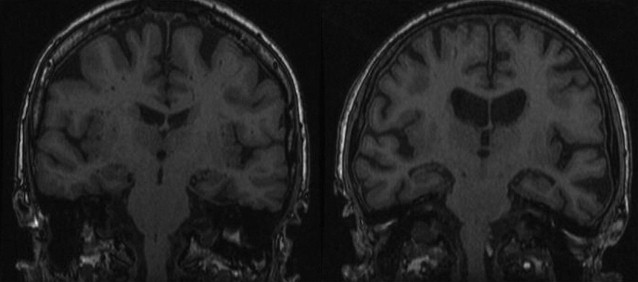
To recognize the abnormal, one needs to first know what is normal. With increasing age, the brain may show structural changes to varying degrees. Many of these brain changes overlap with the spectrum of disease present in dementia and AD, and there is a fine line between normal and pathologic brain aging. Moreover, even among those persons considered to age normally, there is a wide range, varying from successful brain aging (ie, retaining normal brain structure and volume up to high age) to the more typical aging or even near-pathologic brain aging ( Fig. 1 ). Also, even although changes such as atrophy or WMLs are to a certain extent considered to be part of the normal aging spectrum, these have consistently been related to vascular risk factors. Furthermore, their presence may be accompanied by subtle cognitive deficits or even an increased risk of neurodegenerative or cerebrovascular disease. Studying the distribution and the time course of alterations that occur in the normal brain with aging is therefore important for understanding the mechanisms leading to these changes and for better characterization of neurologic disorders of which the risk increases with advancing age, such as dementia. Furthermore, because more clinical trials on therapy for AD are investigating imaging measures as surrogate markers for disease outcome, it becomes of particular importance to take into account the normal age-related brain changes that can be expected.
This section describes what changes are commonly found in the aging brain, to what extent these can be regarded as normal, and how these could be interpreted in the context of (suspected) AD.
A summary of common imaging findings in normal aging is presented in Box 1 .
Brain atrophy
- •
Total brain volume: 0.4–0.5% brain tissue loss per year is normal, >1.0% is likely abnormal
- •
Hippocampus: volume loss 1.6%/y in normal individuals
- •
Normal volume loss in aging should be taken into account in clinical setting or in trials; reference data derived from normal population may be helpful
WMLs
- •
Punctiform or early confluent lesions (Fazekas score 0–2) in periventricular or subcortical distribution is generally normal in aging
- •
Confluent lesions are always abnormal (Fazekas score 3)
- •
MR imaging sequences such as diffusion tensor imaging (DTI) are more sensitive in detecting microstructural changes in normal-appearing white matter
Cerebral microbleeds
- •
T2∗-weighted MR imaging sequence needed for depiction
- •
Common in elderly individuals: prevalence more than 20% in persons older than 60 years
- •
(Strictly) lobar distribution linked to cerebral amyloid angiopathy (CAA) and AD
- •
Deep or infratentorial distribution related to hypertensive arteriolosclerosis
- •
New microbleeds develop yearly in 3%–7% of aging individuals
Silent brain infarcts
- •
Small lacunar strokes that are presumably without symptoms, but have been linked to subtle cognitive deficits and increased risk of stroke and dementia
- •
Present in 11%–28% of individuals older than 55 years
Enlarged perivascular spaces (EPVSs)
- •
Common around anterior commissure, in centrum semiovale, near vertex of the brain, and in hippocampus
- •
May be considered normal in most individuals but have also been linked to small vessel disease, cognitive deficits, and risk of dementia
Brain Atrophy and Hippocampal Atrophy
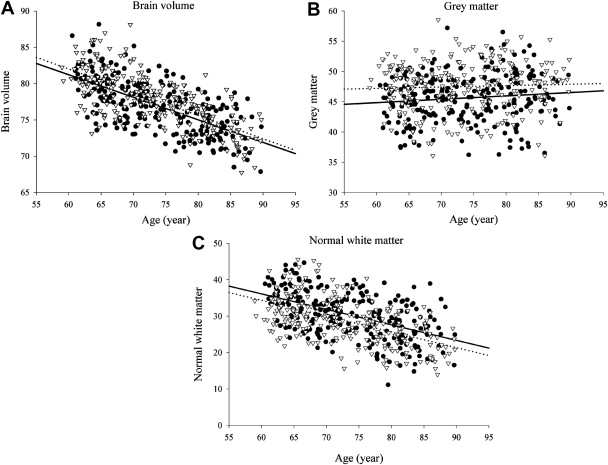
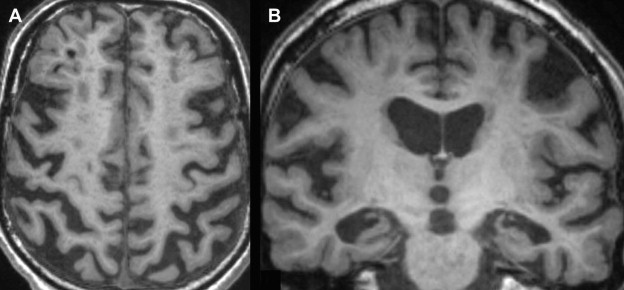
Insight into changes of total brain volume with aging can be derived from various cross-sectional and longitudinal studies. Several automated image-processing tools have been developed to quantify total brain volume ( Box 2 ), all with high levels of reproducibility. Cross-sectional studies have consistently shown in nondemented persons older than 55 years that brain volumes are smaller with increasing age, in persons with cardiovascular risk factors, and even more so when imaging findings consistent with cerebral small vessel disease are present. When gray and white matter are studied separately, the rate of decline with age varies according to the age range studied. Several studies report a steady decline in gray matter from early adulthood onwards, but others find that in elderly individuals, gray matter loss seems to become less prominent and that it is primarily white matter atrophy that causes the brain to shrink ( Fig. 4 ). There are few longitudinal studies that have examined changes in brain volume within individuals over time. For the purpose of comparison and to correct for head size differences, brain tissue volumes are generally expressed as percentage of intracranial volume. A mean rate of brain volume loss of 0.4% to 0.5% per year in normal middle-aged and elderly individuals has been described, and double that rate (1.0%) in individuals who developed dementia during follow-up. Yet, even among individuals remaining free of dementia, there is extensive evidence that total brain volume and separate gray/white matter volumes relate to cognitive performance in various cognitive domains.
Brain atrophy has originally been assessed using visual rating scales (eg, global cortical atrophy [GCA] scale, see Table 1 ), yielding crude and observer-dependent measures, which are less useful for assessment of change over time. More recently developed automated algorithms allow for absolute quantification of many features, increasing the usefulness of volumetric measurements to distinguish normal from abnormal aging. These automated methods can be grossly divided into segmentation-based analyses and registration-based analyses. For a more detailed discussion of these methods, see Ref.
Segmentation-based analysis
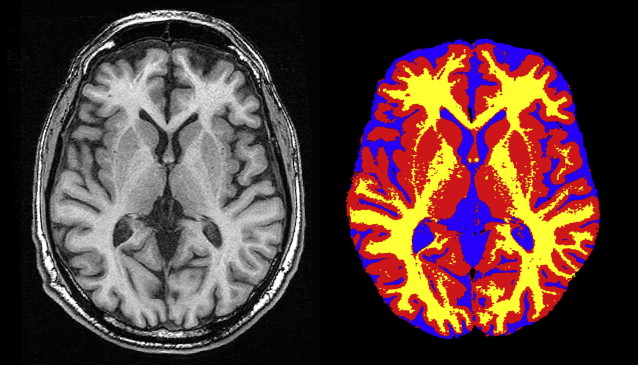
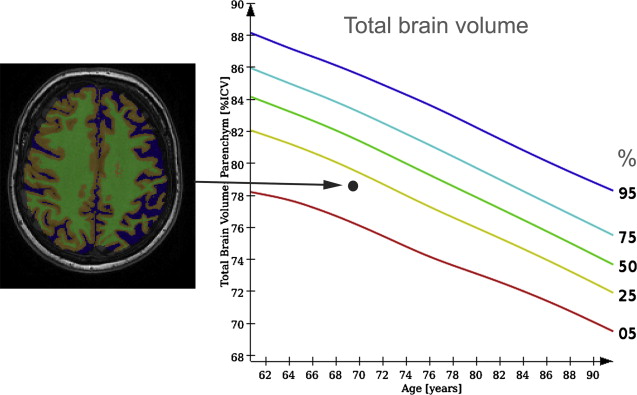
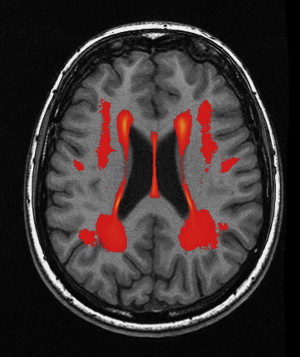
For tissue segmentation, T1-weighted images, preferably with isotropic voxel size, are most often used as input. Freely available segmentation algorithms that are frequently used are those incorporated in the SPM ( http://www.fil.ion.ucl.ac.uk/spm/ ) and FSL software packages ( http://www.fmrib.ox.ac.uk/fsl/ ). These segmentation processes yield for each voxel the probability of belonging to a certain tissue class (gray matter, white matter, cerebral spinal fluid [CSF] or background). A typical segmentation result is shown in Fig. 2 . These probability maps can then be used to estimate tissue volumes on an individual level or to perform group-wise analyses on a voxel level (voxel-based morphometry ). A disadvantage of most tissue segmentation algorithms is that these are not able to segment WMLs. To this end, a fully automated algorithm developed on fluid-attenuated inversion recovery (FLAIR) images has been described recently.
Registration-based analysis
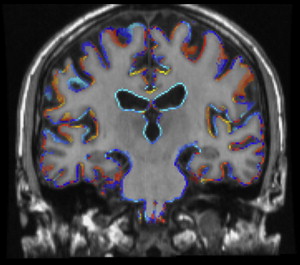
In the process of image registration, 1 image is brought in anatomic correspondence with another image, by a method of registration that uses a variable amount of degrees of freedom (as a rule of thumb, using more degrees of freedom is more time-intensive but yields a better registration). Applying registration methods to scans from a single individual collected at 2 different time points enables assessment of change in brain volume over time as depicted in Fig. 3 . Methods like SIENA within the FSL package ( http://www.fmrib.ox.ac.uk/fsl/siena/index.html ) or the brain boundary shift integral method both directly visualize change in brain volume over time.
| Degree of Atrophy | Gyri | Sulci | |
|---|---|---|---|
| GCA = 0 | None | Normal volume | Normal width |
| GCA = 1 | Mild (may be considered normal in the elderly) | Normal | Some opening of sulci |
| GCA = 2 | Moderate | Reduced | Enlarged |
| GCA = 3 | Severe | Severely reduced (knife blade) | Severely enlarged |
In the context of AD, hippocampal volume loss in normal aging is of particular interest. Manual outlining of hippocampal borders has long been the method of choice to obtain volumetric measures (for a detailed description, see Ref. ). Manual tracing is tedious, resource intensive, and prone to human error. These limitations become particularly relevant when large MR imaging data sets from population-based studies are to be analyzed, arguing for a need for automated measurements. Current automated methods, mainly atlas-based registration, have been shown to yield reliable and valid data, and results are still improving. Using automated segmentation, a longitudinal population-based study in 518 nondemented aging individuals showed a decline of 1.6% in hippocampal volume per year, which is similar to a rate of 1.4% per year that was established/found among 200 healthy control individuals in a meta-analysis of AD case-control studies. For comparison, the AD individuals in this meta-analysis had a mean decline in hippocampal volume of 4.7% per year. In the longitudinal study mentioned earlier, individuals who showed a larger rate of decline in hippocampal volume during follow-up more often developed dementia (the odds ratio to develop dementia was 2.3 per standard deviation of volume loss). Among those subjects who stayed free of dementia during follow-up, a faster decline in hippocampal volume was still related to worse performance on memory tests.
These findings show that there seems to be a spectrum from normal aging to pathologic brain aging, rather than a distinct separation between healthy and diseased states. Furthermore, it implies that knowledge of normal rates of atrophy in aging is of importance for clinical trials in AD, when the rate of brain atrophy or hippocampal atrophy is used as a surrogate marker of disease progression, but also in a clinical setting taking into account a patient’s age is important to determine whether they show an abnormal degree of brain tissue loss. For this use, reference data on brain tissue volumes derived from a normal aging population are of great value ( Fig. 5 ).
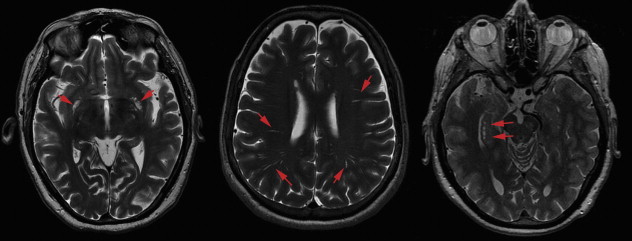
WMLs and White Matter Microstructure
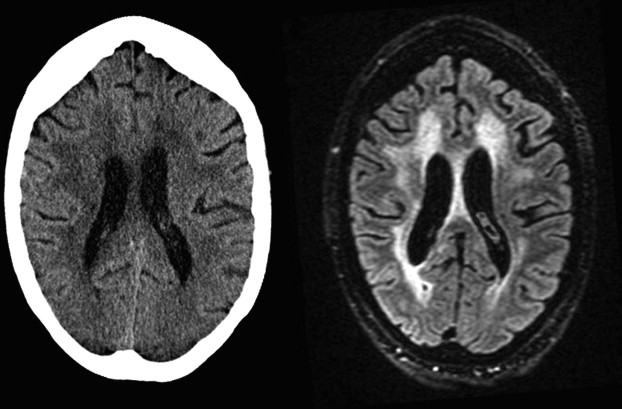
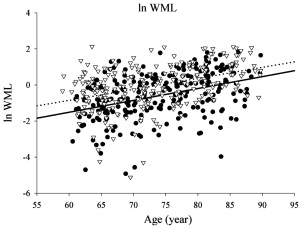
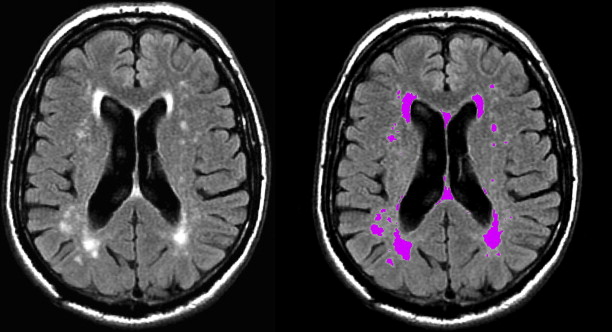
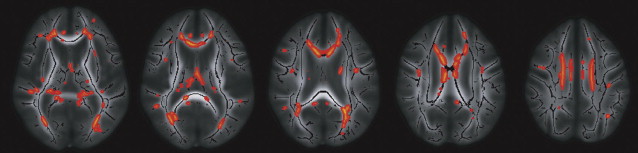
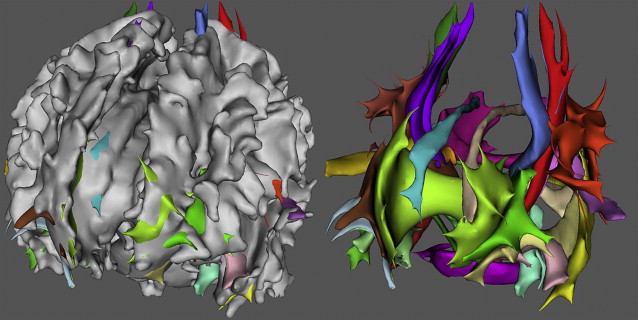
In elderly individuals, focal white matter abnormalities occur frequently, seen on CT as mildly hypodense areas and on T2-weighted MR imaging or FLAIR images as hyperintense foci in the white matter ( Fig. 6 ). Commonly used terminology includes WMLs, white matter hyperintensities, or age-related white matter changes. WML load increases with age ( Fig. 7 ) and typically shows a periventricular or subcortical distribution ( Box 3 , Fig. 10 ). Although the pathogenesis remains unclear, histopathologic studies point toward hypoxic/ischemic injury caused by hypoperfusion as the underlying cause. This theory is further supported by findings that classic cardiovascular risk factors, such as hypertension, smoking, and diabetes, are all related to the presence and progression of WMLs. Although longitudinal studies have shown that lesion load in presumed healthy persons is related to an increased risk of stroke, dementia, and death, cross-sectional reports show only a weak correlation between WML and symptoms, such as cognitive deficits. This finding may be related to the fact that the underlying extent of tissue disease (ie, myelin loss or axonal damage) may differ between several kinds of lesions that all have a similar appearance on MR imaging. Furthermore, WMLs likely mark underlying vasculopathy that causes changes in normal-appearing brain tissue that are not visible on conventional MR imaging. Various advanced MR techniques have emerged in recent years to assess these hidden abnormalities in apparently normal brain tissue. Examples are magnetic transfer ratio, spectroscopy, or T1 and T2 relaxation measures, the use of which has been described extensively in relation to white matter diseases such as multiple sclerosis. A more recent emerging technique is DTI, which enables the quantification of random movement of water molecules in brain tissue, by applying strong magnetic gradients in various directions. Normal brain tissue, especially white matter, hinders the degree and direction of random diffusion because of its highly structured fiber organization. With loss of microstructural integrity of white matter, diffusion properties change to a measurable extent. Parameters derived from DTI that are used commonly to quantify tissue integrity are mean diffusivity (MD, magnitude of diffusion) and fractional anisotropy (FA, degree of anisotropy of diffusion). With increasing age, MD has been consistently found to increase in normal-appearing white matter, and FA to decrease. These changes were found to relate more to WML load and atrophy than to age in itself ( Fig. 11 ), thus supporting the idea that WMLs merely represent the tip of the iceberg and that damage to the white matter is more widespread than can be appreciated on conventional MR images. More importantly, DTI changes in normal-appearing brain tissue relate to cognitive function in community-dwelling elderly individuals, independent of degree of brain atrophy or WML load, suggesting that DTI more sensitively detects clinically significant white matter changes and that this measure may complement traditional volumetric measures. More recent approaches have been directed toward quantification of DTI parameters in distinct white matter tracts that can be identified using tractography methods ( Fig. 12 ). These advances will yield tract-specific information on diffusion properties, which is of relevance to the hypothesis that cognitive decline may in part be caused by disconnection of specific cortical-subcortical connections. It is expected that such methods may aid in detecting more subtle changes in white matter disease over time, which could for example be used as a surrogate marker to evaluate new therapies in clinical trials. Again, reference estimates derived from aging individuals are essential to interpret findings in a clinical setting.
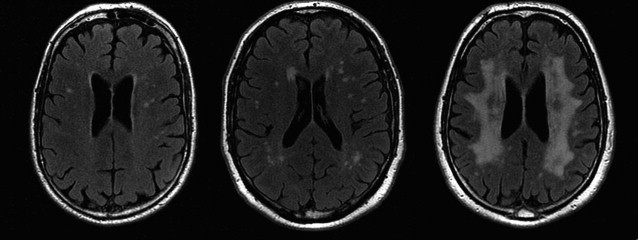
Visual rating
A large variety of visual rating scales is available to assess the amount and distribution of WMLs. Easiest to use (and therefore most commonly applied in clinical care) is the Fazekas rating scale, which describes WML load separately for periventricular and deep WMLs in a 4-step scale (score 0–3; Fig. 8 ). A general interpretation of the Fazekas scores is that score 1 (punctiform lesions only) is normal for most individuals, even those aged less than 65 years. Score 2 is considered abnormal for persons aged 70 years and less, whereas score 3 (confluent lesions) should always be viewed as abnormal. The Age-Related White Matter Changes (ARWMC) scale also applies a 4-step scale but on a larger number of regions ( Table 2 ). A more elaborate and semiquantitative scale is that of Scheltens and colleagues.
Automated segmentation
Despite the ease of visual rating, studies have shown that there is considerable interrater reliability for the use of these scales, especially concerning WML progression. Alternatively, WML volume can be quantified by manually outlining all lesions and summing these to obtain volumetric measures that may better capture change over time. Yet, this practice is time-consuming and may still be prone to human error. An observer-free and reproducible assessment of WML load may better be obtained by fully automated tissue segmentation procedures (for an example, see Ref. ) ( Fig. 9 ).
| WMLs | |
| 0 | No lesions (may include symmetric, well-defined caps or bands) |
| 1 | Focal lesions |
| 2 | Beginning confluence of lesions |
| 3 | Diffuse involvement of the entire region, with or without involvement of U-fibers |
| Basal ganglia lesions | |
| 0 | No lesions |
| 1 | 1 focal lesion (≥5 mm) |
| 2 | >1 focal lesion |
| 3 | Confluent lesions |
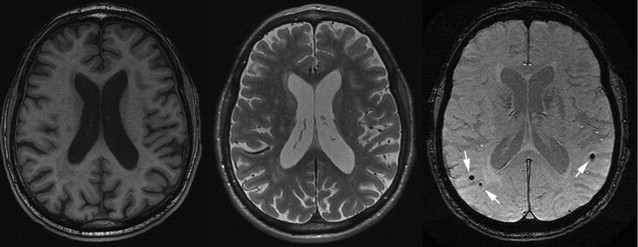
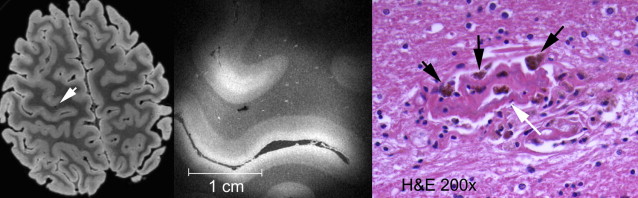
Cerebral Microbleeds
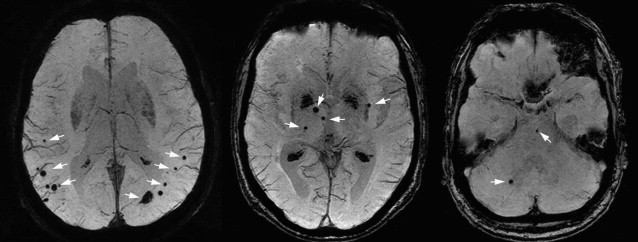
Cerebral microbleeds are small brain hemorrhages that are presumed to result from leakage of blood cells from damaged small vessel walls. They were first detected on MR imaging only in the mid-1990s, as MR imaging sequences sensitive to blood-breakdown products became available (eg, T2∗-weighted gradient-echo technique), which are essential for microbleed detection ( Fig. 13 ). Histologically, these small black dots on MR imaging represent hemosiderin-laden macrophages that are clustered around small vessels ( Fig. 14 ). The choice of field strength, sequence parameters (particularly echo time), and postprocessing (eg, susceptibility-weighted imaging technique) have all been found to have a major influence on the detection rate of cerebral microbleeds. With these advances in imaging, the prevalence of microbleeds has been estimated to be more than 20% in persons aged 60 years and older, increasing to nearly 40% in those older than 80 years. Microbleed location is generally divided into deep (ie, basal ganglia, thalamus) and infratentorial versus lobar brain regions ( Fig. 15 ). In the aging population, microbleeds in lobar locations share apolipoprotein E (APOE) ε4 genotype as a common risk factor with CAA and AD, suggestive of a potential link between vascular and amyloid neuropathology. This link has further been corroborated by the finding that topography of lobar microbleeds in community-dwelling elderly individuals follows the same posterior distribution as is known from amyloid disease in CAA and AD. Furthermore, recent reports show that presence of microbleeds, and particularly those in lobar locations, relates to worse cognitive function, both in healthy elderly individuals and in patients diagnosed with AD. In contrast, deep or infratentorial microbleeds in aging individuals are primarily linked to classic cardiovascular risk factors and are more likely caused by hypertensive vasculopathy. Longitudinal studies indicate that incident microbleeds commonly occur over time: annually, 3% of presumed healthy elderly individuals develop new microbleeds, increasing to more than 7% of those who already have microbleeds at baseline. In comparison, these rates are doubled in patients attending a memory clinic.
The increasing evidence that microbleeds reflect both vascular disease as well as amyloid angiopathy has led to the belief that these may well represent the missing link between the vascular and amyloid hypotheses in the pathogenesis of AD, which is further elaborated on in part II of this article.
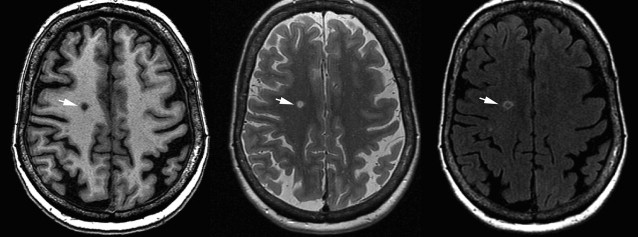
Silent Brain Infarcts
Small lacunar infarcts ( Fig. 16 ) are often found on brain MR imaging in the aging population without previous history of stroke and these have therefore been named silent brain infarcts. Population-based studies have estimated the prevalence of silent infarcts on MR imaging to range from 11% to 28% for those aged 55 years and older. These estimates are likely to vary as a result of large heterogeneity in MR imaging parameters and diagnostic criteria, and the difficulty in distinguishing lacunar infarcts from EPVSs. As expected, silent brain infarct prevalence is higher with increase in age and with risk factors also known to be related to clinical stroke, such as hypertension, atrial fibrillation, carotid intima-media thickness, and increased plasma homocysteine. More recent publications also point toward kidney disease as an important risk factor, which indicates that cerebral small vessel disease may be a reflection of more systemic vascular damage. Furthermore, silent brain infarcts show a strong association with WML load, again supporting small vessel disease as a common underlying pathophysiology. This finding has been further substantiated by a link between retinal microvascular abnormalities and both lacunar infarcts and WMLs in a large sample of aging individuals. Despite their name, the fact that silent infarct presence has been related to subtle cognitive deficits and more than doubles risk of stroke and dementia (in particular AD ) suggests that these are neither silent nor innocuous.
EPVSs
Perivascular spaces, also named Virchow-Robin spaces, are extensions of the subarachnoid space that accompany vessels entering the brain parenchyma. EPVSs commonly occur around arteries in the substantia perforata, in the region of the anterior commissure, in the centrum semiovale, or near the vertex of the brain ( Fig. 17 ). Their typical imaging appearance is that of sharply demarcated dotlike or linear CSF-filled spaces. Prominent or dilated perivascular spaces can be seen at all ages, even in the very young, in whom they are considered a normal finding. However, with aging, EPVSs may become more prominent and have been associated with presence of silent brain infarcts and WML load. This association with cerebral small vessel disease was further supported by recent evidence that in a large population-based sample of elderly individuals, those with hypertension had more prominent perivascular spaces compared with normotensives. More importantly, there are suggestions that EPVSs relate to subtle cognitive deficits and even increased risk of dementia, independent of WML volume and presence of brain infarcts. One peculiar location of EPVSs is the hippocampal area, where they may be named hippocampal cavities or hippocampal cysts (see Fig. 17 ); some consider these to represent failure of closure of the hippocampal sulcus rather than EPVSs. Irrespective of their presumed origin and notwithstanding the interesting location, no clear role has been attributed to the presence of these cystlike lesions in the hippocampal region.
Part II: structural neuroimaging in AD
Until recently, the diagnostic criteria for AD, most notably those set out by the National Institute of Neurologic Communicative Disorders and Stroke–Alzheimer’s Disease and Related Disorders Association (NINCDS-ADRDA), were based on clinical symptoms only, and antemortem diagnostic certainty was limited to probable AD. In the 2011 revision, the NINCDS-ADRDA criteria include structural and functional biomarkers to provide evidence of AD pathophysiologic process for research purposes. Early diagnosis of AD even with the revised NINCDS-ADRDA criteria is by definition impossible, because the presence of a dementia syndrome is required. Dubois and colleagues propose to discard this severity threshold and reserve the term AD for the in vivo clinicobiological expression of the disease, encompassing the whole severity spectrum of its clinical course. Within this framework, the diagnosis of AD requires the presence of the core diagnostic criterion of early episodic memory impairment, as well as a minimum of 1 supporting biomarker, derived from structural MR imaging, CSF, metabolic imaging, or genetics. The distinction between possible and probable AD, as made with the NINCDS-ADRDA criteria, is no longer made; instead a distinction is made between typical and atypical AD. Although these criteria are not yet widely accepted as clinical diagnostic criteria, they emphasize the increasing diagnostic role for structural neuroimaging in AD.
Typical Presentation of AD
The radiological hallmark finding of AD is cortical atrophy caused by neuronal degeneration and loss. Atrophy is diffuse, but more prominent in the temporal and parietal lobes, with the hippocampus most severely and disproportionately affected ( Fig. 18 ). The primary motor and sensory cortices are relatively spared until late in the disease. Findings are bilateral and generally symmetric, but a certain degree of asymmetry may occur. White matter volume is also reduced, presumed to be secondary to Wallerian degeneration after cortical neuronal cell death. Ventricles and sulci are consequently also enlarged. Widening of the CSF spaces is most prominent surrounding the entorhinal cortex and the hippocampus (ie, the temporal horn and the choroid fissure). The temporospatial distribution of atrophy follows that of the histopathologic characteristics of AD. Neurofibrillary tangles and neuropil threads first appear in the transentorhinal and entorhinal areas (parahippocampal gyrus), increasing in density during the course of the disease and appearing in the hippocampus, further progressing from the limbic system to the temporal and parietal association cortices and eventually to the entire neocortex. Accordingly, focal entorhinal cortical and hippocampal atrophy occurs early and remains the most prominent feature in the disease process.
Hippocampal atrophy
Multiple studies confirm hippocampal volume loss in patients with AD compared with healthy controls. Sensitivity and specificity in distinguishing patients with AD from healthy controls are in the range of 85% and 88%, respectively. Findings regarding entorhinal cortex atrophy are similar, but not more accurate than hippocampal atrophy to distinguish patients with AD from healthy controls.
Although atrophy of the medial temporal lobe is commonly seen in patients with AD (70%–95%), it is also frequently seen in patients with minor cognitive impairment (MCI), although the frequency is lower (60%–80%) and extent of hippocampal atrophy is less pronounced. However, sensitivity and specificity of hippocampal atrophy to identify prodromal AD are only in the range of 70%, indicating limited clinical usefulness. Adding entorhinal cortex measurements may improve accuracy, although findings are inconsistent. More recently, studies have focused on using hippocampal shape, rather than volume, to predict AD. Preliminary results are promising in that they show that hippocampal shape provides additional predictive value over hippocampal volume.
Hippocampal atrophy may be seen in other conditions, such as hippocampal sclerosis, mesial temporal sclerosis and temporal lobe epilepsy, ischemic insults to the hippocampus, and herpes simplex encephalitis. Furthermore, hippocampal atrophy is common in other types of dementia, such as dementia with Lewy bodies (DLB), frontotemporal dementia (FTD), and the Heidenhain variant of Creutzfeldt-Jakob disease (CJD). Consequently, diagnostic accuracy to distinguish AD from other dementias is considerably lower than from healthy controls.
Medial temporal atrophy rating scale
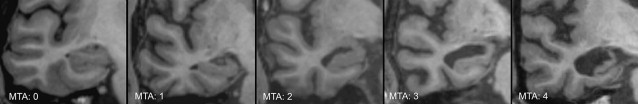
The most commonly used and well-validated method to assess hippocampal atrophy is the medial temporal atrophy (MTA) scale. This 5-point visual rating scale ranging from normal (score = 0) to severe atrophy (score = 4) assesses 3 easily recognizable structures on coronal MR images: the width of the choroidal fissure, the width of the temporal horn, and the height of the hippocampal body ( Fig. 19 , Table 3 ). A score of 0 to 1 may be considered normal in persons younger than 75 years, whereas a score of 2 may still be considered normal at older than 75 years. The MTA scale correlates well with both linear and volumetric measurements of the hippocampus and has reasonable interobserver agreement, with best results obtained when the scale is dichotomized (MTA = 0–1 vs MTA = 2–4). In the absence of automated algorithms it is less time-consuming than manual volumetric assessment, but has greater interrater variability.
Related posts:
 Spatial Distribution and Secular Trends in the Epidemiology of Alzheimer’s Disease
 Clinical and Research Diagnostic Criteria for Alzheimer’s Disease
 Neuroimaging of Dementia with Lewy Bodies
 Frontotemporal Lobar Degeneration: New Understanding Brings New Approaches
 Frontotemporal Lobar Degeneration: New Understanding Brings New Approaches
 Molecular Neuroimaging in Alzheimer’s Disease
Stay updated, free articles. Join our Telegram channel

Full access? Get Clinical Tree


