Abstract
Super-resolution (SR) ultrasound imaging dramatically improves the resolution of microvascular images beyond the diffraction limit. It is well-established that ultrasound with contrast agents, such as those used in SR, can open the blood–brain barrier (BBB) under certain conditions. This study aimed to quantify potential BBB disruption (BBBD) during 3-D transcranial ultrasound SR as a function of mechanical index (MI) and pressure distribution. Mice were imaged using conventional 3-D SR sequences. BBBD was quantified through fluorescence imaging of dye extravasation for mechanical indices in the range of 0–0.78 (measured in water). The results suggest that when 3-D SR images are acquired at 0.78 MI, BBBD occurs; however, imaging was achievable without significant dye extravasation below 0.78. In addition, hydrophone measurements and 3-D simulations were performed to estimate local pressure distributions in the brain. For a transducer surface MI of 0.64, estimates of the local MI within the brain averaged 0.18 ± 0.09, ranging from 0.03 to 0.44, with no significant BBBD observed. However, for a transducer surface MI of 0.78, significant BBBD was observed ( p < 0.05), where the values in the brain range from 0.04 to 0.53, averaging 0.22 ± 0.11. This suggests that the local MI that generates BBB bio-effects is within the range of 0.44–0.53 MI. For the 0.78 MI case, 4.8% of the total brain volume had a pressure above 0.44 MI according to hydrophone measurements (4.8 mm 2 of the 100 mm 2 2-D plane scanned) and 11.10% according to simulations (74.6 mm 3 of the 777.5 mm 3 volume).
Introduction
Super-resolution (SR) ultrasound (US) imaging, also known as US localization microscopy, is an emerging imaging technique that resolves the microvasculature beyond conventional US diffraction limits using spatiotemporally separable scatterers, such as microbubble (MB) contrast agents [ ]. These scatterers can be isolated from the surrounding noise and slow-moving tissue, allowing them to be localized and tracked to create detailed images of the microvasculature [ , ]. SR US has found broad application in the brain in both 2-D and 3-D, showing promise to visualize vascular structures and measure function in stroke, glioblastoma or Alzheimer’s disease [ ]. However, it is known that contrast-enhanced ultrasound (CEUS) can cause bio-effects such as blood–brain barrier disruption (BBBD) [ ].
The blood–brain barrier (BBB), composed of tight endothelial junctions, astrocytes, pericytes, and the glycocalyx, is a semi-permeable barrier between the microvasculature and the interstitium of the brain, allowing for reduced vascular permeability of cerebral blood vessels to endogenous substances and exogenous compounds [ ]. The BBB can be disrupted naturally by neurological diseases such as Alzheimer’s disease and stroke [ , ] or artificially induced to evaluate the potential for chemotherapeutic delivery to the brain [ ]. However, for the goal of neuroimaging, the BBB should be perturbed as minimally as possible to limit harmful substances from reaching the brain. Numerous effects are involved in contrast-enhanced BBBD including cavitation, radiation force, and mechanical stresses [ ]. Oscillations of MBs, called cavitation, change the MB diameter, pushing on the tight endothelial junctions [ ]. Typically, BBBD with focused US occurs when contrast is excited at low frequencies (0.2–1.05 MHz), with a peak negative pressure around 0.5–1.15 MPa [ ] and high duty cycles. However, studies have also demonstrated BBBD with a low duty cycle (0.0003–1%) at 1.18–1.63 MHz [ , ]. Two studies have demonstrated BBBD with clinical scanners using imaging sequences with higher frequencies, a low duty cycle and/or larger sonicated areas. Bing et al. demonstrated BBBD with color Doppler at a 0.07% duty cycle with a 5.7 MHz transmit [ ]. Zhao et al. showed BBBD with a phased array transducer and MBs at mechanical indexes (MIs) from 0.2 to 0.8 at a 1.5 MHz transmit [ ].
When performed transcranially, the potential for BBBD is also affected by the inhomogeneity and geometry of the skull [ ]. For example, results from O’Reilly et al. showed that US wavelengths approaching skull thickness generate heterogeneous pressure distributions through said skull [ ]. Thus, US beam paths and pressure, especially at high frequencies, are impacted by the skull. Standing waves can also be generated from said properties of the skull, which can increase peak pressures delivered, generating high-pressure hotspots outside of the focus [ , ]. The US FDA label of Definity recommends that the MI should not exceed 0.8 in adult patients during CEUS [ ]. The American Institute of Ultrasound in Medicine recommends minimizing time with CEUS above 0.4 MI [ ]. However, even imaging below 0.4 MI may result in pressures higher than expected due to skull heterogeneity. Recent 3-D transcranial SR imaging has been performed in rodents using angled plane waves at frequencies above 7.8 MHz with MIs between 0.3 and 0.6 and high frame rates [ , ]; however, no studies have quantified BBBD using these imaging schemes.
To quantify the effects of 3-D SR imaging on BBBD, this study used volumetric imaging with an 8 MHz Vermon (Vermon S.A., Tours, France) matrix array with five angle plane wave transmission, as we have used for recent SR US imaging studies [ , ]. BBBD was tested, as evaluated from Evans blue (EB) dye extravasation detected by fluorescence imaging ex vivo , at non-derated transmitted MIs of 0.28, 0.64 and 0.78. However, the acoustic field inside the skull is highly heterogeneous and a scalar MI does not capture this complex acoustic environment. Thus, pressure measurements through ex vivo skull caps and simulations of intact skulls with computed tomography (CT)-derived models were conducted to quantify the effects of US attenuation, lensing and reverberations, relating heterogeneous intracranial acoustical distributions to experimental results.
Materials and methods
Animal experiments
In vivo experiments were performed to quantify BBBD during 3-D SR brain imaging with approval from the University of North Carolina Institutional Animal Care and Use Committee. A total of 31 CD-1 mice (female, 12 wk old, 20–40 g) with 3 experimental groups (n = 8 per group) and 1 control group (n = 7; one mouse reached a humane euthanasia endpoint early and could not serve as a control for analysis) were imaged. The main experimental steps are summarized in Figure 1 .

Animals were anesthetized with vaporized 2% isoflurane carried by medical air. The head was depilated, fixed into a stereotaxic frame (Stoelting Co., Wood Dale, IL, USA) and coupled to the transducer with US gel. The transducer was placed 10 mm away from the mouse skull to avoid noise from compounding angle transmits. A 2% solution of EB dye (Sigma-Aldrich, St. Louis, MO, USA; 4 mL/kg) in phosphate-buffered saline (1× PBS) was injected through the tail vein, as previously reported in Song et al. [ ]. EB dye is commonly used for measuring BBBD due to its large molecular weight and affinity to bind to albumin, preventing it from crossing the BBB normally [ ]. Significant detection of EB between control and experimental groups indicates BBBD. Next, a 30 µL bolus of in-house-fabricated MBs (diluted with 0.9% NaCl saline to 1.8 × 10 8 mL -1 g -1 ) were injected. MBs were comprised of a phospholipid monolayer and decafluorobutane gas core, including a 1.5 mL lipid solution and a gas headspace of decafluorobutane (1 µm mean diameter and 2 × 10 10 mL -1 concentration), which were agitated in a 3 mL vial in a VialMix (Lantheus Medical Imaging, North Billerica, MA, USA) [ ]. Size distribution for the in-house MBs can be found in Kierski et al. with an average diameter of 0.97 ± 0.51 µm (mode = 0.6 µm, median = 0.9 µm), measured by an Accusizer 780 AD (Entegris, Billerica, MA, USA) [ ]. The MBs were infused at 15 µL/min during imaging, following 1 min of infusion without imaging to reach steady state before acquisition (total duration = 200 s; effective total volume MB solution injected per animal = 65 µL). The control group received EB dye without MBs or US.
US-induced BBBD has been shown to modulate cerebral blood flow [ ]. Thus, EB was allowed to circulate for 3 h to avoid perfusion defects after imaging. During this time, animals were returned to their cage, following protocol, until they were euthanized via anesthesia overdose. Transcardial perfusions were performed via infusion through the left ventricle, outflowing through an incision on the right atrium. A total of 10 mL PBS was perfused to clear out blood followed by a 2 mL/min perfusion of 10% formalin in a phosphate buffer solution for brain tissue fixation. Craniotomies were performed for brain harvesting. Brains were fixed in 10% phosphate buffer solution over 24 h, then washed with and placed into 100% PBS for 72 h.
US imaging
Transcranial SR imaging was performed with sequences described by McCall et al. (single-cycle transmit = 0.128 µs, five angled plane waves with pulse repetition frequency (PRF) = 2500 Hz for 200 s; duty cycle = 0.03%) [ , ]. Imaging was conducted after injection of EB and MBs. Four MIs were used, including a 0, 0.28, 0.64 and 0.78 MI transmit. An MI of 0.78 was chosen, as this was the highest setting possible without risk of damaging the transducer. An MI of 0.64 was chosen because it has successfully generated 3-D transcranial SR images in the past. The lowest MI was selected as half of the middle MI (0.64) to provide an intermediary pressure to test for potential bio-effects.
Evaluation of BBB disruption
Brains were imaged with an IVIS Spectrum (PerkinElmer, Waltham, MA, USA; excitation filter = 640 nm, emission filter = 680 nm). For every brain, whole-brain fluorescence images and individual coronal slices (eight total, 1 mm thick) were imaged, with slices from the region 3 mm ahead of the bregma (corresponding to the first slice) to the region 5 mm behind the bregma (corresponding to the last slice). Fluorescence results are reported both for whole-brain and individual slices. The slice corresponding to 2 mm ahead of the bregma was analyzed to account for the possibility of blood–choroid barrier opening [ ].
Fluorescence intensity was quantified as radiant efficiency in AURA 4.0.7 (Spectral Instruments Imaging, Tuscon, AZ, USA) by drawing a rectangular region of interest (ROI) encompassing the whole brain for every coronal section. To evaluate for BBBD, an ordinary one-way analysis of variance (ANOVA) test was performed on fluorescence intensity across the entire brain as well as every coronal section. The mean fluorescence intensity from each MI group was compared with the respective mean of the control group via Dunnet’s multiple comparisons test.
All statistical analyses were performed in GraphPad PRISM (version 10.0.0 for Windows, GraphPad Software, Boston, MA, USA; www.graphpad.com ). Statistically significant differences were considered at p < 0.05. Data are presented as mean ± standard deviation (STD), and statistical significance is graphically depicted as *.
US localization microscopy processing
Received US data were processed using MATLAB (The Mathworks, Inc., Natick, MA, USA) to create 3-D SR images as described by McCall et al. [ ]. Briefly, processing consisted of delay-and-sum beamforming on an isotropic grid with a step size of lambda/2 on a Graphics Processing Unit workstation. The MB signal was then enhanced using singular value decomposition filtering [ ]. The MB signal was localized using weighted centroids and then tracked using the Hungarian algorithm ( simpletracker ) [ ].
Ex vivo characterization
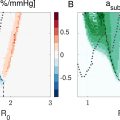
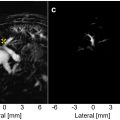
To measure the effects of attenuation, aberration and transmission patterns, acoustic characterizations were performed with the calvaria. Skull caps were removed from control through craniotomy (after euthanasia), washed, placed in 100% PBS solution and stored at 4 °C. The skulls were later scanned with a µCT 80 (SCANCO Medical AG, Wangen-Brüttisellen, Switzerland; 50 µm resolution, 70 kVpp, 113 µA, 4 W) for US simulations in Fullwave2 (described in the ‘3-D simulations’ section). The skulls were degassed, fixed in place by epoxy bonding under the transducer and a 2-D beam map was calculated with an ONDA HNC-0200 hydrophone needle (ONDA Corporation, Sunnyvale, CA, USA) moved by a three-axis motion stage. The HNC-0200 was centered under the calvaria, 5 mm under its point of highest curvature, for measurement. The beam map was measured directly in front of (and parallel to) the probe’s surface with a 110 × 110 (10 mm × 10 mm) grid size and 8 µs of data, sampled three times.
Descriptive statistics (max, min, mean and STD of MI) were calculated from multiple hotspots, where a ROI mask was drawn. Estimated descriptive statistics for the maximum transmitted MI were calculated using an attenuation co-efficient, calculated by dividing by the transmitted MI. The total area of BBBD was calculated by first rescaling the hydrophone measurements to the maximum MI estimates and then counting the number of pixels with an MI higher than that maximum multiplied by the area of the hydrophone needle tip (200 µm).
3-D simulations
Simulation were performed using 3-D Fullwave2 to characterize the full 3-D acoustic field inside the skull, allowing for accurate measurements of reflections and the complex interactions caused by the skull. Fullwave2 uses a finite difference in the time domain approach to solve the wave equation [ ]. Simulations were performed using 12 points per wavelength and a Courant-Fredrichs-Lewy condition [ ] of 0.2 with a 16.43-µm grid size, requiring a run time of 72 h. To create the input maps, CT scans were segmented and converted from Hounsfield to acoustic parameters including sound speed, density and attenuation, with a maximum sound speed in the skull of 2900 m/s and a density of 2200 kg/m 3 [ ]. The attenuation map was generated using the following formula ( eqn [1] ) from Aubry et al. [ ]:
a=amin+(amax−amin)*ϕ3
Φ=1−H1000
To estimate the MI across the brain for the three different skullcaps, the intensity was plotted across the coronal slice containing the maximum for each of the skull caps. Total volume of BBBD was calculated by counting voxels with an MI higher than the maximum hydrophone measurement within a volumetric ROI spanning 6 mm in height, the typical height of a mouse brain [ ]. The total count was multiplied by the voxel size and divided by the ROI size to calculate the percentage of BBBD volume.
To calculate the standing wave ratio (SWR), which requires the entire skull to account for reflections within the skull, the whole skull was segmented from the CT scan of a deceased mouse from Dogdas et al. [ ]. The SWR was calculated using the following formula ( eqn [3] ) from Jones et al. [ ]:
∫nT−cyclenTPcw(x,y,z,τ)2dτ∫0nTPpw(x,y,z,τ)2dτ×PpwPcw
Related posts:
 Ambient Pressure Sensitivity of Subharmonic Vibrating Single Microbubbles
 Comparative Assessment of Real-Time and Offline Short-Lag Spatial Coherence Imaging of Ultrasound Breast Masses
 Chinese Association of Ultrasound in Medicine and Engineering, Superficial Organs and Peripheral Vessels Committee Expert Consensus on Selected Common Clinical Issues in Parathyroid Ultrasound (2024 Edition)
 Two-dimensional Speckle Tracking Echocardiography and Fetal Cardiac Performance During Fetoscopic Repair of Myelomeningocele
 Ultrasound-based Velocity Vector Imaging in the Carotid Bifurcation: Repeatability and an In VivoComparison With 4-D Flow MRI
 Hepatic Portal Venous Perfusion Imaging Using Vessel-Labeling Super-Resolution Ultrasound
Stay updated, free articles. Join our Telegram channel

Full access? Get Clinical Tree


