Abstract
Objective
To construct and select a better model based on ultrasonic-based radiomics features and clinical characteristics for prognostic subsets of pediatric neuroblastic tumors.
Methods
Data from 73 children with neuroblastic tumors were included and divided into a training group and a validation group. Data 1 contained the subjects’ radiomics features and clinical characteristics, while data 2 contained radiomics features. With the help of machine learning, five models were constructed for data 1 and data 2, respectively. The model with the highest accuracy and area under the curve was selected as the combined model and radiomics model for data 1 and data 2, respectively. A superior model was then chosen from the models after further comparison.
Results
The extreme gradient-boosting model for data 1 was chosen as the combined model and the extreme gradient-boosting model for data 2 was chosen as the radiomics model. The area under the curve of the combined and radiomics models in the validation group was 0.941 and 0.918 ( p = 0.6906). The balanced accuracy, kappa value and F1 score of the radiomics model (0.9045, 0.8091 and 0.9091, respectively) were higher than those of the combined model (0.8545, 0.7123 and 0.8696, respectively). The top eight features of the radiomics model included five first-order statistical features and three textural features, all of which were high-dimensional features.
Conclusion
Our study proved that the radiomics model outperformed the combined model at differentiating prognostic subsets of pediatric neuroblastic tumors. Additionally, we found that high-dimensional ultrasonic-based radiomics features surpassed other features and clinical characteristics.
Introduction
Peripheral neuroblastic tumors (pNTs), which consist of neuroblastoma (NB), ganglioneuroblastoma nodular (GNBn), ganglioneuroblastoma intermixed (GNBi) and ganglioneuroma (GN), are among the most common extracranial solid tumors in infancy and childhood [ ]. They derive from primordial neural crest cells of varying maturity, with NB the most immature category and GB the most mature category in sequence [ ]. According to the International Neuroblastoma Pathology Classification (INPC), the four categories of pNTs could be divided into two distinct prognostic subsets: favorable histology (FH) and unfavorable histology (UH) [ ]. On the basis of morphologic features (grade of differentiation and mitosis karyorrhexis index) and patient age at diagnosis, NB and GNBn have been classified into FH and UH groups, while GNBi and GN are classified into the FH group [ , ]. The INPC has clearly defined the survival probabilities of the FH and UH groups by over 90% and below 50%, respectively [ ]. For patients with GN and GNBi, incomplete resection with minor residuals (<2 cm) appeared not to influence their overall outcome with or without chemotherapy [ , ]. Natasha et al. indicated that surveillance for patients with GN and GNBi was feasible and could spare surgical morbidities [ ]. Therefore to optimize treatment, it is necessary to accurately determine the prognostic subsets of pediatric pNTs pre-operatively.
At present, the pre-operative detection of pNTs includes radiography, ultrasound examination, computed tomographic, magnetic resonance imaging (MRI), scintigraphic evaluation and so on. Ultrasound examination is the first-line imaging method for the pre-operative assessment of extracranial tumors due to its low cost, non-invasiveness, lack of radiation and wide distribution. However, although ultrasound examination might discover some heterogeneously echogenic between GNB and NB, aid in evaluating the tumor, its adjacent organs and other organs, it is difficult to discriminate among these three tumors at ultrasonic imaging evaluation, let alone predict prognostic subsets of pNTs [ ]. Computed tomographic and MRI had therefore been used for determination of the organ of origin and regional invasion [ ], and the literature suggested that diffusion-weighted MRI has the potential to classify NB from GBN/GN [ ]. However, unlike classifying prognostic subsets of pNTs, differentiating NB from GBN/GN shows less benefit for patient prognosis. Thus, there is an urgent need to find a new ways of predicting prognostic subsets of pediatric pNTs.
With the development of computer science and medical imaging, radiomics has promoted the diagnostic and predictive value of identifying diseases based on medical images. It converts high-throughput features into mineable data using automated algorithms, extracts microscopic details that are difficult to identify with the human eye and applies them in a clinical decision support system [ , ]. Qian et al. found that the combined model of 18 F-fluorodeoxyglucose positron emission tomography/computed tomography-based radiomics and clinical factors could predict prognostic subsets in pediatric pNTs [ ]. Thus, we propose a similar predictive value of ultrasonic-based radiomics for prognostic subsets in pediatric pNTs.
Hence, the purpose of this retrospective study was to construct and select a better model based on ultrasonic-based radiomics and clinical characteristics for prognostic subsets of pediatric pNTs.
Materials and methods
This retrospective study was conducted in accordance with the Declaration of Helsinki (as revised in 2013) and approved by the institutional Ethics Committee of the Second Affiliated Hospital of Wenzhou Medical University (2024-K-072-02). Informed consent was waived by the local Ethics Committee in view of the retrospective nature of the study and all procedures performed being part of routine care.
Patients
The data of 101 patients who were diagnosed with pNTs pathologically from June 2009 to April 2023 were retrospectively collected at our hospital (The Second Affiliated Hospital of Wenzhou Medical University, No. 109 West Xueyuan Road, Wenzhou, 325000, Zhejiang, China). Inclusion criteria were as follows: i) Patients diagnosed with NB, GNBn, GNBi or GN pathologically by surgery or percutaneous core needle biopsy; ii) pre-operative or pre-percutaneous core needle biopsy ultrasound examination was performed, with the images saved as JPEG files. Exclusion criteria were as follows: i) Patient age at diagnosis older than 18 years; ii) radiofrequency ablation before surgery or percutaneous core needle biopsy. Ultimately, 73 patients were included in this study, with 25 cases of GN, 12 cases of GNBi, 2 cases of GNBn and 34 cases of NB. The mean age and female-to-male ratio of the cohort were 45.5 ± 39.8 months (range, 0.4–180 months) and 1.09:1 (38:35). According to the INPC, the 25 cases of GN, 12 cases of GNBi and 2 cases of GNBn were classified into the FH group, while the 34 cases of NB were classified into the UH group [ ]. A flowchart of this study is shown in Figure 1 .

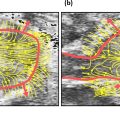
Tumor segmentation and ultrasonic-based radiomics feature extraction
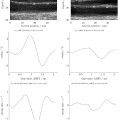
Convex array and linear probes were employed in ultrasound examination. The frequency of probes varied from 4 to 14 MHZ depending on patient age and tumor size. Ultrasonic diagnostic systems included Philips EPIQ7C (Philips Medical Systems, The Netherlands), Esaote MyLab Class C (Esaote, Italy), Mindray Resona 7T (Mindray Medical International, China), GE Volume E8 (GE Medical Systems, USA) and Siemens SEQUOIA 512 (Siemens Medical Solutions, USA). Images of the largest sections of tumors were chosen for feature extraction. To obtain the best image quality, their gain and depth were adjusted individually. Two experienced sonographers who were blinded to the prognostic patient subsets reviewed the images and delineated the region of interest manually using labelme from anaconda ( https://www.anaconda.com/ ). A histogram equalization algorithm and normalization were employed in order to reduce image noise and increase the contrast of the structures of interest. The scale within the region of interest was normalized from 0 to 255. The binWidth (bin size) of the images was 25. Re-sampling was skipped due to the 2-D nature of the ultrasonic images. Ultrasonic-based radiomics features were then extracted using open-source software (Pyradiomics, http://pyradiomics.readthedocs.io/en/latest/index.html ), including first-order statistical features and textural features. The gray matrices of the textural features included the gray level co-occurrence matrix (GLCM), gray-level dependence matrix (GLDM), gray-level run length matrix (GLRLM), gray-level size zone matrix (GLSZM) and neighborhood gray-tone difference matrix (NGTDM). Additionally, filters such as Laplacian of Gaussian (LOG) with different sigma values (1.0–10.0 mm with 1.0 mm steps), wavelet with transform (low-pass [L]; high-pass [H]), square, square root, logarithm, exponential and gradient were employed for high-dimensional features ( Fig. 2 ).

Feature selection, machine learning and predictive performance of models
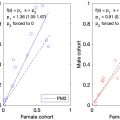
The intra-class correlation co-efficients of ultrasonic-based radiomics features were calculated, and features with intra-class correlation co-efficients >0.95 were retained. The dataset was divided into a training group (n = 52) and a validation group (n = 21) at random by a ratio of 7:3. Features of the combined model included ultrasonic-based radiomics features and clinical characteristics (sex and age; data1), while features of the radiomics model included ultrasonic-based radiomics features (data2). After standardized by Z-score standardization, data1 and data2 were selected using least absolute shrinkage and selection operator (LASSO) regression, respectively. To avoid over-fitting and select the most significant features, sevenfold cross-validation and parameter tuning was used. In order to have the best model, classifiers such as randomforest (RF), k-nearest neighbor (KNN), binary logistics regression (LR), support vector machine (SVM) and extreme gradient boosting (xgboost) were applied. The predictive performance of different models for data1 and data2 were compared by area under the curve (AUC), accuracy, balanced accuracy, sensitivity, specificity, positive-predictive value and negative-predictive value. The models with the highest AUC, accuracy and balanced accuracy in the validation group were chosen as the combined model and radiomics model, respectively. The predictive performance of the combined and radiomics models were then further compared by kappa value and F1 score ( Fig. 2 ).
Statistical analysis
Statistical analysis was performed on SPSS software (version 19.0, IBM) and RStudio software (version 4.0.3). Normality analysis, Mann-Whitney U test and χ 2 square analysis were carried out using SPSS software, while random allocation, Z-score standardization, LASSO regression, binary LR, KNN, RF, SVM, xgboost, DeLong’s test, Confusion Matrix and other statistical analysis were performed with RStudio software. A p value less than 0.05 was considered statistically significant.
Results
Clinical characteristics
The clinical characteristics of cases in the training and validation groups were summarized in Table 1 . The ratio of FH/UH for the two groups was 1.2 (28/24) and 1.1 (11/10), respectively, and no significant differences were seen between the two groups aside from sex. The images acquired by Philips EPIQ7C, Esaote MyLab Class C, Mindray Resona 7T, GE Volume E8 and Siemens SEQUOIA 512 accounted for 54.8% (40/73), 23.3% (17/73), 2.7% (2/73), 4.1% (3/73) and 15.1% (11/73).
| Characteristic | Training group (n = 52) | Validation group (n = 21) | p value |
|---|---|---|---|
| Prognostic subset | 0.160 | ||
| FH group | 28 (53.8) | 11 (52.4) | |
| UH group | 24 (46.2) | 10 (47.6) | |
| Sex | 0.035 | ||
| Male | 29 (55.8) | 6 (28.6) | |
| Female | 23 (44.2) | 15 (71.4) | |
| Age (months) | 48.6 ± 41.1 | 37.8 ± 36.2 | 0.215 |
Feature selection, machine learning and model construction
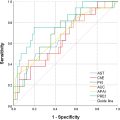
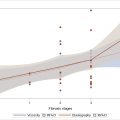
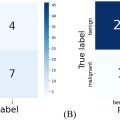
In total, 1674 ultrasonic-based radiomics features were extracted in our study, including 324 first-order statistical features and 1350 textural features. Among them, 1581 radiomics features were high-dimensional features. After intra-class correlation co-efficient calculation, 1403 radiomics features were retained. All features from data1 (1405 features) and data2 (1403 features) were selected by LASSO regression, and 34 features and 11 features were retained afterward, respectively. Progression of feature selection by LASSO regression is shown in Figure 3 . Five different classifiers were employed based on the features selected above. For the combined model, the xgboost model revealed the highest AUC with p < 0.05, aside from the LR and RF models. However, its accuracy and balance accuracy were higher than those of the LR and RF models. Thus, xgboost was considered to be the best model and was selected as the combined model ( Table 2 ). For the radiomics model, although the xgboost model showed the highest AUC without significant differences, its accuracy and balance accuracy were higher than the others ( Fig. 4 a and Table 3 ). Hence, the xgboost model was selected as the radiomics model.

Related posts:
 Quantitative Analysis of Contrast-Enhanced Ultrasound Images of Brain-Dead Donor Livers: Prediction of Early Allograft Dysfunction
 Safety of Shear Wave Elastography as Evidenced From Carotid Artery Strain and Strain Rate Induced by Acoustic Radiation Force Impulse and Arterial Pulsations
 Ultrasound Shear Wave Elastography and Shear Wave Dispersion: Correlation with Histopathological Changes in Autoimmune Hepatitis Patients
 Diagnosis of Salivary Gland Tumors Using Ultrasound Radiomics
 High-Frequency Ultrasound Characterization of Periodontal Soft Tissues Pre- and Post-Bacterial Inoculation
 Ultrasound Image Velocimetry for High Spatiotemporal Resolution Blood Flow Velocity Field Mapping in Mice
Stay updated, free articles. Join our Telegram channel

Full access? Get Clinical Tree


