Abstract
Objective
Ultrasound-based velocity vector imaging (US-VVI) is a promising technique to gain insight into complex blood flow patterns that play an important role in atherosclerosis. However, in vivo validation of the 2-D velocity vector fields in the carotid bifurcation, using an adaptive velocity compounding method, is lacking. Its performance was validated in vivo against 4-D flow magnetic resonance imaging (MRI). Furthermore, the repeatability of US-VVI was determined.
Methods
High frame rate US-VVI, which was repeated three times, and 4-D flow MRI data were acquired of the carotid bifurcation of 20 healthy volunteers. A semiautomatic registration of all US-VVI ( n = 60) and 4-D flow MRI data was performed. The 2-D velocity vector fields were compared using cosine similarity and the root-mean-square error of the velocity magnitude. Temporal velocity profiles from the common carotid artery and internal carotid artery were compared. The interobserver and intraobserver agreement of US-VVI was determined for peak systolic velocities and end-diastolic velocities.
Results
The registration was successful in 83% of cases. The 2-D velocity vector fields matched well between modalities, which is supported by high cosine similarities and low root-mean-square error of the velocity magnitudes. Temporal profiles showed high resemblance, with similarity indices of 0.87 and 0.80, and mean peak systolic velocity differences of 0.91 and 7.9 cm/s in the common carotid artery and internal carotid artery, respectively. Good repeatability of US-VVI was shown with a highest bias and standard deviation of 1.7 and 11.7 cm/s, respectively.
Conclusion
Good agreements were found of both vector angles and velocity magnitudes between US-VVI and 4-D flow MRI. Given the high spatiotemporal resolution, US-VVI enables the capture of small recirculating regions of short duration that are missed by 4-D flow MRI.
Introduction
Blood flow patterns play an important role throughout all stages of atherosclerosis. Complex, or disturbed blood flow patterns may induce atheroprone regions, as low and oscillating shear stresses near the vessel wall induce a local inflammatory process that stimulates plaque initiation and growth [ , ]. Multiple studies have shown a relation between increased carotid wall thickness and low wall shear stress areas [ ]. In contrast with low wall shear stress that stimulates plaque initiation and growth, high wall shear stress might be a trigger for further progression and, ultimately, plaque instability [ , ]. Given this association between local flow dynamics and atherosclerosis, it is of clinical importance to visualize and quantify (complex) blood flow patterns accurately.
Duplex ultrasound imaging is used routinely in clinical practice to assess the carotid and vertebral arteries, where local velocity estimates are obtained using pulsed wave Doppler. However, these velocity measurements are one dimensional as the velocity along the ultrasound beam direction is measured. As a result, a manual beam-to-flow angle correction is required to measure velocity in the direction of blood flow [ ]. However, alignment with the flow direction can be difficult, especially in branching arteries, such as the carotid bifurcation, where the direction of flow is often not aligned with the vessel wall and varies over the cardiac cycle owing to complex flow patterns and pulsatile distension of the vessel. Consequently, the current ultrasound systems are prone to operator dependency and are unable to measure complex blood flow patterns.
Currently, 4-D flow magnetic resonance imaging (MRI) is the only clinically available imaging technique that provides 3-D velocity information over time, and is therefore considered the gold standard for in vivo blood flow assessment. However, routine examinations in patients with carotid diseases are suboptimal, because scan times are long, costs are high, temporal averaging with cardiac (and sometimes respiratory) synchronization is required, and spatial and temporal resolution are limited, making the technique less suitable for imaging sporadic and unstable flow patterns [ ].
With the introduction of ultrafast ultrasound, multiple ultrasound-based vector flow imaging techniques have emerged that enable 2-D and 3-D ultrasound-based velocity vector imaging (US-VVI) without the need for a manual angle correction [ ]. Previous studies comparing novel US-VVI techniques to 4-D flow MRI showed good agreement in velocity profiles between both modalities, but mainly focused on anatomies other than the carotid bifurcation and used manual registration of the 2-D US and 3-D MRI data. Generally it was found that, owing to the increased spatiotemporal resolution, US-VVI enables capturing short lived events, interbeat variability and detailed blood flow patterns that are missed by 4-D flow MRI [ ]. In contrast, MRI proved to be more robust to patient-related factors, such as body mass index and anatomy, that might influence the US imaging quality [ ].
Saris et al. (2019) [ ] introduced an adaptive velocity compounding method that uses the axial displacement estimates of dual-angled plane waves that are acquired at a high pulse-repetition frequency to obtain 2-D US-VVI. This method provides 2-D blood velocities at high temporal and spatial resolution and was evaluated extensively in simulations and straight-vessel experiments. Furthermore, an initial in vivo evaluation was performed by comparing the velocity fields with Doppler recordings, after which the added value of the adaptive velocity compounding technique was illustrated clinically [ ]. However, an in vivo validation of this 2-D US-VVI technique against 4-D flow MRI, using adaptive velocity compounding in the carotid bifurcation, is lacking.
This study aims to investigate the in vivo performance of US-VVI to quantify spatiotemporal blood flow velocity profiles in healthy carotid arteries. US-VVI was compared against 4-D flow MRI and the repeatability of US-VVI in the quantification of blood flow velocities was investigated.
Methods
Study population
This single-center, prospective, observational study was conducted between November 2022 and March 2023. Ultrasound data and 4-D flow MRI scans were acquired in 20 healthy subjects (10 men; median age, 49 years; range, 24 to 75 years) without any history of cardiovascular or pulmonary disease or a contraindication for MRI. The study was performed in accordance with the World Medical Association Declaration of Helsinki. Informed consent was obtained from all participants. The study was approved by the authorized regional Medical Ethics Committee (NL80478.091.22) and the institutional review board, and registered at ClinicalTrials.gov (NCT05451485).
Ultrasound examination
All subjects underwent an ultrasound examination of the left carotid bifurcation when in supine position. US-VVI data were acquired at the carotid bifurcation, using an L12-5 50 mm transducer (Philips (ATL), Bothell, WA, USA) connected to a Verasonics Vantage 256 system (Verasonics, Kirkland, WA, USA). To facilitate proper transducer placement, real-time B-mode imaging was shown at 60 Hz, using eleven-angled coherently compounded plane waves between −10° and +10°. When the correct plane was imaged through the lumen center of the carotid bifurcation, a 3 second US-VVI acquisition was started. The US-VVI acquisition consisted of repeated −20° and +20° steered plane waves transmitted at a pulse repetition frequency of 10 kHz. Before saving the raw radiofrequency (RF) channel data, visual inspection of singular value decomposition-based clutter-filtered data served as quality check to confirm the presence of sufficient blood signal in the vessel lumen. The acoustic output of this imaging sequence was tested to be within the stated acoustic safety limits for peripheral vessel applications [ ], with a mechanical index of 0.56, I sppa,3 of 46.9 W/cm 2 , and I spta,3 of 137 mW/cm 2 . Regarding thermal safety, the high frame rate US-VVI acquisition duration is restricted to a maximum of 20 seconds. Therefore, the 3 second US-VVI acquisition does not exceed the maximum transducer contact surface temperature [ ]. An overview of the transducer and transmit parameters is provided in Table 1 . The active aperture of both plane waves was selected such that there was a maximum overlap of both steering beams at the center of the carotid artery. The US-VVI measurement was repeated three times, two times by a technical physician experienced with US-VVI measurements (observer 1) and once by an experienced sonographer (observer 2). Both examiners were blinded from each other’s ultrasound acquisitions.
| Property | |
|---|---|
| Center frequency (MHz) | 7.8 |
| Sampling frequency (MHz) | 31.2 |
| Transducer element pitch (µm) | 195.3 |
| No. of transducer elements | 256 |
| No. of simultaneously active elements | 128 |
| Elevational focus depth (mm) | 18 |
| Pulse length (cycles at <SPAN role=presentation tabIndex=0 id=MathJax-Element-1-Frame class=MathJax style="POSITION: relative" data-mathml='f’>?f f c ) | 3 |
| Pulse repetition frequency (kHz) | 10 |
| Transmit and receive angle ( o ) | ±20 |
| Acquisition duration (s) | 3 |
| Transmit voltage (V) | 50 |
| Apodization window in transmit | Tukey (150, 30%) |
| Apodization window in receive | Hamming |
| F-number | 0.875 |
| Axial sampling beamforming grid (µm) | 12.3 |
| Lateral sampling beamforming grid (µm) | 51.7 |
f
c , center frequency; US-VVI, ultrasound-based velocity vector imaging <SPAN role=presentation tabIndex=0 id=MathJax-Element-3-Frame class=MathJax style="POSITION: relative" data-mathml='.’>..
.
US-VVI analysis
The stored RF channel data were processed offline using MATLAB (version R2023a; The MathWorks, Natick, MA, USA). A detailed description of each post-processing step is reported previously by Saris et al. (2019) [ ]. A delay-and-sum beamformer was used to reconstruct the angled acquisitions into RF image lines on a cartesian grid oriented along the steering direction with a resolution (axial × lateral) of 12.3 × 51.7 µm [ ]. To suppress static tissue signal without sacrificing frames for filter initialization, a 150th order temporal sliding high-pass finite impulse response filter with a short transition region (−80 dB − 0 dB, 1 cm/s) was applied. The cut-off value (at −55 dB) was dynamically adapted to be equal to the 90th percentile of the absolute vessel wall displacement within an ensemble. Interframe tracking of the vessel wall contour and blood speckle in the vessel lumen was performed using a two-iteration, normalized cross-correlation based algorithm [ ], which was applied to the angled acquisitions separately ( Table 2 ). The displacement, or velocity, between two frames was estimated via the peak in the correlation map. The 2-D velocity vector maps were obtained by using the displacement compounding approach [ ], in which compounding of both angled axial estimates was performed when the correlation peak value for both angles was above 0.4 for more than 15 estimates within an ensemble. When this condition was met by only one of the angles, projection of this single-angle estimate was performed. When both angles did not match this condition, compounding was used and the final velocity vector was marked unreliable. The median of 39 compounded or projected interframe estimate, that is, 8 ms, was used to obtain a single ensemble averaged velocity estimate, resulting in 125 velocity vector fields per second. These estimates where first spatially filtered, followed by temporal averaging of three consecutive ensemble estimates, using a weighting of [0.25, 0.5, 0.25]. The final grid size of the velocity vector fields was 0.1 × 0.1 mm ( Table 2 ).
| Property | |
|---|---|
| Vessel wall displacement estimation | |
| Tracking rate (Hz) | 125 |
| Maximal trackable velocity (cm/s) | 4 |
| No. of iterations | 2 |
| Template size it1, axial × lateral (mm) | 1.0 × 1.0 |
| Template size it2, axial × lateral (mm) | 1.0 × 1.0 |
| Spatial filtering, axial × lateral (mm) | 1.5 × 1.5 |
| Blood speckle tracking | |
| Tracking rate (Hz) | 2500 or 5000 a |
| Maximal trackable velocity (cm/s) | Adaptive a |
| No. of iterations | 2 |
| Template size it1, axial × lateral (mm) | 2.33 × 2.33 |
| Template size it2, axial × lateral (mm) | 1.2 × 1.2 |
| Ensemble size (No. of frames) | 40 |
| Spatial filtering, axial × lateral (mm) | 0.25 × 0.25 |
| Temporal filtering | 3-ensemble [0.25 0.5 0.25] |
| Vector grid size, axial × lateral (mm) | 0.1 × 0.1 |
.
a Based on the maximal trackable velocity in a quick preview of the displacement estimations.
4-D flow MRI
All subjects underwent a free-breathing and retrospective vectorcardiographic-gated RF-spoiled gradient echo MRI scan with 3-D velocity encoding of the left carotid bifurcation. Images were obtained using a 3.0T MRI system (Ingenia, Philips Healthcare, Best, the Netherlands) together with a 20 channel head-and-neck coil (dStream, Philips Healthcare). The orientation of the head resembled the position during the ultrasound examinations. An overview of all acquisition settings is provided in Table 3 . MRI examination took place within 1 week after the ultrasound examination. Aliasing artefacts were prevented by setting the velocity encoding sufficiently high based on the MRI flow scout measurement. MRI data were corrected for offset and aliasing using CAAS software (Pie Medical, Maastricht, the Netherlands).
| Property | |
|---|---|
| Flip angle (°) | 8 |
| Repetition time (ms) | 4.6 [4.4–4.6] a |
| Echo time (ms) | 2.7 [2.6–2.7] a |
| Velocity encoding (cm/s) | 100 [90–120] b |
| Total acquisition time (min) | 11.7 [10.8–11.7] a |
| No. of cardiac phases | 28 |
| Spatial resolution (mm) | 1.21 × 1.21 × 1.21 |
a Note that these settings are influenced by the heart rate.
Registration of US-VVI and 4-D flow MRI
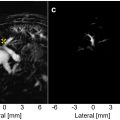
Semiautomatic registration of the 2-D ultrasound and 3-D MRI magnitude data was performed at peak systole using an in-house build registration algorithm, to find the slice through the 3-D MRI volume that best matched the 2-D ultrasound image ( Fig. 1 ). The lumen of the carotid artery was manually annotated in the 2-D ultrasound image and masking was applied to generate a binary image. The 3-D MRI magnitude data were cropped (71 × 51 × 31 voxels) around the left carotid bifurcation. Thresholding of the cropped magnitude data was automatically performed using the triangle method [ , ], which generated a 3-D binary MRI segmentation of the vessel lumen. When necessary, the resulting segmentation was adjusted manually to exclude the jugular vein.

The registration process consisted of a manual initialization followed by an automatic optimalisation. First, the user initialized a 2-D slice through the 3-D binary MRI segmentation which best matched the 2-D binary ultrasound image. The manual initialization was followed by a three-iteration automated optimization step, where stepwise translation and rotation was performed to optimize the 2-D MRI slice selection. The geometrical similarity between the binary ultrasound and MRI plane was assessed by the sum of absolute difference (SAD). Here, upsampling of the binary MRI plane (29 × 21), using nearest neighbor, was needed to match the size of the binary ultrasound image (2841 × 479). In the first iteration, translation and rotation in all three spatial directions were restricted to 5 mm (stepsize 2 mm) and 20° (stepsize 10°), respectively. The combination of translation and rotation resulting in the lowest SAD was defined as best match and used as input for the next iteration. In the final iteration, translation and rotation steps of 0.5 mm and 2° were used to select the best match between the binary MRI and ultrasound plane, and thus the optimal 2-D slice through the 3-D MRI volume. The 3-D MRI velocity vectors were projected on this 2-D slice and compared against the velocity vectors from US-VVI.
Comparison of US-VVI with 4-D flow MRI
All 60 ultrasound datasets were registered to the MRI data. Datasets with a relative SAD (SAD rel ) of less than 20% were defined as trustworthy and used for further analysis, with SAD rel defined as:
SADrel(%)=SAD(NUS+NMRI)·100,
N US
and <SPAN role=presentation tabIndex=0 id=MathJax-Element-7-Frame class=MathJax style="POSITION: relative" data-mathml='NMRI’>?MRINMRI
N MRI
are defined as the number of pixels within the vessel lumen of the ultrasound image and upsampled MRI image, respectively. A paired t test was used to test the added value of the automated registration, by investigating the difference in SAD rel between the manual-only and manual plus automated registration. The data were tested for normal distribution and a significance level of 5% was used.
The full 2-D velocity vector fields of US-VVI and 4-D flow MRI in the registered plane were compared at peak systole and end diastole by calculating the average cosine similarity in the carotid bifurcation, that is, the cosine of the angle between the MRI- and ultrasound-based velocity vectors, and the root-mean-square error of the velocity magnitudes (RMSE mag ) between the modalities. The US-VVI velocities were averaged spatially to match with the MRI resolution, that is, 1.2 × 1.2 mm in the axial and lateral directions. Only reliable US-VVI estimates were taken into account.
Furthermore, temporal velocity profiles were extracted from the 2-D velocity fields of both modalities in the common carotid artery (CCA) and internal carotid artery (ICA). The agreement between the temporal velocity profiles were compared by calculating the similarity according to:
Similarity=(VUS−VUS¯)·(VMRI−VMRI¯)|VUS−VUS¯||VMRI−VMRI¯|,
Related posts:
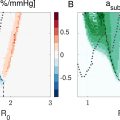 Ambient Pressure Sensitivity of Subharmonic Vibrating Single Microbubbles
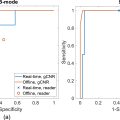 Comparative Assessment of Real-Time and Offline Short-Lag Spatial Coherence Imaging of Ultrasound Breast Masses
 Hepatic Portal Venous Perfusion Imaging Using Vessel-Labeling Super-Resolution Ultrasound
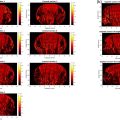 The Potential for Blood–Brain Barrier Disruption During Transcranial Ultrasound Super-Resolution Imaging
 Delivering Gd-Labeled IgG Antibodies Into the Mouse Brain Following Focused Ultrasound Treatment
 SSAT-Swin: Deep Learning-Based Spinal Ultrasound Feature Segmentation for Scoliosis Using Self-Supervised Swin Transformer
Stay updated, free articles. Join our Telegram channel

Full access? Get Clinical Tree


