Abstract
Objective
Abnormal hemodynamics is thought to play an essential role in the development of cardiovascular diseases. Mouse models are widely used for elucidating the underlying mechanisms; however, their small size and high heart rates make it difficult to perform quantitative flow velocity field mapping with sufficient temporal resolution. Our objective was to develop a noninvasive method for quantitative flow field mapping in mice based on speckle-tracking from high-frequency ultrasound B-mode imaging.
Methods
Ultrasound ECG-gated kilohertz visualization (EKV) was performed on a mouse-aorta-sized tubular flow phantom at frame rates up to 10,000 fps. Unexpected velocity underestimations were elucidated by simulating EKV reconstruction and performing ultrasound image velocimetry (UIV) in silico. A technique for error correction was developed and validated in vitro, and demonstrated in vivo.
Results
In flow phantoms, EKV-UIV underestimated velocity in the beam lateral direction by 50%–70%. This was attributed to loss of speckle contiguity owing to EKV’s retrospective strip-based reconstruction of the two-dimensional B-mode image. The proposed correction technique reduced the errors to <10% by accounting only for speckle movement within each image strip. A preliminary in vivo study showed that vortex shapes and near-wall expansion movement inside a mouse left ventricle were more aligned with physical expectations after correction.
Conclusion
A novel technique was developed to quantitatively map blood flow with high spatiotemporal resolution. Further optimization will enable longitudinal studies in mice to gain insights on the role of local hemodynamic forces in the development of cardiovascular diseases.
Introduction
Abnormal hemodynamics, such as high or oscillatory wall shear stress (WSS), is known to be associated with many cardiovascular diseases [ ]. For example, in patients with bicuspid aortic valve disease, blood exiting the left ventricle enters the ascending aorta as a high velocity jet due to a narrowed aortic valve orifice. This jet is usually skewed and impinges on the aortic wall, resulting in abnormally high local WSS; these impingement sites are also typically locations of aortic dilatation [ , ]. Abnormally high WSS has also been shown to be associated with localized degradation and weakening of vessel walls in cerebral aneurysms, increasing the risk of aneurysm rupture [ ]. Another example is atherosclerosis, in which oscillatory WSS associates with arterial regions prone to plaque formation [ , ]. As such, there is a need to understand and dissect the contribution of hemodynamics to disease development with the goal of enabling better diagnosis and treatment. However, the specific contributions of hemodynamics to vascular disease are difficult to dissect in humans due to confounding genetic and environmental variabilities. Animal studies can mitigate such variabilities, with mice as a particularly useful model that allows for genetic manipulation and/or surgical intervention to mimic human diseases [ , ] and longitudinal studies.
To study hemodynamics using a mouse model, the blood velocity field needs to be accurately quantified and mapped. Small animal blood flow imaging and quantification is an ongoing challenge due to limited spatial and temporal resolutions in existing preclinical imaging tools. Currently, common modalities for imaging mouse hemodynamics include magnetic resonance imaging (MRI) [ ] and color or pulsed-wave (PW) Doppler ultrasound [ , , ]. High spatial resolution velocity field information can be acquired using MRI but at an expense of decreased temporal resolution [ ]. Using MRI for small animals can also be costly and not widely available due to the need for high-field systems to achieve the required spatial resolution [ , ]. Color and PW-Doppler are more accessible but angle-dependent, with the velocity components measured only in the direction of the ultrasound beam axis.
Alternative approaches to blood velocity field mapping such as vector Doppler [ ] and ultrasound image velocimetry (UIV) [ ] have previously been applied in humans but are yet to be implemented in mice for high-speed flow in the heart or aorta. Vector Doppler [ ] can provide velocity fields but requires custom built setups for small animal applications, typically with multiple transducers. In UIV, the flow field is obtained from tracking blood speckle or contrast agent movement that is captured by ultrasound images and estimated by the cross-correlation technique of particle image velocimetry (PIV). Compared with vector Doppler or MRI, UIV is more accessible for preclinical small animal imaging and relatively easier to implement, needing only an ultrasound system. Current high frequency ultrasound imaging at 30 MHz and higher can be used to visualize the speckles of the blood flow in small animals such as mice, providing the possibility of tracking the movement of blood flow without using contrast agents. Conventionally, UIV has been performed on B-mode ultrasound, the temporal resolution of which is limited to a few hundred frames per second (fps) as this is constrained by the time required for the transducer to scan across the beam lateral direction of the field of view (FOV). While this is sufficient for imaging blood velocity fields for humans (with heart rates between 60–100 bpm) [ , ], a much higher frame rate would be necessary for mice with heart rates up to 600 bpm. In preclinical high frequency ultrasound systems for small animals, typical real-time B-mode imaging can reach a maximal frame rate of ∼1000 fps with the width of FOV reduced to the minimum (i.e., an image width of ∼2.4 mm), but this temporal resolution is not sufficient to capture the rapidly changing hemodynamic patterns throughout the cardiac cycle in mice [ ]. Plane-wave imaging has more recently been introduced for small animal ultrasound systems (e.g., the Vevo F2, Fujifilm VisualSonics Inc.) which can increase frame rate to the kilohertz range, but it has yet been studied for blood flow field mapping in mice. Real-time plane-wave imaging also typically comes at the cost of reduced image quality due to the use of unfocused beams [ ]. Coherent compounding can be used to improve image quality but is prone to artifacts in the presence of non-negligible motion [ ].
The temporal resolution limitations of conventional imaging can be addressed in preclinical systems with an advanced imaging functionality called electrocardiogram (ECG)-gated kilohertz visualization (EKV). In EKV, a 2D image cineloop is retrospectively reconstructed with a frame rate of >1000 fps, while at the same time allowing visualization of the blood flow pattern derived from the original speckles of blood flow. The temporal resolution can be improved to up to 10,000 fps by scanning narrower sub-sections, or image strips, of the FOV from separate cardiac cycles, and then stitching the image strips together based on their time point in each cardiac cycle ( Fig. 1 ). A few groups [ ] previously used an image reconstruction technique similar to EKV to measure left ventricle wall properties and blood flow in mice, but the images were constructed by scanning single image lines instead of image strips of finite width [ ]. Cross correlation was applied to evaluate wall movement and blood flow, but only along the direction of each scan line (i.e., 1D measurements). To our best knowledge, UIV with 2D EKV images has not been investigated. Due to the way that EKV images are reconstructed (i.e., speckles in one image strip are not contiguous with speckles in an adjacent image strip), the question of whether UIV applied to EKV images can provide reliable velocity field information remains to be answered.

In this study, we assessed the capabilities and limitations of UIV based on EKV images for the quantitative mapping of mouse blood velocity field. Using in vitro flow models, we identified bias errors due to the EKV image reconstruction technique. We created synthetic images to investigate the source of the errors, from which a correction technique was devised to improve the measurements and tested in silico and in vitro. Finally, EKV-based UIV with bias correction was applied to image blood flow in a mouse left ventricle as a proof-of-concept of the method. This technique establishes the foundation for future studies towards further optimization of an accessible and noninvasive method to quantify mouse cardiovascular hemodynamics in vivo. This will enable longitudinal studies in mice to gain insight on the effects of local hemodynamic forces in cardiovascular disease progression, and the association of flow patterns with disease severity.
Methods
In vitro flow loop
A straight tube in vitro flow loop was used first to assess UIV with EKV images. A polyethylene tubing of inner diameter 1.19 mm (Intramedic TM PE190) was connected to a syringe pump (Cole-Parmer® 74900) and positioned at <SPAN role=presentation tabIndex=0 id=MathJax-Element-1-Frame class=MathJax_Error style="POSITION: relative" data-mathml='θ’>θ
θ
= 90° or <SPAN role=presentation tabIndex=0 id=MathJax-Element-2-Frame class=MathJax_Error style="POSITION: relative" data-mathml='θ’>θ
θ
= 75° from the ultrasound beam axis ( Fig. 2 ). A blood mimicking fluid consisting of nylon scattering particles with diameters of 10 µm [ ] was used to produce speckle patterns in the ultrasound images. The blood mimicking fluid was pumped through the tube under steady, laminar conditions at three different flow rates Q1, Q2, and Q3 (pump settings 4.00, 20.02 and 36.70 ml/min, respectively, for a syringe diameter of 26.7 mm), each with theoretical (Poiseuille) peak velocities of 120, 600, and 1100 mm/s, respectively (corresponding to cross-sectional average velocities of 60, 300, and 550 mm/s). The flow was confirmed to be steady by comparing color and PW-Doppler velocity measurements over finite time intervals. Images of flow were acquired using a Vevo 3100 system with a 30 MHz (MX400) linear array transducer (Fujifilm VisualSonics Inc.). The images were collected in real-time B-mode at nominally 450 fps and in EKV mode between 1000 and 10,000 fps. For EKV image acquisition, artificial ECG signals were provided to the Vevo system using a waveform generator (Keysight 33600A). All images were exported using the Vevo LAB (v5.7.1) software as JPEG files. Color Doppler images were also acquired at pulse-repetition frequencies (PRF) of 4–40 kHz to obtain reference velocity values. The color Doppler velocities were extracted by first dividing the FOV (∼5 mm × 5 mm, depending on the size of the vessel and image slice) into small regions matching the size of the interrogation windows (IW) (nominally 350 µm × 350 µm) to be used for UIV, then finding the average RGB value of each region and comparing it to the Doppler color bar; the reference velocity values were averaged from five color Doppler measurements. Relative error for EKV measurements were then calculated using the following equation:
%Error=(vmeasured−vreference)vreference×100%
<SPAN role=presentation tabIndex=0 id=MathJax-Element-4-Frame class=MathJax_Error style="POSITION: relative" data-mathml='vmeasured=’>vmeasured=
v m e a s u r e d =
measured velocity value using UIV,
<SPAN role=presentation tabIndex=0 id=MathJax-Element-5-Frame class=MathJax_Error style="POSITION: relative" data-mathml='vreference=’>vreference=
v r e f e r e n c e =
reference velocity or ground truth value.

θ
to a straight tube through which a blood-mimicking fluid flowed under steady, laminar conditions.
Direct comparisons with theoretical ground truth values were avoided for in vitro data analysis due to challenges in identifying the centre plane axis of the tube during scanning; due to the tube’s small size, small misalignments may still result in sizable differences. The alternative approach of using color Doppler as reference was chosen instead to simplify the experimental process. Color Doppler provides the average velocity value (instead of a spectrum like PW Doppler) at each position across the image plane, facilitating direct comparisons with UIV values. To verify that color Doppler value can provide a reliable reference, UIV measurements of B-mode images, color Doppler measurements, and theoretical ground truth were compared across the tube radius and showed good agreement ( Supplemental Fig. S1 ). Table S1 summarizes other image acquisition settings of the Vevo 3100 system. Note that when images were exported from the Vevo software, the image resolution was higher than the resolution of acoustic information for the purpose of analysis, i.e., the images were interpolated by the Vevo software such that their image resolutions were increased through oversampling.
Synthetic image generation
Synthetic particle images were utilized to understand the bias error in velocity calculations observed in the in vitro experiments. The images were generated using code modified from the MATLAB toolbox PIVlab (v. 2.63) [ ]. Particle images were generated assuming steady flow, but every five images were grouped together into one cycle, as if the flow was cyclic. This was to mimic a heartbeat cycle and generate artificial gating for creating synthetic EKV images based on the method used in the Vevo 3100 software. Figure 3 shows the EKV reconstruction process for synthetic images. Each image represents a snapshot of a sample FOV from a specific time point ( <SPAN role=presentation tabIndex=0 id=MathJax-Element-7-Frame class=MathJax_Error style="POSITION: relative" data-mathml='t1−t5′>t1−t5
t 1 − t 5
) of a specific cycle. A single image strip was taken from each synthetic image, which was equivalent to an EKV subsection. A strip from the same image location was taken from all phases of a cycle to mimic the scanning of one subsection over a full cardiac cycle. A different cycle of images was used for each subsection, so that particles from one subsection never appeared in other subsections. The specifications of the images are listed in Table S2 . Round, Gaussian-blurred particles [ , ] were used instead of trying to replicate speckle-like point patterns [ ] as seen in typical ultrasound images, since the goal was to understand and analyze the effects of EKV image reconstruction on UIV results, and not how particle or speckle shape, or other factors such as image resolution, affect the velocity field data. Nevertheless, we will refer to such particle patterns as “speckle patterns” when discussing in silico results.

Speckle displacement between an in vitro or in vivo image pair was measured in pixels per frame (px/f) and is dependent on three factors: the true velocity, image frame rate, and image resolution. Note that the unit “pixels” in this study refers to the number of pixels present in an image, which reflects the image resolution (higher than the underlying resolution of acoustic information). When simulating particle images that correspond to real displacements, velocity in terms of pixels per frame, <SPAN role=presentation tabIndex=0 id=MathJax-Element-8-Frame class=MathJax_Error style="POSITION: relative" data-mathml='vpixel,’>vpixel,
v p i x e l ,
was calculated using
vpixel=vphysicalfr·res
<SPAN role=presentation tabIndex=0 id=MathJax-Element-10-Frame class=MathJax_Error style="POSITION: relative" data-mathml='vphysical=’>vphysical=
v p h y s i c a l =
actual velocity in physical units of mm/s,
<SPAN role=presentation tabIndex=0 id=MathJax-Element-11-Frame class=MathJax_Error style="POSITION: relative" data-mathml='fr=’>fr=
f r =
frame rate in fps,
<SPAN role=presentation tabIndex=0 id=MathJax-Element-12-Frame class=MathJax_Error style="POSITION: relative" data-mathml='res=’>res=
r e s =
image resolution in mm/px.
The equivalent frame rate for a synthetic EKV image pair was calculated using
fr=Vsweepwpixel·res
<SPAN role=presentation tabIndex=0 id=MathJax-Element-14-Frame class=MathJax_Error style="POSITION: relative" data-mathml='Vsweep=’>Vsweep=
V s w e e p =
beam sweep speed with which the ultrasound beam scans across the lateral (x-direction) of the targeted FOV
<SPAN role=presentation tabIndex=0 id=MathJax-Element-15-Frame class=MathJax_Error style="POSITION: relative" data-mathml='wpixel=’>wpixel=
w p i x e l =
image strip width in pixels.
Two types of particle displacement were generated for synthetic images: unidirectional and vortical. For the unidirectional displacement case, all particles moved at a <SPAN role=presentation tabIndex=0 id=MathJax-Element-16-Frame class=MathJax_Error style="POSITION: relative" data-mathml='45∘’>45∘
45 ∘
angle to the y axis at uniform equivalent particle displacements of 200, 650 or 1100 mm/s. Images at equivalent EKV frame rates of 5000, 8500, or 10,000 fps were generated for each displacement setting. For ease of comparison between in silico and in vitro experiments, equivalent physical units were used for the unidirectional velocity images. For the vortical velocity case, synthetic images were generated such that maximum rotational displacement was equivalent to an image resolution of 25 px/f, and displacements decreased linearly towards a value of 0 px/f at the center of the vortex; the image strip lateral width was chosen to be 40 px for demonstration.
Ultrasound image velocimetry
Velocity field data were obtained from the speckle images using the MATLAB toolbox PIVlab [ ]. An ensemble multipass window deformation algorithm with 50% step size was used to obtain velocity data prior to bias correction; a total of two passes were used for each image set. The sizes of IWs were chosen such that the maximum speckle displacement between consecutive frames did not exceed ¼ of the window size, and that there were typically 10 number of speckles in each IW. The physical size of the IWs were nominally 350 µm × 350 µm. A Gaussian 2 × 3 point sub-pixel estimator was used. For in vitro images, contrast-limited adaptive histogram equalization was used for image preprocessing; no image preprocessing technique was applied for in silico or in vivo images.
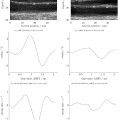
Bias correction
As described later in Results, we observed bias errors in the in vitro velocity measurements, which we were able to attribute to the loss of speckle contiguity from one strip to the next. A novel correction technique was therefore devised to reduce this bias. This was implemented using code modified from the Python module OpenPIV (v0.22.2) [ ]. First, conventional single-pass UIV was performed on EKV images. For each IW, the resulting lateral velocity data was used as an initial value to determine a range of possible true speckle displacement values, <SPAN role=presentation tabIndex=0 id=MathJax-Element-17-Frame class=MathJax_Error style="POSITION: relative" data-mathml='δ,’>δ,
δ ,
in the x-direction. This range was typically chosen to be ±30% of the initial value. Then, for each <SPAN role=presentation tabIndex=0 id=MathJax-Element-18-Frame class=MathJax_Error style="POSITION: relative" data-mathml='δ’>δ
δ
in the chosen range, the regions of the IW where speckle mismatch would occur were masked ( Fig. 4 ), such that if <SPAN role=presentation tabIndex=0 id=MathJax-Element-19-Frame class=MathJax_Error style="POSITION: relative" data-mathml='δ’>δ
δ
was equal to the true displacement <SPAN role=presentation tabIndex=0 id=MathJax-Element-20-Frame class=MathJax_Error style="POSITION: relative" data-mathml='δtrue’>δtrue
δ t r u e
, all the unmasked speckles were then perfectly matching for strictly in-plane motion. Based on basic PIV theory, any presence of unmatched speckles would lead to a bias error [ ], and therefore, the lateral displacement value measured using UIV of a masked IW pair would only match <SPAN role=presentation tabIndex=0 id=MathJax-Element-21-Frame class=MathJax_Error style="POSITION: relative" data-mathml='δ’>δ
δ
when <SPAN role=presentation tabIndex=0 id=MathJax-Element-22-Frame class=MathJax_Error style="POSITION: relative" data-mathml='δ=δtrue’>δ=δtrue
δ = δ t r u e
. This is indicated by the local minimum in Fig. 4 , in which the y-axis is the absolute difference between <SPAN role=presentation tabIndex=0 id=MathJax-Element-23-Frame class=MathJax_Error style="POSITION: relative" data-mathml='δ’>δ
δ
and the measured value from UIV. The value of <SPAN role=presentation tabIndex=0 id=MathJax-Element-24-Frame class=MathJax_Error style="POSITION: relative" data-mathml='δ’>δ
δ
that corresponds to the local minimum is the corrected displacement value.

Related posts:
 Quantitative Analysis of Contrast-Enhanced Ultrasound Images of Brain-Dead Donor Livers: Prediction of Early Allograft Dysfunction
 Safety of Shear Wave Elastography as Evidenced From Carotid Artery Strain and Strain Rate Induced by Acoustic Radiation Force Impulse and Arterial Pulsations
 Ultrasound Shear Wave Elastography and Shear Wave Dispersion: Correlation with Histopathological Changes in Autoimmune Hepatitis Patients
 Diagnosis of Salivary Gland Tumors Using Ultrasound Radiomics
 Empirical Model of Focused Ultrasound-Mediated Treatment for Chemotherapy Delivery to Brain Tumors
 High-Frequency Ultrasound Characterization of Periodontal Soft Tissues Pre- and Post-Bacterial Inoculation
Stay updated, free articles. Join our Telegram channel

Full access? Get Clinical Tree


