Introduction
Medical screening is the process of using a diagnostic algorithm to detect a disease or the susceptibility to develop a disease. A screening process can consist of a medical history, a blood sample that measures a biochemical marker such as cholesterol, or medical imaging to detect a morphological or functional trait. The screening process is normally applied to a patient population with predefined characteristics. The ultimate applicability of the screening process weighs the potential benefits of detecting and treating the individuals identified against the total costs to society. This form of public health screening is different from performing individual screening with the costs borne not by society but by the individual being screened.
This chapter focuses on the noninvasive approaches to arterial disease screening and focuses on B-mode (gray-scale) and Doppler ultrasound imaging in asymptomatic individuals. The goal is to identify, from a large group of individuals, a smaller subset with a high likelihood of disease so that some form of intervention can be selected and applied with the hope of decreasing disease morbidity. This approach is typically used in primary prevention. This means that the patient being screened is completely asymptomatic.
Some clinical scenarios are not covered in this chapter. For example, a patient with a prior lower extremity bypass graft who has undergone a Doppler ultrasound examination is not considered as being screened because the patient obviously has peripheral vascular disease. The patient is undergoing surveillance, a form of secondary prevention (i.e., the Doppler ultrasound is used to identify a bypass graft at risk of occlusion). In another scenario, a patient having had a recent stroke then undergoes a carotid ultrasound examination. This examination is not considered a screening test but is part of the clinical workup. In this instance, the goal is to detect a significant carotid artery stenosis that might have caused the neurologic event and then to treat it. This is also a form of secondary prevention because the patient already has the clinical outcome and the goal is now to prevent recurrent strokes.
This chapter will review some generic aspects of the screening process and then address three specific screening applications: (1) use of color and duplex Doppler ultrasound to detect significant carotid artery stenosis in asymptomatic individuals; (2) use of ultrasound to detect abdominal aortic aneurysms; and (3) use of carotid ultrasound to detect high-risk individuals for the presence of subclinical atherosclerosis.
Definition and Types of Screening
What is screening? The different elements of a screening process have been clearly presented in a World Health Organization (WHO) bulletin published in 1968. These basic principles are listed in Table 33.1 . Certain criteria have to be met for the screening process to be successful. These criteria will be discussed in the context of the three screening protocols reviewed later in this chapter.
|
|
|
|
|
|
|
|
|
|
a As presented by Wilson and Jungner in the World Health Organization Public Health Paper no. 34, Principles and Practice of Screening for Disease (1968).
The WHO bulletin describes three specific types of screening: selective screening, mass public health screening, and surveillance ( Table 33.2 ).
| Selective Screening | Mass Screening | Surveillance Screening | |
|---|---|---|---|
| Advantages | Appropriate for individuals | Applied to whole population | Applied to subset with precursor lesion and at highest risk of developing a clinical outcome |
| Decrease in costs compared with mass screening | Unlikely to miss individuals at risk | Permits timing of intervention | |
| Disadvantages | Expensive: high cost per individual | Expensive: low cost but for many individuals | Expensive: repeat examinations over time |
| Even low-risk individuals might have the lesion | False positives are very likely | Requires motivation to have repeat examinations | |
| Requires individual motivation | Large infrastructure needed to perform reliable test | Psychological effect of having a biological time bomb |
Selective screening
The selective screening approach is the application of a diagnostic test to a predetermined asymptomatic population whose members have been selected because they have one or more risk factors. The risk factors are different from the screening tool. For example, a clinical history of cigarette smoking is a risk factor for aneurysm formation. The yield of an abdominal ultrasound will therefore be greater in smokers than in nonsmokers. The problem with this approach is that the individual who has never smoked can still have an aneurysm, although the odds are much lower than for the smoker. However, being a nonsmoker would exclude the individual from the screening ultrasound.
Mass public screening
The second type of screening is a mass public screening. With this approach, the same test is used in the whole population. As commonly applied, mass screening is still selective because the individuals being screened are often selected on the basis of a specific demographic such as age and applied to those living in a given geographic location. Testing young children for low thyroid hormone levels is an example of such a screening process. The screen is then applied to children and not adults. Additional focus may be given to a geographic region where iodine deficiency may exist. The basic limitation with this approach is increased cost.
Surveillance screening
The third type of screening is surveillance screening. The WHO criteria indicate that the disease being screened for should have a defined natural history and an available treatment and/or intervention. For example, a patient is found to have an ectatic abdominal aorta with a diameter of 2.5 cm. Although the aortic diameter is less than the 3 cm threshold used to define an aneurysm, there is a strong likelihood that this aortic segment will continue to dilate and become an aneurysm over the next 5 to 10 years. The patient’s aortic diameter will need to be monitored because the risk of aneurysm formation is increased. Antihypertensive therapy and smoking cessation may have some impact at this early stage of the disease. The appropriate time interval for the surveillance examinations needs to be determined and justified.
- •
There are three types of screening:
- •
mass screening
- •
selective screening
- •
surveillance screening
- •
- •
Ultrasound imaging is more likely to be used for selective and surveillance screening.
Screening for Asymptomatic Carotid Stenosis
The goal of a carotid ultrasound screening examination is the detection of individuals who are asymptomatic, are at risk of stroke, and would benefit from an operative intervention such as carotid endarterectomy or endovascular stent placement. The Doppler screening criteria need to correlate with those of carotid arteriography because the benefits of carotid interventions are based on measurements of disease severity made with arteriography. This assumes there is a cut-point above which, by arteriography, a carotid stenosis is considered significant and an intervention decreases the risk of future stroke. The question then becomes how accurate is a Doppler ultrasound in detecting a stenosis and grading it when compared with arteriography?
Prevalence of significant carotid stenosis
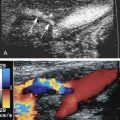
Published Doppler velocity cut points that are used to grade carotid artery stenosis severity are typically obtained from departments or vascular laboratories with a patient population having a high prevalence of carotid artery disease. This skewed perspective is made worse by the selection process that leads to the patient having a carotid arteriogram. These two factors contribute to a bias toward a high prevalence of disease. In essence, arteriography is being performed after the carotid ultrasound because there is a high suspicion of significant disease. Data obtained from publications correlating internal carotid artery peak systolic velocities with carotid angiography show this bias. The distribution of measured carotid Doppler peak systolic velocities is bimodal (i.e., there are two peaks) ( Fig. 33.1 ). The first peak is a mixture of false positives and relatively normal carotid bifurcations contralateral to the side of the lesion. The second peak includes the target lesions. This information does not give much insight into how carotid ultrasound might perform as a screening test in the general population.

The distribution of carotid disease can be estimated using Doppler velocities as a surrogate for carotid artery stenosis. Ideally, the true prevalence would be estimated by scanning the whole population, however this is not feasible based on simple economics. The alternative is to perform ultrasound in epidemiologic cohorts. These cohorts, such as the Framingham Heart Study (FHS), the Cardiovascular Health Study (CHS), and the Multi-Ethnic Study of Atherosclerosis (MESA) have a representative sampling of the general population. Carotid Doppler examinations in members of these cohorts show a very different pattern of disease from that seen in Doppler validation studies. In essence, the distribution shows a large primary peak and a taper into the high-velocity (stenosis) values ( Fig. 33.2 ). This sampling from the general population gives a better insight into using carotid artery Doppler ultrasound as a method to detect significant carotid artery disease in asymptomatic individuals within the general population.

Estimating the accuracy of carotid artery Doppler ultrasound
Accuracy of Doppler ultrasound for detecting the presence of a carotid artery stenosis above a certain threshold is measured by sensitivity and specificity values using the true positives, true negatives, false positives, and false negatives ( Table 33.3 ). Additional metrics such as the negative and positive predictive values are also very important when considering the value of a screening examination. A screening carotid Doppler examination has to be as sensitive as possible when compared with the gold standard measurement using arteriography ( Fig. 33.3 ). Although we would like to make sure that the individuals we classify as negative are without significant stenosis, we need to set a Doppler velocity threshold low enough so that all, or almost all, individuals with significant disease are identified. However, by setting a low velocity threshold, we detect not only individuals with significant stenosis but also individuals without disease, and the false positive rate increases. This leads to a low positive predictive value and a high negative predictive value ( Table 33.4 ). This is the basic dilemma of any screening test: the sensitivity has to be set very high. Therefore to screen a population for asymptomatic carotid artery stenosis, the Doppler velocity threshold for a given degree of stenosis is set lower than normal, and many individuals are misclassified as having a significant stenosis ( Fig. 33.4 ). The overall performance of this process is also affected by disease prevalence. With a low disease prevalence, more individuals are screened and more false positives occur.
| Disease Present | Disease Absent | |
|---|---|---|
| Test positive for disease | a | b |
| Test negative for disease | c | d |
| Total | a + c | b + d |

| Prevalence | Sensitivity/Specificity | True Positive | False Positives | Positive Predictive Value | Negative Predictive Value |
|---|---|---|---|---|---|
| 10% | 90%/90% | 180 | 162 | 52.6% | 98.8% |
| 95%/85% | 190 | 270 | 41.3% | 99.4% | |
| 5% | 90%/90% | 90 | 171 | 34.5% | 99.4% |
| 95%/85% | 95 | 285 | 25% | 99.7% |
a Calculations are based on 2000 individuals being screened with disease prevalence of 10% and 5%.
b Calculations are based on equations shown in Table 33.3 . Estimates of the true positives and false positives can be extrapolated for larger populations by multiplying the numbers in these columns by (number in population/2000).

Doppler ultrasound in carotid endarterectomy trials of asymptomatic patients
Diagnostic performance
Multicenter trials have used Doppler velocity measurements to identify asymptomatic individuals with significant carotid artery stenosis, for example ≥60% diameter narrowing in the Asymptomatic Carotid Atherosclerosis Study (ACAS) or ≥75% stenosis in the European Asymptomatic Carotid Surgery Trial (ACST). The ACAS investigators used carotid Doppler ultrasound as a screening test but with the intent of ensuring that almost all individuals who went on to carotid arteriography and surgery would have a lesion of at least 60% in their carotid artery. For this reason, the selected Doppler velocity threshold was set to a high enough value so that 95% of selected individuals would have a lesion causing a diameter narrowing of 60% or more (i.e., a high velocity threshold with few false positives) (see Fig. 33.4 as an example). This approach yielded a high positive predictive value and also resulted in a low negative predictive value. In essence, many individuals who probably had a carotid artery stenosis above 60% were missed (see Fig. 33.4 ), but 92% of individuals who underwent arteriography had a ≥60% internal carotid artery stenosis.
The ACAS Trial gives insights into the use of carotid Doppler ultrasound as a screening tool. On the technical side, lessons to be learned from this study are the need for adherence to a quality control process, adherence to strict protocols, and selection of an appropriate ultrasound device.
Although the overall sensitivity of carotid Doppler ultrasound could not be measured in ACAS, the overall specificity of carotid ultrasound was above 97%. Carotid ultrasound was, however, used according to a very strict protocol. Qualifying centers needed to show a strong correlation between Doppler measurements and the results of carotid arteriography. Marked variations between centers and outlier centers with poor accuracy of carotid Doppler improved with new ultrasound equipment and a standardized imaging protocol. The success of carotid ultrasound in ACAS was based on the use of a standard imaging protocol, a certification program for both sonographers and vascular laboratories, and the implementation of a quality assurance program supervised by a central coordinating center.
Effect of ultrasound devices
Differences in imaging devices or imaging protocols probably affected the diagnostic performance of Doppler ultrasound in ACAS and are therefore likely to affect any screening process that looks at detecting significant carotid artery stenosis in the general and high-risk populations. The variability of carotid Doppler ultrasound is measurable at the level of individual laboratories and for different imaging devices. These observations confirmed the observations made by ACAS. Despite this variability, carotid Doppler ultrasound can still perform well as a screening tool. The European ACST used locally derived parameters to define percent stenosis by carotid ultrasound and achieved very similar outcome results to those of the ACAS study.
Defining thresholds
The effectiveness of carotid artery screening is dependent on the accuracy of Doppler velocities to estimate the degree of carotid artery stenosis. Doppler velocities are compared with stenosis severity as measured on arteriograms, the gold standard. Because carotid Doppler ultrasound has a sensitivity and specificity of less than 100%, there will always be false positives and false negatives (see Fig. 33.3 ). A falsely elevated Doppler velocity measurement leads to extra costs and increases patient risk when individuals without disease go on to further testing (false positives). Conversely, individuals with disease can be missed because of falsely low Doppler velocity readings and excluded from the benefits of an intervention (false negative).
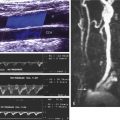
Currently, Doppler ultrasound detects the presence of significant carotid disease by comparing a measured velocity parameter with a threshold value, typically the peak systolic velocity. On the basis of ACAS and a consensus recommendation, the internal carotid artery peak systolic velocity is the most reliable of the Doppler velocity parameters ( Fig. 33.5 ). A strategy that relies on the power Doppler image can help triage patients, but this adds an intermediate step and is therefore not likely to be cost-effective. A peak systolic velocity value of 125 cm/s should suffice for detecting a 50% diameter carotid artery stenosis. Detection of a 70% carotid artery stenosis can be achieved using a value of 230 cm/s, although this value may show greater interlaboratory variability. A value of 260 cm/s has been reported for ≥60% stenosis but is higher than that reported for lesions causing ≥70% stenosis (230 cm/s). Of the two, the lower threshold of 230 cm/s seems more suitable because it has high sensitivity and therefore fewer individuals with disease are likely to be missed (see Fig. 33.4 ).

An overview of effectiveness
The effectiveness of a screening process for detecting significant carotid artery stenosis is to decrease the risk of stroke. This is heavily dependent on knowing the degree of stenosis above which a surgical or endovascular intervention is beneficial. ACAS results show a benefit of carotid endarterectomy for stenosis of 60% or greater as a relative risk reduction of 55%. This, however, translates to an absolute risk reduction, at 5 years, of 5.9% or slightly more than one morbidity event for slightly fewer than 100 operated patients each year. Data from a European study also show an absolute risk reduction of 5.3% over 5 years. Based on the data from these studies, 94 to 98 asymptomatic patients with significant (>60% diameter reduction) stenosis need to have carotid endarterectomy performed in order to prevent one stroke. The fact that a large number of patients need to be imaged shows that the yield of the screening process is very low, and once a patient is identified, a large number need to undergo surgery in order to prevent one stroke. The yield of positive examinations and the benefit of the intervention need to be factored into an evaluation of the value of the screening process.
Answers to some of these issues can be derived from epidemiologic studies where carotid ultrasound has been used to estimate the prevalence of carotid stenosis. In the CHS, a multicenter study of 5888 individuals aged 65 years or more, carotid Doppler velocity measurements were used to measure the severity of carotid artery disease. The prevalence of lesions causing velocities above 150 cm/s is low at 5.5% and closer to 8% for peak systolic velocities above 125 cm/s (see Fig. 33.2 ). The proportion of individuals in the general population who are likely to have a Doppler velocity above a given peak systolic velocity (x-axis) is very small ( Fig. 33.6 ). Using data from CHS and assuming that individuals with Doppler velocities above 250 cm/s warrant an intervention, 1030 of 100,000 individuals aged 65 years or more presenting for screening each year would be candidates for endarterectomy. On the basis of ACAS/ACST, approximately 10.8 strokes would be prevented if the 1030 underwent the intervention. The cost of 100,000 carotid ultrasounds has to be added to the cost of 1030 endarterectomies to give a rough appreciation of the efficacy of using Doppler ultrasound to screen for asymptomatic individuals. Even if we estimate $100 for the Doppler examination and $2000 for the surgery, the saved strokes cost $12,060,000. The net cost for saving one stroke each year is $1,117,000. This does not take into account the cost of investigating false positive Doppler ultrasound studies.

This simple cost-effectiveness exercise shows the high cost and relatively low yield of screening for significant asymptomatic carotid artery stenosis. This evaluation in part explains why the United States Preventative Services Task Forces’ (USPSTF) guidelines do not recommend that carotid artery screening with ultrasound be performed on asymptomatic individuals. A converse argument has been made to screen asymptomatic individuals with specific risk factors that increase the yield of carotid ultrasound.
Surveillance
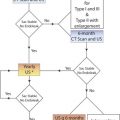
There are few observational data on which to base recommendations for monitoring patients with less than 60% carotid artery stenosis. A Doppler value between 175 and 260 cm/s seems to identify a subset of patients with higher risk of stenosis progression. There are few data available to identify individuals with lesser degrees of stenosis that might be at risk for stenosis progression. An interesting clinical question is whether or not a clinical protocol should grade the extent of plaque as either present or absent or into finer subjective groupings. If all plaques that are not hemodynamically significant, with velocities <125 cm/s, are lumped together, surveillance is hard to justify given the large number of individuals with small plaques. If plaques are graded in categories such as 1% to 24% and 25% to 49% or 1% to 15% and 16% to 49%, the subset of larger plaques could be subject to selective surveillance. This assumes that larger plaques are more likely to make the transition to hemodynamic significant stenosis than smaller plaques, which is an early hypothesis that has been poorly studied.
Extent of the examination
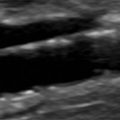
Performance of the carotid ultrasound examination as a screening test should mimic as closely as possible a diagnostic ultrasound examination of the carotid arteries. On the basis of epidemiologic studies, the minimum would include a peak systolic velocity at the point of aliasing on a color Doppler image of the internal carotid artery and good gray-scale images confirming the presence of a plaque.
Summary
In itself, screening for asymptomatic carotid artery stenosis might have some benefit to the individual, but it is not a cost-effective process ( Table 33.5 ).
Related posts:


Stay updated, free articles. Join our Telegram channel

Full access? Get Clinical Tree


