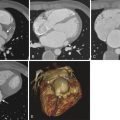
Shortly after the development of computed tomography (CT) in the early 1970s, great interest was expressed in applying this technology to imaging of the heart. In fact, less than a decade after Sir Godfrey Hounsfield developed the first CT scanner, he speculated about the future potential of his creation to be used as a tool for imaging the heart by synchronizing image acquisition with the diastolic phase of an electrocardiogram (ECG) tracing. In the late 1970s and early 1980s, some investigators were able to demonstrate the utility of both nongated and ECG-gated CT scans for evaluation of cardiac structure, myocardial perfusion, myocardial infarction, intracardiac masses, bypass graft patency, and pericardial diseases. However, the poor temporal and spatial resolution of early CT scanners was a major limiting factor that prevented routine use of CT in evaluation of cardiac disease. With the advent of electron beam CT (EBCT) in the 1980s, the potential clinical use of CT technology for assessment of cardiac disease was once again demonstrated for coronary calcium scoring, although the high cost of EBCT scanners and their limited utility for other imaging prevented their widespread use. Ultimately, in the early 1990s, a combination of slip-ring gantry technology and multidetector arrays led to the development of the first multidetector CT (MDCT) scanners capable of helical scanning at subsecond gantry rotation speeds.
When the first four-channel MDCT scanners were produced in 1998, a new era of cardiac imaging dawned, as many investigators employed ECG gating, rapid infusion of iodinated contrast material, and this new MDCT technology to perform the first cardiac computed tomography angiography (CTA) examinations. However, it was not until the development and widespread use of 64-channel MDCT scanners that clinical application of cardiac CTA became routine. Since that time, scanner manufacturers have diverged in their pursuit of the optimal cardiac CT scanner. Contemporary scanners offer a wide range of options that may include the following: large detector arrays that provide enough z-axis coverage to encompass the entire heart at one time; rapidly spinning gantries sometimes with multiple x-ray sources and detector arrays to improve temporal resolution; thinner detector elements and rapid focal spot modulation to improve spatial resolution in x-, y-, and z-axes; dual energy scanning capabilities that may reduce artifacts from calcium and offer promise of potential tissue characterization; and an ever increasing variety of iterative reconstruction algorithms to reduce image noise, improve image quality, and allow for substantial radiation dose reduction. Given the fast pace of advances in computer and CT technology, future applications of cardiac CTA seem limited only by imagination and ingenuity.
Key Challenges in Effective Valve Imaging with Cardiac Computed Tomography Angiography
At present, direct assessment of blood flow or other hemodynamic information in a cardiac CTA examination is not possible. When compared with echocardiography and cardiac magnetic resonance imaging (MRI), the temporal resolution of cardiac CTA is substantially lower, particularly with a single source scanner. Cardiac CTA requires relatively low and regular heart rates and is therefore of limited value in patients with tachycardia or arrhythmias. Valve imaging with cardiac CTA also requires intravenous administration of iodinated contrast material, which carries some inherent risks to individuals with renal insufficiency, as well as a low risk of contrast reaction. Additionally, although significant progress has been made in reducing radiation exposure associated with cardiac CTA examinations by utilizing prospective triggering, high-pitch helical technique, advanced iterative reconstruction algorithms, limiting z-axis coverage, and customizing tube voltage (expressed in kilovolts [kV]) and tube current (expressed in milliamperes [mA]) settings for individual patients based on body mass index (BMI), retrospectively gated multiphase cardiac CTA examinations continue to result in relatively high radiation exposures to patients even with contemporary scanners. Because of these limitations, one could assume that cardiac CTA would have little value in the assessment of valvular function. However, cardiac CTA has several advantages that can be exploited to make it a useful alternative for valvular imaging when other first-line imaging modalities yield incomplete or conflicting results. In addition to being noninvasive, rapid, readily available, and easily tolerable, cardiac CTA has several fundamental strengths. These strengths include excellent spatial resolution (now as low as 0.3-mm isotropic voxel resolution), accurate depiction of calcification (which can be difficult to identify on cardiac MRI and can cause extensive artifacts on echocardiography), and the generation of true three-dimensional (3-D) or four-dimensional (4-D) data sets that allow thorough interactive assessment by the interpreting physician after the scan has been completed. As a result of these strengths, cardiac CTA offers an exceptional anatomic assessment of the structure and function of cardiac valves. In the setting of valvular dysfunction, this anatomic information derived from cardiac CTA can often accurately predict the hemodynamic effects of valvular lesions on blood flow. Therefore, optimizing scan protocols, injection protocols, and image postprocessing techniques is critically important, to ensure that accurate anatomic assessment of valves is achieved with each cardiac CTA examination.
Adjusting Scan and Injection Protocols to Ensure Optimal Image Acquisition
In general terms, optimization of cardiac CTA protocols for imaging heart valves is similar to optimization for evaluation of the coronary arteries. High temporal, spatial, and contrast resolution and low image noise are all of critical importance. However, heart valves are even more highly mobile and dynamic structures than are coronary arteries, and valves may be dysfunctional during systole, diastole, or both. Therefore, if a full functional assessment of a particular valve is desired, the heart must be imaged throughout the entire cardiac cycle (i.e., retrospective gating must be used while imaging through both systole and diastole). Additionally, when optimal visualization of the valve during systole is required, ECG-based tube current modulation is not recommended because the drop in tube current during systole results in increased image noise (so-called quantum mottle) and decreases diagnostic accuracy. Because of these requirements, cardiac CTA protocols to image the heart valves tend to result in higher radiation exposure to patients, given that the only means to reduce dose effectively are limited to BMI-based protocol modifications of kilovoltage and milliamperage. Newer scanners employing iterative reconstruction algorithms may further facilitate the acquisition of images at lower kilovoltage and milliamperage for any given BMI range. Because this technology is likely to continue to improve in the future, the use of cardiac CTA imaging for assessment of myocardial and valvular function should become more acceptable in terms of radiation exposure to patients.
Depending on the valve of interest, both bolus length and bolus timing must be adjusted to ensure optimal and uniform opacification of the blood pool surrounding the valve. Complete and uniform opacification of the blood pool with iodinated contrast material ensures the best delineation of delicate valvular structures, whereas poorly or heterogeneously opacified blood can blur discrimination of valvular structures from the adjacent blood pool. Because specifics of bolus length and timing vary extensively from one cardiac CTA laboratory to another, detailed instructions are not practical. However, the following suggestions may help to optimize visualization of the heart valves with cardiac CTA:
- ▪
For imaging the aortic valve, typical bolus length and image acquisition timing used for the coronary arteries are usually sufficient. However, if the patient has known severe aortic regurgitation (AR), elongation of the typical bolus and delay of image acquisition by 2 to 4 seconds will help to ensure optimal opacification of the blood pool around the aortic valve. In the setting of AR, mixing of blood that occurs at the level of the left ventricular outflow tract (LVOT) results in a delay to peak attenuation and thus necessitates this longer bolus and increased delay.
- ▪
For imaging the mitral valve, typical bolus length and image acquisition timing used for the coronary arteries are also usually sufficient. However, if the patient has known AR or mitral regurgitation (MR), elongation of the typical bolus and delay of image acquisition by 2 to 4 seconds may allow sufficient time for complete opacification of the blood pool within both the left ventricle and left atrium surrounding the mitral valve.
- ▪
For imaging the pulmonic valve, elongation of the typical bolus by 4 to 6 seconds without any change in image acquisition usually ensures optimal opacification of the blood pool surrounding the pulmonic valve while still allowing excellent evaluation of the coronary arteries.
- ▪
Because of the rapid inflow of unopacified blood from the inferior vena cava that which mixes violently with the opacified blood from the superior vena cava, to expect uniform opacification of blood in the region of the tricuspid valve is not reasonable. Therefore, consistent and accurate assessment of the tricuspid valve by cardiac CT is not always feasible.
Optimizing Image Postprocessing for Analysis
High temporal resolution is important for accurate valve imaging. Although the fundamental temporal resolution of a CT scanner cannot be significantly altered by the user (with the exception of selection of single segment versus multisegment reconstruction algorithms), the reconstruction window can be varied to allow for greater segmentation of valvular motion throughout the cardiac cycle. For most modern single source CT scanners, temporal resolution is roughly between 150 and 220 msec when a single segment reconstruction algorithm is used. For dual source CT (DSCT) scanners and single source CT scanners using a multisegment reconstruction algorithm, temporal resolution is lower than 100 msec. Although reconstructing 10 sets of images throughout the cardiac cycle (e.g., 10% increments from 5% to 95% of the R-R interval) has become routine, by reconstructing a greater number of phases throughout the cardiac cycle, a finer discrimination of valvular motion can be achieved. For example, assume a heart rate of 60 beats/minute during image acquisition. By reconstructing 10 phases, the relative temporal resolution in the image data set is 100 msec per phase (60 beats/minute = 1000 msec/beat; 1000 msec ÷ 10 phases = 100 msec/phase). If instead this same data set is taken and 25 phases are reconstructed, the relative temporal resolution is 40 msec/phase (1000 msec ÷ 25 phases = 40 msec/phase). Although the fundamental temporal resolution of the scan has not been altered, the way in which the reconstructed image data are presented has been changed, and a finer gradation of valvular motion can be analyzed. Several studies have demonstrated improved accuracy in assessment of both ventricular and valvular function by using a greater number of reconstructed phases.
Accurate assessment of valvular structure and function can also be augmented by the use of 4-D volume-rendered images. In particular, volume rendering techniques that are optimized to display the soft tissue structures of the heart but not display the contrast opacified blood in the chambers of the heart are extremely useful in assessment of valvular disease. This blood pool inversion (BPI) volume rendering technique can be performed on various different postprocessing systems and capitalizes on the ability of each system to designate a color (or color spectrum) and a percentage of opacity to a range of attenuation values by setting user-defined values called opacity transfer functions (OTFs). By defining OTFs to display low-attenuation soft tissue structures (40 to 150 Hounsfield units [HU]), and very-high-attenuation calcifications (often >700 HU), but not display the intermediate- to high-attenuation blood pool (often 300 to 600 HU), the user renders the blood pool completely transparent. Thick-slab 4-D BPI volumetric reconstructions can then be generated in an infinite number of potential imaging planes and perspectives to assess not only valvular anatomy and function but also other internal structures of the heart.
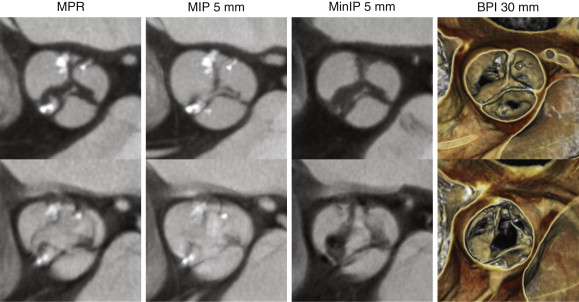
A thorough and systematic review of each valve requires a combined assessment that may involve the use of standard multiplanar reformation (MPR), minimal intensity projection (MinIP), and BPI volume-rendered images. Each of these techniques has strengths and weaknesses in assessment of valvular anatomy and function, as demonstrated in Figure 36-1 . For viewing each of the valves in the plane of the valve (i.e., in a plane perpendicular to the direction of blood flow), use of a thick-slab BPI volume-rendered technique offers a more comprehensive assessment of valvular structure and function than traditional techniques (also see Figs. 36-2 and 36-6 ). However, the BPI volume rendering technique does have significant limitations in some cases (discussed later) and generally offers no advantage over traditional MPR techniques for viewing valves in plane with blood flow (e.g., from a three-chamber perspective in assessment of the aortic or mitral valves), because the overlapping structures in a thick-slab BPI volume-rendered image may obscure subtle pathologic features. Under most circumstances, maximal intensity projection (MIP) images offer no advantages in assessment of cardiac valves because the thin valve cusps and leaflets are commonly obscured by the adjacent high-attenuation blood pool, particularly in thicker-slab MIPs.
Practical Approaches for Imaging Each of the Heart Valves
Aortic Valve
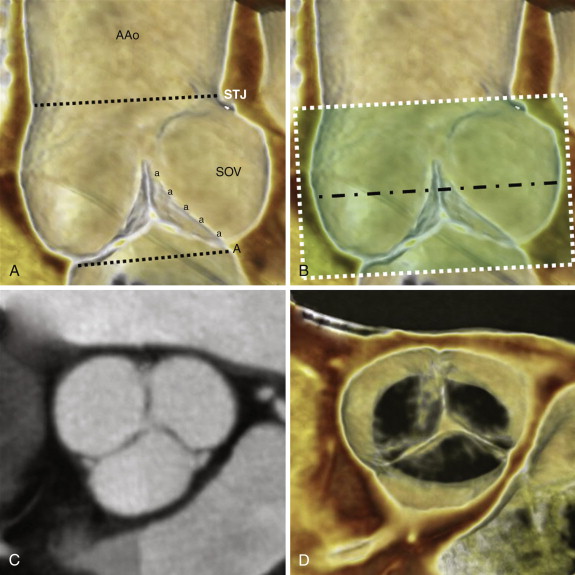
By strict anatomic definition, the aortic root has three main components: the annulus, the cusps of the aortic valve, and the sinuses of Valsalva. Although commonly conceived as a planar structure, the anatomic annulus of the aortic valve is a complex 3-D structure that is coronet shaped (i.e., crown shaped), in which each of the semilunar cusps attaches to the wall of the root ( Fig. 36-2 ). The inferior border of the aortic root is at the basal attachments of the annulus of the valve. Because replacement of the valve or root necessitates complete removal of the native valve, the surgical annulus is typically considered to be at the inferior border of the aortic root just below the most inferior attachment of each cusp. The obtuse angle where the superior margins of the sinuses of Valsalva meet the ascending aorta constitutes the superior border of the aortic root and is called the sinotubular junction. The normal aortic valve comprises three semilunar cusps. The junctions between adjacent cusps are referred to as commissures, and the normal aortic valve has three commissures. A normally functioning aortic valve should have thin, pliable, noncalcified cusps that open well (>2 cm 2 ) during systole and close completely during diastole.
Because cardiac CTA acquires complete 3-D or 4-D data sets, the aortic valve can be interrogated in various imaging planes to assess for anatomy and function. Routine imaging planes typically include those in plane with the valve, as well as one or two perpendicular to the plane of the valve, typically either three-chamber or LVOT planes. However, in the setting of valvular dysfunction, additional obliquities may be necessary to assess the severity of valvular dysfunction accurately (see the later discussion of AR and Fig. 36-6 ).
Aortic Stenosis
Although aortic stenosis (AS) has various causes, it is most commonly the result of degenerative aortic sclerosis: progressive thickening and calcification of the valve. The process of aortic sclerosis is very similar to that of atherosclerosis in that it involves inflammation, lipid deposition, and calcification within the valve cusps. Actually, this “calcification” of the cusps is metabolically active bone-forming tissue. Less commonly, rheumatic heart disease can cause AS, typically associated with scarring and fusion of the commissures, as well as significant retraction of the free edges of each cusp that results in concurrent regurgitation. Least commonly, congenital AS can be seen in children with bicuspid aortic valves (BAVs) or unicuspid aortic valves.
On gated noncontrast CT examinations used for calcium scoring of the coronary arteries, calcium scores of the aortic valve can also be assessed. Studies have shown a general trend that increasing aortic valve calcium scores (either by Agatston score, volume score, or mass score) correlate with increased severity of AS and have indicated reasonable accuracy in discriminating patients with severe stenosis from those with only mild or moderate stenosis. However, other studies have shown this relationship to be highly variable and have suggested that because of this variability, the clinical utility of this calcium scoring of the aortic valve is questionable, and additional correlative imaging will always be required to quantify the severity of stenosis more accurately.
Superior spatial resolution of cardiac CTA allows for excellent anatomic depiction of the aortic valve orifice during systole, even in the presence of significant calcification. Serial review of the aortic valve during systolic phases can be used to identify the reconstructed phase in which the aortic orifice is at its largest, and maximal aortic valve area (AVA) can then be measured during peak systole with planimetry ( Fig. 36-3 ) to determine the presence and severity of AS ( Table 36-1 ). However, planimetry, by its very nature, is a measurement of a two-dimensional area, when in reality the aortic valve orifice is a complex 3-D structure. Therefore, the examiner must thoroughly evaluate aortic valve anatomy to understand the optimal position for measurement of AVA. In the setting of only mild AS, the optimal level to perform planimetry is typically at the free edge of the aortic valve cusps in a plane that is orthogonal to the direction of blood flow. However, in the setting of severe or critical AS, the patient may have partial or complete fusion of cusps that may necessitate measurement at a lower level, or in a slightly oblique plane, to measure the true anatomic orifice area more accurately. In addition, even when the anatomic AVA is measured accurately with planimetry, the functional AVA (estimated by echocardiography) may be different because the functional AVA reflects blood flow through this complex 3-D orifice throughout systole and indicates not only the cross-sectional area but also the complex flow dynamics through this orifice.
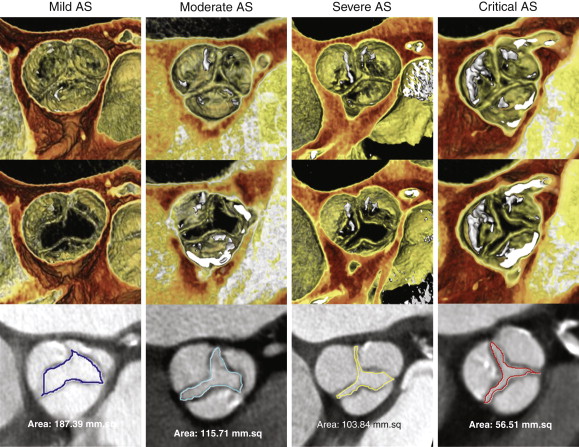
| Mild | Moderate | Severe | Critical | |
|---|---|---|---|---|
| Valve area | >1.5 cm 2 | 1.0-1.5 cm 2 | <1.0 cm 2 | <0.7 cm 2 |
| Mean gradient | <25 mm Hg | 25-40 mm Hg | >40 mm Hg | — |
| Jet velocity | <3.0 m/sec | 3.0-4.0 m/sec | >4.0 m/sec | — |
Pearls and Pitfalls: Assessment of Low-Gradient Aortic Stenosis
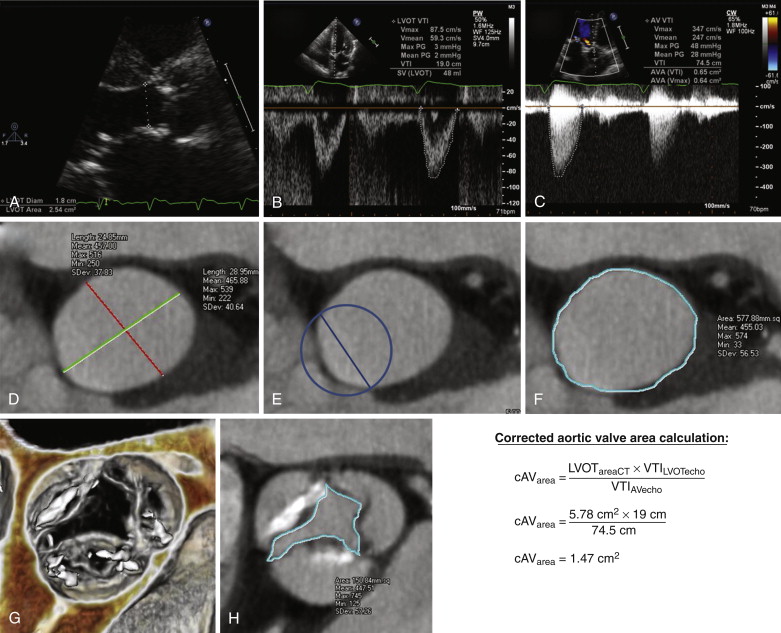
Although many patients with so-called low-gradient AS have reduced resting left ventricular systolic function that results in low mean transvalvular gradients that tend to underestimate the severity of underlying aortic valve stenosis, a subset of individuals has normal resting left ventricular systolic function and low mean transvalvular gradient but calculated AVA (by use of the continuity equation) indicative of severe or critical AS. The conflicting low mean transvalvular gradient and small calculated AVA can be a diagnostic challenge. Studies with 3-D transesophageal echocardiography (TEE), cardiac MRI, and cardiac CTA have all demonstrated that the cause of this apparent discrepancy often is an elliptic cross-sectional geometry through the LVOT. For routine application of the continuity equation in echocardiography, the LVOT is assumed to be a tubular structure with a circular cross section.
On routine transthoracic echocardiography (TTE), the LVOT diameter is measured on the parasternal long-axis (three-chamber) view, and the cross-sectional area of the LVOT is then calculated using the formula for the area of a circle: πr 2 . In fact, the diameter measured on the parasternal long-axis view is the short axis of the typically elliptic LVOT, such that use of this diameter to calculate a circular cross section usually results in significant underestimation of actual LVOT cross section (because the error of this smaller measurement is squared) and thereby causes significant underestimation of AVA by the continuity equation.
This concept is demonstrated in Figure 36-4 , in which the LVOT area was further underestimated at echocardiography because the sonographer was not centered with respect to the LVOT; this error is common with TTE and is further worsened in the presence of any calcification of the aortic annulus and LVOT. In the example shown in Figure 36-4 , the error resulted in an LVOT measurement that grossly underrepresented the true short-axis diameter of the LVOT ellipse and thereby resulted in a severe underestimation of actual LVOT cross-sectional area when this measurement was used to calculate the area of a circle (see Fig. 36-4 , D to F ). The cross section of the elliptic LVOT in this case was more than twice that of the assumed circular cross section used in the calculation of AVA, thus resulting in misclassification of someone with only mild to moderate AS as someone with near critical stenosis. Because of these types of errors, reporting specific LVOT measurements (long-axis and short-axis diameters, as well as cross-sectional area) during peak systole may be beneficial, given that these measurements can be combined with echocardiographic data to calculate the functional AVA with the continuity equation more accurately (see Fig. 36-4 ).

Stay updated, free articles. Join our Telegram channel

Full access? Get Clinical Tree


