Vascular and Lymphatic Tumors
Angiomatous lesions of the musculoskeletal system are common causes of soft tissue masses, particularly in young patients (1, 2). These lesions, unfortunately, are frequently confused with other neoplastic masses both clinically and radiologically. However, CT and MR imaging frequently demonstrate characteristic features that are pathognomonic and allow confident radiologic diagnosis. This chapter reviews the spectrum of angiomatous lesions of the musculoskeletal system including hemangioma, pleomorphic hyalinizing angiectatic tumor (PHAT) of soft parts, reactive vascular lesions, lymphangioma, angiomatosis, angiomatous syndromes and associations, glomus tumor, hemangioendothelioma, hemangiopericytoma, Kaposi sarcoma, and angiosarcoma. This organization is largely based on the categorization by the World Health Organization’s (WHO) Committee for the Classification of Soft Tissue Tumors (3).
KEY CONCEPTS
Angiomatous lesions can be divided into the following categories:
Hemangioma/Vascular malformation
Other benign and reactive vascular lesions
Lymphangioma
Glomus tumor
Aggressive and malignant vascular tumor: hemangioendothelioma; hemangiopericytoma/solitary fibrous tumor; Kaposi sarcoma; and angiosarcoma.
HEMANGIOMA
Hemangioma is among the most frequent tumors to involve the soft tissues. These vascular lesions comprise 7% of all benign tumors and hemangioma is the most common tumor of infancy and childhood (1, 2, 3, 4, 5). It has been estimated that 1% to 2% of the general population and up to 10% of Caucasians and children under the age of 1 year are affected (6, 7). Newborns are affected in up to 2% of cases, more often in premature infants (8). Clinical evaluation often reveals a painful lesion that intermittently changes in size, and superficial lesions may have characteristic overlying bluish skin discoloration (9). Multiple lesions are seen in up to 20% of patients (5, 6). The pain associated with intramuscular hemangiomas may be vague and only present after exercise. This is presumably caused by relative hypoxia of surrounding muscle as opposed to increased blood flow to the hemangioma. Soft tissue hemangiomas are usually discovered in the first three decades of life, with
30% discovered at birth (2, 3, 4, 5, 6). These lesions are more common in women with an approximate 3:1 ratio (2). Soft tissue hemangiomas may also dramatically increase in size during pregnancy owing to both increased blood volume and engorgement as well as endocrine related stimulation of growth. These lesions may be located superficially or deep, with the latter lesions most frequently intramuscular.
30% discovered at birth (2, 3, 4, 5, 6). These lesions are more common in women with an approximate 3:1 ratio (2). Soft tissue hemangiomas may also dramatically increase in size during pregnancy owing to both increased blood volume and engorgement as well as endocrine related stimulation of growth. These lesions may be located superficially or deep, with the latter lesions most frequently intramuscular.
KEY CONCEPTS
Most common tumor of infancy and childhood comprising 7% of all benign tumors.
Superficial capillary hemangiomas (strawberry nevi) are easily diagnosed clinically, spontaneously involute (75% to 90%), are often not imaged, and have nonspecific radiologic features.
Cavernous hemangiomas have nonspecific clinical features, but identification of serpentine vascular channels/spaces and/or fat overgrowth is pathognomonic by MR imaging and is seen in approximately 90% of deepseated lesions.
Most hemangiomas reveal slow blood flow but high/rapid flow components are important to identify because of treatment implications.
There are many reactive vascular lesions that present as small subcutaneous masses with nonspecific imaging features.
We use and prefer the term hemangioma in its broadest sense, agreeing with Weiss and Goldblum, that these lesions represent a benign nonreactive lesion with an increase in the number of normal- or abnormal-appearing vessels (2). We acknowledge that other classifications, particularly advocated by Mulliken and Glowacki, and the International Society for the Study of Vascular Anomalies (ISSVA) distinguish vascular malformations (blood or lymphatic vessels with normal endothelial cell mitotic activity) and hemangioma (bloods vessels with endothelial hyperplasia) (10, 11, 12).
This original classification by Mulliken and Glowacki was based on the study of 49 cutaneous vascular lesions and did not include any deep-seated lesions. In this study, cutaneous lesions that were identified at birth and had rapid initial growth followed by a slow involution were referred to as hemangiomas. In contradistinction, lesions present at birth, growing commensurately with the child and lacking involution were designated as vascular malformations (12). Pathologically, hemangiomas were considered tumors with histologic hypercellularity in the endothelial cell proliferative phase, fibrosis in the involutional phase, and strong expression of glucose transporter protein 1 (Glut 1). Vascular malformations are characterized by a normal rate of cell tumors or endothelial proliferation. Although this scheme allows successful differentiations of cutaneous lesions in children and infants by history and clinical examination in 96% of cases, it does not include the imaging appearance. In addition, deep-seated vascular lesions, which usually do not present at birth, are not addressed by this classification and are more frequently encountered as diagnostic dilemmas for radiologists. This classification also differs from the descriptions of vascular lesions in other organ systems. Radiologists and pathologists frequently do not have sufficient clinical information to utilize this classification system, as shown in 83% of the surgical specimen in a recent study (13). Finally, exceptions such as the “non-involuting congenital hemangioma (NICH)” have now been described further confusing this classification scheme. The more all-inclusive term hemangiomas for these lesions accounts for the fact that no matter which classification system is used pathologically, all of these lesions can be subclassified by the predominant type of vascular channel (capillary, cavernous, arteriovenous, or venous) identified within the lesion (2). It is also this morphology that is depicted on imaging for radiologic assessment. There is frequently an admixture of histologic components within hemangiomas and in some lesions, subclassification is not possible. Nonvascular elements are also commonly present in hemangiomas including fat, smooth muscle, fibrous tissue, bone, hemosiderin, and thrombus. Identification of fat is particularly common in hemangiomas (cavernous lesions most frequently) and deserves specific comment. In almost all cases overgrowth of adipose tissue should be considered a reactive phenomenon rather than a true neoplastic component (see discussion of angiolipoma) (14, 15, 16, 17, 18).
Capillary Hemangioma/Vascular Malformation
These lesions are composed of small vessels lined by a flattened endothelium. Capillary hemangiomas have been divided into juvenile, tufted, verrucous, and senile subtypes. Pyogenic granuloma is also a type of capillary hemangioma. These hemangiomas typically involve the skin and subcutaneous tissue and are discovered in the first years of life. The juvenile variety is particularly common, occurring in 1 to 2 of every 100 to 200 births and is multiple in 20% of cases (2, 6, 19). Juvenile capillary hemangiomas have also been referred to as strawberry nevus, infantile hemangioendothelioma, and cellular hemangioma of infancy (20). Clinically, juvenile hemangiomas usually present several weeks after birth and enlarge, at times rapidly, for the ensuing several months, reaching the maximal size by 6 to 12 months of age (20). Lesions initially appear as a flat reddish macule that is similar to a birthmark but intensifies its color with crying or straining. The WHO classification of cutaneous vascular lesions is complex with 10 benign subtypes, including acquired tufted angioma (older patients; acquired, erythematous macules involving the upper extremity dermis with slow growth), hobnail hemangioma (young adults; extremities revealing a pigmented or exophytic mass), verrucous hemangioma (overlying reactive hyperkeratosis seen in childhood; recur locally and develop satellite lesions if not fully resected), glomeruloid hemangioma (older adults often associated with polyneuropathy, organomegaly, endocrinopathy, monoclonal gammopathy, and skin changes (POEMS) syndrome), microvenular hemangioma (young to middle aged adults; small reddish nodule, particularly of the forearms and extremities), and cherry angioma (also referred to as senile angioma and affects almost all adults eventually with red papules on thumb or upper limb girdle and increases in number with age). The vast majority of juvenile hemangiomas (75% to 90%) spontaneously involute by age 7 years (21). Although capillary hemangiomas are overall the most common type of angiomatous lesion, radiologic evaluation is infrequent because of the superficial location and diagnostic appearance clinically and nonsurgical treatment with spontaneous resolution in the vast majority of lesions. Capillary hemangiomas involving the deep soft tissues have a predilection to affect the head and neck region (particularly the mid-cheek, upper lip, and upper eyelid) (Fig. 5.1).
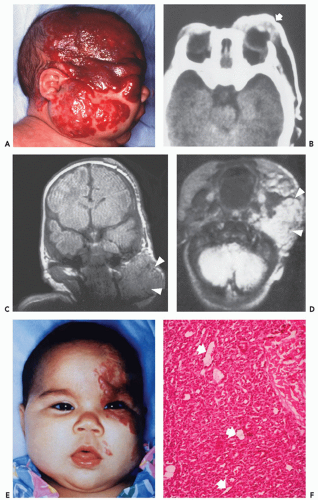 FIGURE 5.1 Juvenile capillary hemangioma (strawberry nevus) in a 2-month-old girl. A: Clinical photograph shows extensive involvement of the face and orbit. B: Axial noncontrast CT scan shows infiltration of skin and orbit (open arrow). Coronal T1-weighted (500/20)(C) and axial T2-weighted (2,000/80) (D) SE MR images inferior to B reveal similar findings with a mass infiltrating the subcutaneous and deeper soft tissues. The lesion (arrowheads) shows a nonspecific intermediate signal intensity on T1-weighting (C) and high signal intensity on T2-weighting (D) without characteristic serpentine structures or fat overgrowth. E: Involution of the hemangioma is depicted by the clinical photograph at 22 months of age with the eye now open and functioning. F: Photomicrograph shows a very cellular lesion with vascular spaces (arrows) too small to be discerned by imaging. |
Cavernous Hemangioma/Vascular Malformation
Cavernous hemangiomas are pathologically composed of dilated spaces filled with blood and lined by flattened endothelium. In our experience, these lesions are often mistaken as venous lesions because of thickened adventitial fibrosis interpreted as a muscular wall. Cavernous hemangiomas most frequently affect young children or adults and present clinically as a nonspecific deep intramuscular mass. Overlying skin discoloration is not apparent in deeply seated lesions. In unusual cases located superficially, lesions may reveal bluish skin discoloration. Sinusoidal hemangioma is a distinct variety of a cavernous lesion in which the large vascular spaces ramify extensively with one another. These lesions often present as a solitary purplish well-defined nodule on the trunk (or breast) and are more common in women. Unlike capillary hemangiomas, cavernous lesions do not involute, are often less well circumscribed, and frequently require surgical resection (22). For these reasons, although cavernous hemangiomas are less common than the capillary variety, they are more frequently imaged by radiologists (Figs. 5.2, 5.3, 5.4, 5.5, 5.6, 5.7, 5.8). Cavernous hemangiomas commonly
calcify, typically containing dystrophic mineralization in organizing thrombus (phlebolith).
calcify, typically containing dystrophic mineralization in organizing thrombus (phlebolith).
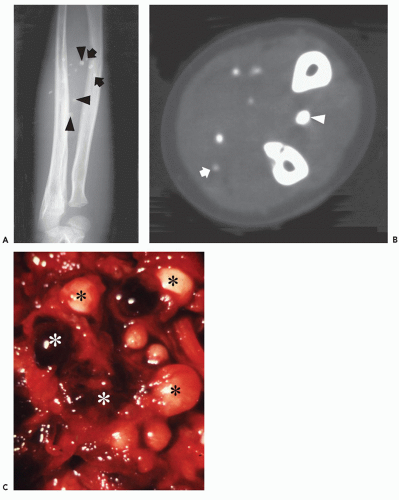 FIGURE 5.2 Cavernous hemangioma of the forearm in an 8-year-old boy. A: Radiograph shows multiple calcifications. Several calcifications have the classic appearance of phlebolith (arrowheads), while others are more nonspecific (arrows). B: Axial noncontrast CT displayed at bone windows also shows the calcifications. C: Intraoperative photograph from a different patient shows vascular spaces (white asterisk) and phleboliths (black asterisk). |
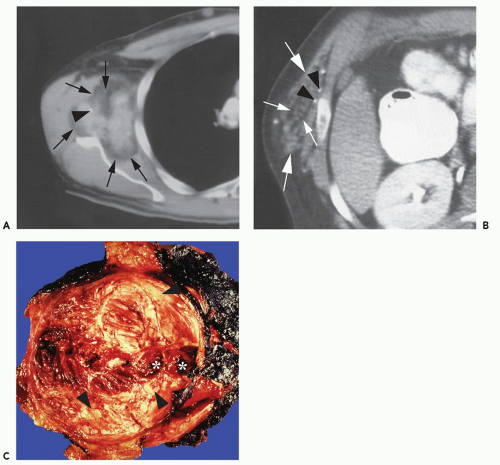 FIGURE 5.3 Cavernous hemangiomas of the chest wall in two middle-aged patients. Axial CT of the chest (A) and abdominal wall (B) reveal mass (large arrows, not seen on radiographs, not shown), and fat overgrowth (small arrows). Phleboliths are also seen (arrowheads). C: Photograph of gross specimen shows large cavernous vascular spaces (asterisks) and areas of fat overgrowth peripherally (arrowhead). |
Arteriovenous Hemangioma/Malformation
These lesions are composed of abnormal communication of arteries and veins and pathologically can be considered as a persistence of the fetal capillary bed (1, 2, 23). Arteriovenous hemangiomas occur in the soft tissues of young patients in two forms: superficial lesions (cirsoid aneurysm or acral arteriovenous tumor) without arteriovenous shunting (clinically insignificant) and deep lesions with arteriovenous shunting (clinically symptomatic). Superficial arteriovenous hemangiomas commonly affect the head and neck (particularly the oral and lip region) and present as a painful red-blue papule. Deep-seated lesions typically occur in the extremities, head, and neck of children to young adults. High blood flow is characteristic of these lesions, although occasionally stenosis and thrombosis can cause reduced flow (Figs. 5.9 and 5.10). Clinical abnormalities associated with high-flow lesions are a result of the vascular shunt and include enlarged extremity, venous distention, bruit, increased overlying skin temperature, and reflex bradycardia after compression (Branham sign) (2). As previously discussed, many investigators would describe these lesions as arteriovenous malformations (AVMs) (2, 12). In addition, these lesions are not histologically distinct and are frequently associated with other areas composed of capillary and/or cavernous hemangioma.
Venous Hemangioma/Malformation
These lesions are composed of vessels with thick muscular walls and are relatively unusual in the musculoskeletal system. In our experience, cavernous lesions are frequently misinterpreted as venous lesions owing to the fibrous wall thickening mistaken for a muscular wall. Venous hemangiomas usually occur in adults and involve the deep soft tissues including the retroperitoneum, mesentery, and extremity musculature (Figs. 5.11 and 5.12). Slow blood flow typifies these lesions and phleboliths may also be present. Dystrophic calcification may also
occur in these lesions. These lesions have also been associated with Turner syndrome, particularly in lesions of the foot (8, 24).
occur in these lesions. These lesions have also been associated with Turner syndrome, particularly in lesions of the foot (8, 24).
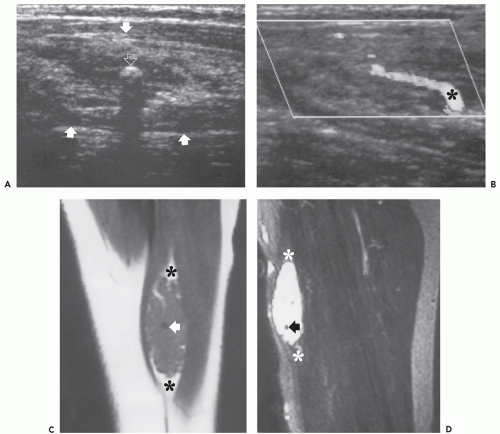 FIGURE 5.4 Intramuscular cavernous hemangioma in a 43-year-old woman. A: Longitudinal image from sonogram reveals a complex mass (arrows). Echogenic focus with posterior acoustic shadowing (open arrow) represents a phlebolith. B: Doppler study demonstrates prominent vascular elements (asterisk). Coronal T1-weighted (500/20) (C) and turbo T2-weighted (3,600/102) (D) spin-echo MR images reveal a heterogeneous mass that shows areas of high intensity on the long TR image. Phleboliths (arrow, low signal intensity all pulse sequences) and peripheral fat overgrowth (asterisks) are also present. |
Spindle Cell Hemangioma
This lesion was first described by Weiss and Enzinger in 1986 as spindle cell hemangioendothelioma and typically affects the subcutaneous tissues of the distal extremities (particularly the hands and feet, 59% of cases) in young adults with a female predilection (25). Histologically, this benign tumor is composed of cavernous spaces and spindled areas (similar to that seen in Kaposi sarcoma). Treatment is often delayed for a long period, owing to limited initial symptoms. Although most spindle cell hemangiomas begin as a solitary nodule, multiple satellite lesions are frequent. Intravascular growth is seen in approximately 50% of cases and may be responsible for the multifocal lesions and local recurrence in about 60% of cases (26). These lesions may also be associated with Maffucci syndrome and Klippel-Trenaunay syndrome.
Imaging of Soft Tissue Hemangioma
The vast majority of soft tissue hemangiomas evaluated radiologically are more deeply seated lesions, most frequently intramuscular in location. Radiographs are often normal or reveal only a nonspecific soft tissue mass. Identification of characteristic calcification in the form of phleboliths is most frequent in cavernous hemangiomas, seen in 20% to 67% of cases (see Fig. 5.2), but may also be seen in other angiomatous lesions (1, 12, 27, 28). Nonspecific calcification may also occur in hemangiomas appearing curvilinear or amorphous (see Fig. 5.2). Associated osseous abnormalities have been described in 37% of soft tissue hemangiomas on radiographs (28). These bone manifestations include periosteal reaction (23%), cortical abnormality (31%), and medullary abnormality (29%) (28) (see Figs. 5.5 and 5.12). These osseous manifestations are best evaluated on radiographs and are typically associated with lesions juxtaposed to bone. Periosteal reaction is usually nonaggressive but is rarely spiculated (28). Cortical changes include thickening, erosion, channel-like lucencies (tunneling), and osteopenia (28). Medullary abnormalities include osteopenia, sclerosis, marrow replacement on MR, and
rarely serpentine channel-like radiolucencies (28). In addition, chronic hyperemia resulting from vascular lesions can lead to bone overgrowth similar to that seen in juvenile idiopathic arthritis.
rarely serpentine channel-like radiolucencies (28). In addition, chronic hyperemia resulting from vascular lesions can lead to bone overgrowth similar to that seen in juvenile idiopathic arthritis.
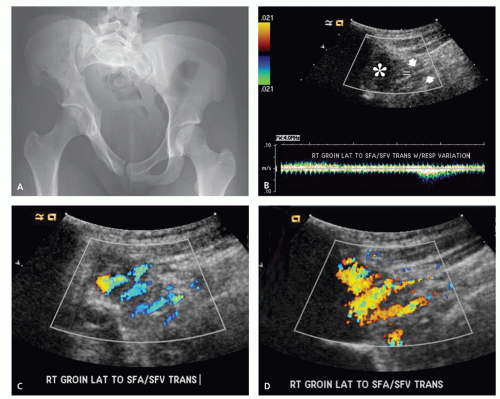 FIGURE 5.5 A: Frontal radiograph demonstrates pelvic asymmetry with osseous atrophy of the right hemipelvis. B: Transverse Spectral Doppler sonographic image obtained at the level of the right groin, lateral to the femoral artery and vein, demonstrates a hypoechoic mass (white asterisk) comprised of low velocity vessels (arrows) that correspond to the mixed arterial and venous spectral waveform shown. C, D: Consecutive Transverse Color Flow Doppler sonographic images (blue shades coded as venous flow, away from the transducer surface, red shades represent arterial flow toward the transducer surface). Significant venous and arterial flows are present, respectively, at the center of the lesion. (continued) |
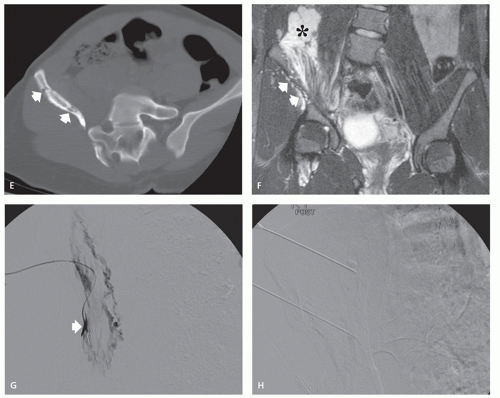 FIGURE 5.5 (Continued) E: Axial CT image shows vascular channels (arrows) traversing the atrophic right iliac wing. F: Coronal T2-weighted MR image with fat saturation (4,400/77) shows a high signal intensity mass (asterisk) near the junction of the right psoas and iliacus muscles with vascular structures permeating the inner (iliacus) surface of the right iliac bone and exiting through the outer (gluteal) surface (arrows). G: Pre-embolization Digitally Subtracted Angiographic (DSA) image acquired after an inferolateral branch (arrow) was accessed. There is early and marked filling of the vascular malformation simulating the MRI appearance. H: Post-embolization DSA image shows successful embolization with no further filing of the lesion. |
Noncontrast CT generally shows a poorly defined lesion of similar attenuation to skeletal muscle. Marked enhancement of the serpentine vascular components may be seen after intravenous contrast administration (29, 30) (see Figs. 5.7 and 5.9). Areas of associated fat overgrowth may be recognized, although in our experience, MR imaging is superior in detecting both the serpentine vessels and adipose tissue (31, 32). Phleboliths are easily detected on CT when small, or obscured by overlying osseous structures, and are more readily seen with this modality (see Figs. 5.2 and 5.3).
Ultrasound examination of intramuscular hemangioma typically reveals a complex mass and acoustic shadowing may be caused by phleboliths (33, 34, 35, 36, 37) (see Figs. 5.4 and 5.5). Recently, findings on Doppler studies have been reported (see Figs. 5.4 and 5.5) (36, 37). In some cases no abnormality is present, however, low resistance Doppler arterial signal with forward flow during both systole and diastole indicative of abnormal low vascular resistance may be seen (36, 37) (see Figs. 5.5 and 5.7).
Dubois and colleagues have emphasized the identification of high vessel density (5 Doppler signals per square centimeter) and Doppler shift of greater than 2 KHz, as signs allowing reliable diagnosis of hemangioma (36, 37). In our experience, strict application of this rule is not reliable for diagnosis and can also be seen in multiple lesions, including hemangiopericytoma, hemangioendothelioma, rhabdomyosarcoma, paraganglioma, angiosarcoma, and alveolar soft part sarcoma. It is more important to understand that in a hemangioma, the entire lesion should be composed of vascular structures without other solid nonvascular channels or spaces as can be identified in these other lesions.
Dubois and colleagues have emphasized the identification of high vessel density (5 Doppler signals per square centimeter) and Doppler shift of greater than 2 KHz, as signs allowing reliable diagnosis of hemangioma (36, 37). In our experience, strict application of this rule is not reliable for diagnosis and can also be seen in multiple lesions, including hemangiopericytoma, hemangioendothelioma, rhabdomyosarcoma, paraganglioma, angiosarcoma, and alveolar soft part sarcoma. It is more important to understand that in a hemangioma, the entire lesion should be composed of vascular structures without other solid nonvascular channels or spaces as can be identified in these other lesions.
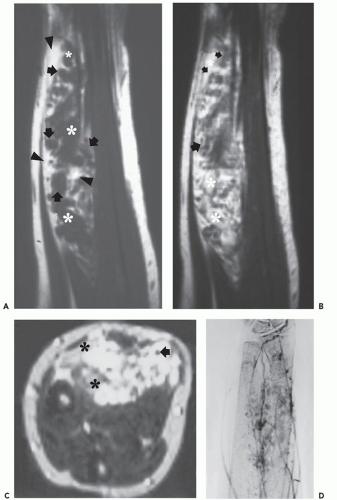 FIGURE 5.6 Intramuscular cavernous hemangioma of forearm in a 15-year-old female with soft tissue mass. Sagittal T1-weighted (500/15) MR images before (A) and after (B) gadolinium show fat overgrowth (arrowheads in A) most prominent peripherally and vascular channels/spaces (white asterisks and arrows in A) that enhance with contrast. C: Axial T2-weighted (2,442/90) MR image reveals heterogeneous signal with very high signal intensity circular foci representing slow flowing vascular spaces, intermediate intensity fat overgrowth (black asterisks), and low intensity phleboliths (arrow). D: Subtraction image from arteriogram shows filling of cavernous spaces. |
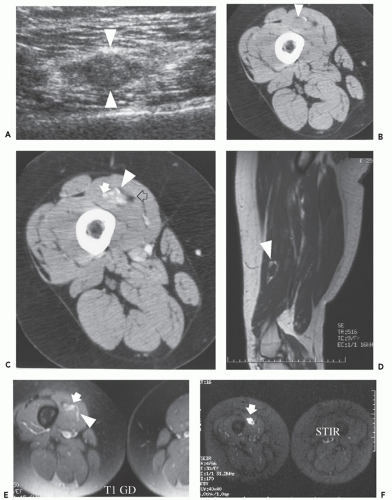 FIGURE 5.7 Intramuscular cavernous hemangioma of the thigh in a 29-year-old woman with chronic thigh pain exacerbated during exercise. A: Ultrasound shows a nonspecific intramuscular soft tissue mass (large arrowheads). CT images before (B) and following (C) intravenous contrast reveal a small focus of calcification (arrowheads) and multiple circular areas of enhancement in the intramuscular mass. Subtle fat overgrowth is also apparent peripherally (open arrow in C). Sagittal T1-weighted (-TR/TE; 516/9) (D), axial post-contrast fat-suppressed T1-weighted (TR/TE; 516/9) (E) and axial STIR (TR/TE; 766/30/170) (F) MR images demonstrate fat overgrowth peripherally surrounding the mass (large arrowhead in A) and circular vascular channels and spaces (arrows) with serpentine feeding vessels (arrowhead in E). (continued) |
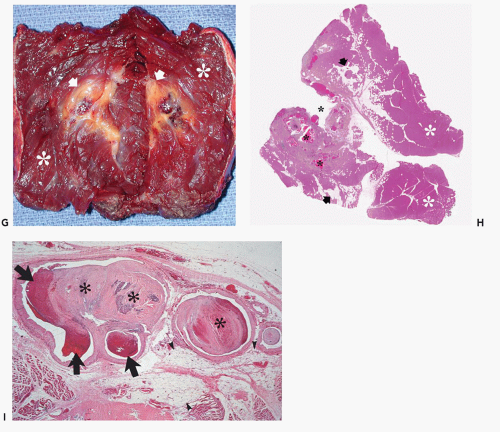 FIGURE 5.7 (Continued) This corresponds to the sectioned gross specimen photograph (G) and low power photomicrograph (H) revealing large vascular spaces (black asterisk) and surrounding muscle atrophy with increased fat (arrows) compared to normal muscle (white asterisks). I: High power photomicrograph also reveals large vascular spaces filled with thrombus and peripheral calcification (arrows) representing phleboliths. There is also fat atrophy (F) of the surrounding muscle (small arrowheads). |
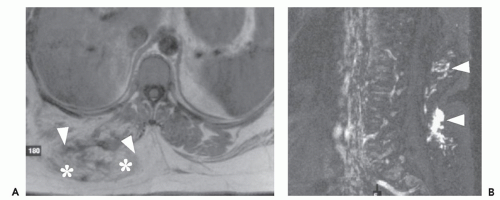 FIGURE 5.8 Infiltrating cavernous hemangioma of the paraspinal muscles with prominent fat overgrowth in a 39-year-old woman. Axial T1-weighted (TR/TE; 473/17) (A) and sagittal STIR (TR/TE/TI; 4,000/50/180) (B) MR images show a paraspinal mass with predominant adipose signal intensity (asterisks) and smaller vascular channels and spaces (arrowheads) that reveal marked high signal intensity on the long TR image (B). |
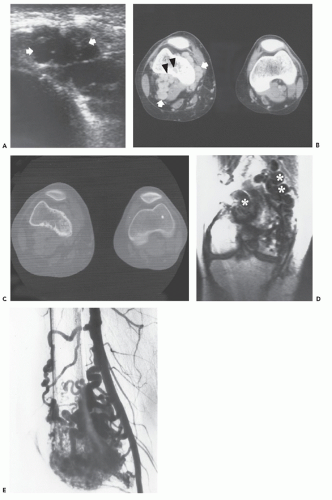 FIGURE 5.9 Arteriovenous hemangioma with high flow about knee in a 31-year-old woman. A: Sonogram reveals tubular hypoechoic vascular channels (arrows). B: CT images after intravenous contrast show intensely enhancing vascular structures (arrows) and with secondary osseous involvement (arrowheads). C: CT displayed at bone windows shows osseous involvement to better advantage. D: Coronal T2-weighted(TR/TE; 2,000/80) MR images show large serpentine arteriovenous channels with low intensity (asterisks) from high flow. E: Arteriogram reveals marked vascularity with enlarged feeding arteries, staining, and early venous filling. |
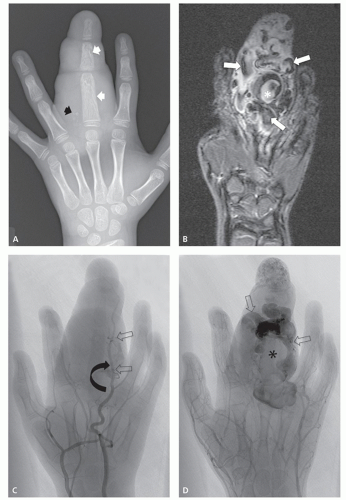 FIGURE 5.10 Arteriovenous hemangioma/malformation of the finger in a 7-year-old boy. A: Frontal radiograph of the hand demonstrates marked hypertrophy of both bone and soft tissue of the third digit. There is an associated diffuse soft tissue mass and underlying osseous involvement (white arrows). There are calcified phleboliths (black arrow) at the proximal ulnar aspect of the lesion. B: Coronal T2-weighted (TR/TE; 3,500/50) MR image with fat saturation demonstrates a heterogeneous predominantly soft tissue mass with areas of both high signal intensity and signal voids corresponding to low- and high-flow components (white arrows), respectively. There is high signal intensity intralesional thrombus formation (asterisk). C: Conventional angiographic image acquired during the early arterial phase demonstrates a mildly enlarged ulnar digital artery (curved arrow) supplying the third digit arteriovenous malformation. There are two small vessels arising from the ulnar digital artery (open arrows). D: Conventional angiographic image, late arterial phase reveals two small vessels seen on the previous image form an arteriovenous shunt that directly connects the ulnar digital artery to the enlarged venous system (open arrows). Area that lacks contrast staining (black asterisk) corresponds to intralesional thrombosis. (continued) |
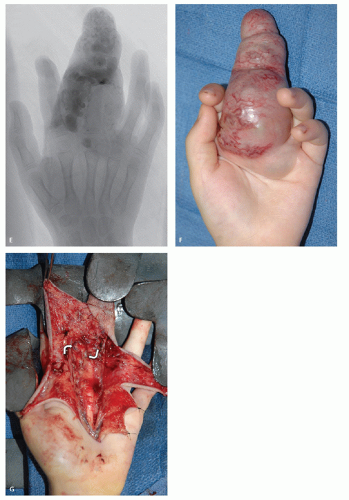 FIGURE 5.10 (Continued) E: Conventional angiographic image, late venous phase reveals delayed drainage of the lesion. F: Clinical photograph shows the discolored and enlarged finger with serpentine vascular structures. G: Intraoperative photograph obtained after exposure of the mass, demonstrating serpentine vascular channels (curved white arrows). |
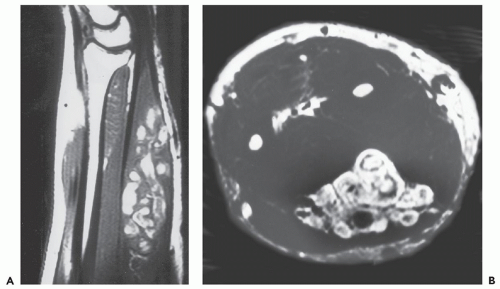 FIGURE 5.11 Venous hemangioma of the forearm in a 46-year-old man. A: Sagittal T1-weighted (TR/TE; 517/20) MR image shows high signal intensity in serpentine vascular channels representing slow flow. B: Axial T2-weighted (TR/TE; 1,700/90) MR image reveals intermediate intensity in areas of slow flow/thrombus and higher intensity peripherally. |
MR imaging, in our experience, is the best modality to evaluate soft tissue hemangiomas often showing a characteristic and pathognomonic imaging appearance (28, 31, 32, 38, 39, 40, 41, 42, 43, 44, 45, 46, 47, 48, 49). On T1-weighted images, the intramuscular hemangioma shows well-defined or a poorly marginated mass of low to intermediate signal intensity (see Figs. 5.4, 5.5, 5.6, 5.7, 5.8, 5.9, 5.10, 5.11, 5.12). Areas of high signal intensity are also often present on short TR/TE images. Previous reports have suggested that this appearance could be related to fat or slow flowing blood (34, 39, 40, 42, 46, 47, 48). These high signal intensity regions vary in appearance from fine, delicate, or lace-like strands to thick coarse bands which predominate peripherally as well as extending into septations (45). In our experience, these areas are much more commonly caused by reactive fat overgrowth and only rarely related to slow flowing blood (see Figs. 5.4, 5.5, 5.6, 5.7, 5.8 and 5.11). In some cases (particularly cavernous hemangioma) the adipose tissue can be so extensive as to be indistinguishable from lipoma (see Fig. 5.8). On T2-weighted MR images, soft tissue hemangiomas reveal either a well-marginated or an infiltrative mass with very high signal intensity in areas of vascular components while regions of adipose tissue are intermediate intensity and isointense to subcutaneous fat (see Figs. 5.4, 5.5, 5.6, 5.7, 5.8). Thus, these lesions are often heterogeneous on all MR pulse sequences, although hemangiomas smaller than 2 cm have been reported to be more homogeneous (27). In a study by Levine and coworkers (27), the ratio of MR signal intensity measurements of hemangioma to skeletal muscle on T2-weighted images (TR = 2,000 msec; TR = 90 msec) at 1.0 Tesla was greater than 7. This ratio was higher than that seen for other soft tissue masses. In addition to a relatively characteristic signal intensity, hemangiomas show a typical pattern of growth. Rather than displacing or destroying adjacent structures, they frequently tend to infiltrate adjacent tissue.
The areas of high signal intensity on T2-weighted MR images within hemangiomas often have a characteristic appearance when examined more critically, reflecting the underlying morphology. Typically, circular (vessels seen en face or cavernous spaces) and/or linear/serpentine (vessels seen longitudinally) high signal intensity can be recognized, caused by slow flow in the vascular channels and spaces (45) (see Figs. 5.4, 5.5, 5.6, 5.7, 5.8, 5.9, 5.10, 5.11, 5.12). In our experience, these serpentine vascular channels/spaces and/or fat overgrowth can be recognized in approximately 90% of hemangiomas at MR imaging and are pathognomonic. In fact, this
appearance obviates the need for biopsy, in our experience and clinical practice. Pathologic subtypes of angiomatous lesions can occasionally be recognized by MR imaging. A mass composed primarily of large vascular spaces suggests a cavernous hemangioma (see Figs. 5.4, 5.5, 5.6, 5.7, 5.8), while an arteriovenous or venous hemangioma (see Figs. 5.9, 5.10, 5.11, 5.12) shows predominantly serpentine vascular channels. Arteriovenous hemangiomas may also demonstrate low intensity serpentine vascular channels on all MR pulse sequences in lesions with rapid flow (see Figs. 5.9 and 5.10). Distinction between an entirely low flow vascular lesion and those with significant high-flow components is important. Low flow lesions account for more than 90% of vascular lesions outside the central nervous system (50). High-flow components in any hemangioma alter both clinical symptoms but also the patient management and treatment options. Hemangiomas typically show prominent enhancement after intravenous gadolinium injection (see Figs. 5.5, 5.6, 5.7, 5.8). Hemorrhage may also occur in hemangiomas, often showing high signal intensity on all pulse sequences as well as fluid levels within larger vascular spaces (51). Phleboliths are more easily detected by radiographs or CT than on MR images; however, on MR they appear as low intensity circular foci on all pulse sequences.
appearance obviates the need for biopsy, in our experience and clinical practice. Pathologic subtypes of angiomatous lesions can occasionally be recognized by MR imaging. A mass composed primarily of large vascular spaces suggests a cavernous hemangioma (see Figs. 5.4, 5.5, 5.6, 5.7, 5.8), while an arteriovenous or venous hemangioma (see Figs. 5.9, 5.10, 5.11, 5.12) shows predominantly serpentine vascular channels. Arteriovenous hemangiomas may also demonstrate low intensity serpentine vascular channels on all MR pulse sequences in lesions with rapid flow (see Figs. 5.9 and 5.10). Distinction between an entirely low flow vascular lesion and those with significant high-flow components is important. Low flow lesions account for more than 90% of vascular lesions outside the central nervous system (50). High-flow components in any hemangioma alter both clinical symptoms but also the patient management and treatment options. Hemangiomas typically show prominent enhancement after intravenous gadolinium injection (see Figs. 5.5, 5.6, 5.7, 5.8). Hemorrhage may also occur in hemangiomas, often showing high signal intensity on all pulse sequences as well as fluid levels within larger vascular spaces (51). Phleboliths are more easily detected by radiographs or CT than on MR images; however, on MR they appear as low intensity circular foci on all pulse sequences.
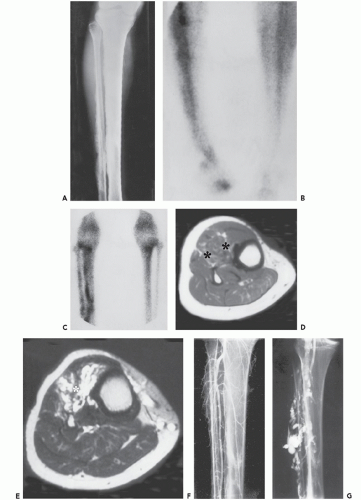 FIGURE 5.12 Venous hemangioma of the calf in a 22-year-old woman with long-standing lower leg swelling. A: Radiograph shows thick periosteal reaction, perhaps related to chronic vascular stasis. Blood-pool (B) and static delayed (C) images from Technetium-99m bone scan reveal increased activity. Axial T1-weighted (TR/TE; 800/17) (D) and T2-weighted(TR/TE; 2,400/90) (E) spin-echo MR images show anterior soft tissue lesion with fat overgrowth (asterisks) and serpentine high intensity vascular component, caused by slow flow, on the long TR image. Note infiltrative pattern of growth. F: Arteriogram of the lower leg is normal. G: Direct puncture venogram reveals extensive hemangioma. |
Interestingly, capillary hemangiomas, unlike cavernous lesions, frequently demonstrate a nonspecific appearance on MR imaging. Capillary hemangiomas show intermediate signal intensity on T1-weighting and intermediate-to-high signal intensity on T2-weighting without the characteristic presence of serpentine vascular channels and spaces seen with cavernous lesions (see Fig. 5.2). Fat overgrowth is also not typically seen and is difficult to recognize as these lesions usually arise in the subcutaneous adipose tissue. This nonspecific imaging appearance is likely directly related to the underlying pathology of these cellular lesions composed of vascular channels that are too small to detect radiologically. Thus, in contradistinction to cavernous hemangiomas, capillary lesions can be identified on MR imaging but not specifically diagnosed by intrinsic characteristics. However, it is important to remember that these superficial lesions (strawberry nevi) are typically easily diagnosed clinically with confidence and if imaged, only staging with extent is required for appropriate patient management. This is in distinct contrast to cavernous lesions that are clinically nonspecific but usually reveal pathognomonic MR imaging appearance.
Angiographic studies show variable findings in evaluation of hemangiomas depending on the histologic subtype (52). Capillary and cavernous hemangiomas demonstrate enlarged feeding vessels with arteriovenous shunting and contrast puddling (see Figs. 5.5 and 5.6). Arteriovenous lesions, on the other hand, reveal markedly torturous feeding vessels with early draining veins and intense tumor staining (see Figs. 5.9 and 5.10). Venous hemangioma often demonstrate no abnormality in the arterial phase of an angiogram and may only be detected on delayed imaging of the venous phase, after injection of contrast during venography or following direct puncture of the lesion (53) (see Fig. 5.12). Large slow flowing vessels are seen in venous hemangiomas after opacification with contrast. These angiographic features of soft tissue hemangiomas are also reflected in nuclear medicine studies. Technetium-99m DTPA or red blood cell studies often show uptake of radionuclide (54, 55, 56). Mild increased activity may also be seen on bone scintigraphy, particularly during the dynamic and blood pool stages with less uptake on the static images (54) (see Fig. 5.12). These findings on bone scintigraphy are caused by increased blood flow, alterations of capillary permeability, and calcification.
OTHER BENIGN VASCULAR LESIONS
Although hemangioma is the most commonly encountered vascular soft tissue mass, there are a number of more uncommonly encountered vascular lesions that deserve a separate discussion.
Synovial Hemangioma
Soft tissue hemangioma arising in the synovium is rare, accounting for less than 1% of all hemangiomas (57). Young adults and adolescents are usually affected and there is often a long history of articular symptoms. Patients are symptomatic by age 16 in approximately 75% of cases. In contradistinction to intramuscular hemangiomas, almost all patients are symptomatic, presenting with pain, swelling, and decreased range of motion (58). Histologically, 50% of these lesions are cavernous, 25% capillary, 20% arteriovenous, and 5% venous (57, 58, 59). The knee is the most commonly affected joint accounting for approximately 60% of cases, followed by the elbow, which is involved in 30% of cases (57, 58, 59). The majority of lesions (67%) are intra-articular, with the remainder in a bursa adjacent to a joint (57, 58, 59). These lesions have a similar intrinsic appearance on radiologic studies as previously described for other soft tissue hemangioma, differing only by location (58, 60) (Figs. 5.13 and 5.14). Chronic hyperemia can also result in focal limb enlargement. However, in addition, synovial hemangioma may cause repetitive episodes of intra-articular bleeding (see Fig. 5.14). This may result in a radiologic appearance that can be confused with pigmented villonodular synovitis or the arthropathy associated with hemophilia. In distinction from hemophiliac arthropathy, synovial hemangioma is almost exclusively a monoarticular process.
Epithelioid Hemangioma
Epithelioid hemangioma is a benign vascular tumor, which has also been called angiolymphoid hyperplasia with eosinophilia, pseudo or atypical pyogenic
granuloma, inflammatory angiomatous nodule, and histiocytoid hemangioma. Lesions reported previously with this nomenclature as Kimura disease represent a different entity. The etiology of these lesions, either reactive or neoplastic, is uncertain and controversial. Features favoring a reactive process include a predilection for the superficial soft tissues, history of trauma in up to 10% of cases, and intimate relationship to abnormal (mural damage, rupture, or both) large vessels in 60% of cases (2, 3). Epithelioid hemangioma is a lesion of adults, with most patients between 20 and 50 years of age (peak incidence in the fourth decade) and there is variable sex predominance reported in studies (2, 3). It is usually superficially located in the dermis or subcutis of the head (often in the superficial temporal artery distribution) and neck (61% of lesions), with a predilection for the auricular region and the distal extremities (25% of lesions, particularly the digits) (5). Multiple lesions develop in approximately 50% of patients, often closely associated with one another (2). Peripheral blood eosinophilia and lymphadenopathy are also seen in about 20% of patients. Pathologic features of these lesions are a prominent proliferation of small sized (capillary) vessels lined by epithelioid endothelial cells and centered about a larger vessel. Clinically, dermal lesions present as dull red pruritic plaques from less than 1 to 8 cm in size, which may ulcerate. Subcutaneous lesions are typically asymptomatic. Local recurrence has been reported in approximately 30% of lesions. Lymph node involvement has rarely been reported but aggressive features do not occur (5).
granuloma, inflammatory angiomatous nodule, and histiocytoid hemangioma. Lesions reported previously with this nomenclature as Kimura disease represent a different entity. The etiology of these lesions, either reactive or neoplastic, is uncertain and controversial. Features favoring a reactive process include a predilection for the superficial soft tissues, history of trauma in up to 10% of cases, and intimate relationship to abnormal (mural damage, rupture, or both) large vessels in 60% of cases (2, 3). Epithelioid hemangioma is a lesion of adults, with most patients between 20 and 50 years of age (peak incidence in the fourth decade) and there is variable sex predominance reported in studies (2, 3). It is usually superficially located in the dermis or subcutis of the head (often in the superficial temporal artery distribution) and neck (61% of lesions), with a predilection for the auricular region and the distal extremities (25% of lesions, particularly the digits) (5). Multiple lesions develop in approximately 50% of patients, often closely associated with one another (2). Peripheral blood eosinophilia and lymphadenopathy are also seen in about 20% of patients. Pathologic features of these lesions are a prominent proliferation of small sized (capillary) vessels lined by epithelioid endothelial cells and centered about a larger vessel. Clinically, dermal lesions present as dull red pruritic plaques from less than 1 to 8 cm in size, which may ulcerate. Subcutaneous lesions are typically asymptomatic. Local recurrence has been reported in approximately 30% of lesions. Lymph node involvement has rarely been reported but aggressive features do not occur (5).
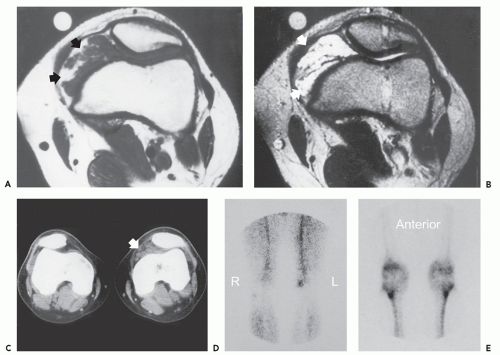 FIGURE 5.13 Synovial hemangioma of the knee in a 21-year-old man. Axial T1-weighted (TR/TE; 600/20) (A) and T2-weighted (TR/TE; 1,800/80) (B) spin-echo MR images show a soft tissue mass arising from the medial aspect of the knee joint. The associated fat overgrowth (arrows in A), infiltrative pattern of growth, and serpentine vascular spaces/channels (arrows in B) with high signal intensity are typical of a hemangioma. C: Corresponding axial noncontrast CT shows the multiple, circular, serpentine vascular structures (arrow) as well as associated adipose tissue. D: Flow and blood-pool images from Technetium-99m bone scan reveal increased tracer accumulation in the medial aspect of the knee. E: Delayed static image shows minimal increased tracer accumulation on the left. |
Kimura disease is now considered a different entity than epithelioid hemangioma, with only superficial
pathologic similarities. This entity represents a chronic inflammatory disease that is endemic in the Asian population and is infrequent elsewhere. Lymphadenopathy with or without a soft tissue mass is the hallmark of Kimura disease and there is a marked male predilection (>80%) (61). The subcutaneous tissues of the head and neck are most commonly affected, although the groin, extremities, and chest wall may also be involved. Peripheral eosinophilia almost invariably accompanies this disease. Pathologically, there are dense lymphoid aggregates with prominent surrounding eosinophilic infiltrates. In the later stages of this disease, hyaline fibrosis occurs, creating infiltration of surrounding structures and simulating a more aggressive malignant process.
pathologic similarities. This entity represents a chronic inflammatory disease that is endemic in the Asian population and is infrequent elsewhere. Lymphadenopathy with or without a soft tissue mass is the hallmark of Kimura disease and there is a marked male predilection (>80%) (61). The subcutaneous tissues of the head and neck are most commonly affected, although the groin, extremities, and chest wall may also be involved. Peripheral eosinophilia almost invariably accompanies this disease. Pathologically, there are dense lymphoid aggregates with prominent surrounding eosinophilic infiltrates. In the later stages of this disease, hyaline fibrosis occurs, creating infiltration of surrounding structures and simulating a more aggressive malignant process.
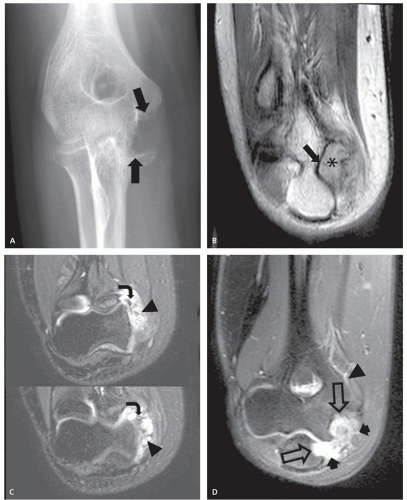 FIGURE 5.14 A: Frontal radiograph of the elbow demonstrates marked erosion of the lateral aspects of the trochlear and the coronoid process (black arrows). B: Sagittal T1-weighted MR image (TR/TE; 742/18) demonstrates a heterogeneous, predominately intermediate signal intensity mass (asterisk) within the medial aspect of the elbow joint causing the extrinsic erosion of bone (arrow). C: Contiguous axial T2-weighted MR images with fat saturation (TR/TE; 2,523/70) demonstrates that the mass is predominantly high signal intensity. Areas of low signal corresponding to high flow components (curved arrows) and serpentine high signal intensity structures represent the predominant cavernous hemangioma component infiltrating the joint (arrowheads). D, E: Coronal and sagittal T1-weighted MR images after intravenous contrast (TR/TE; 787/18) reveal moderate to marked heterogeneous enhancement. Serpentine morphology (arrows) and feeding vessels (arrowheads) are also apparent as is bone erosion (open arrows). F: Photomicrograph shows vascular channels and spaces (asterisk) with overlying synovial lining (arrows). (continued) |
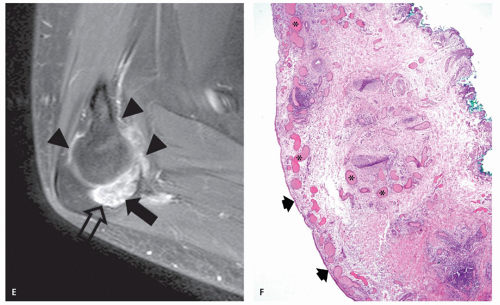 FIGURE 5.14 (Continued) |
Imaging of epithelioid hemangioma or Kimura disease has not been extensively reported. In our experience, these lesions reveal a nonspecific heterogeneous appearance on CT and MR imaging and enhance following contrast administration. CT reveals a nonspecific mass of soft tissue attenuation, often with mild surrounding edema. On MR images, there is intermediate signal intensity on T1-weighting and intermediate-to-high signal intensity on T2-weighting, with irregular infiltrative lesion margins (including the parotid in head/neck lesions), with surrounding edema, reflecting the pathologic appearance (62, 63). Lesions are often along a lymph node distribution, particularly the posterior auricular, cervical, inguinal, and epitrochlear areas. Sonography reveals round hypoechoic masses with normal hilar lymph node architecture and homogeneous internal echoes. Power Doppler studies reveal prominent intranodal vessels with a hilar pattern and low intranodal resistance (64). The cause of Kimura disease is unknown, although the laboratory abnormalities suggest an immunologic reaction. These benign lesions may recur locally following surgical excision, but have no malignant potential. Other treatment options include steroids and radiation therapy.
Related posts:

Stay updated, free articles. Join our Telegram channel

Full access? Get Clinical Tree


