Vascular Malformations
ARTERIOVENOUS MALFORMATIONS
KEY FACTS
Congenital in nature, generally present in middle age (65% in patients >40 years of age).
Very rare, incidence of 1:100,000 individuals. Arteriovenous malformations (AVMs) represent 25% of all intracranial vascular malformations.
Symptoms: hemorrhage (usually parenchymal, 0.5% to 1% of these patients per year), seizures, and headaches. Increased chance of rupture during pregnancy.
Risk of bleeding is 2% to 3% per year, and mortality is approximately 20% to 30% per bleeding episode. Cumulative risk of bleeding is 70%.
Factors associated with increased risk of bleeding: deep or periventricular location, intranidal aneurysm(s), venous aneurysms, and deep venous drainage.
Location: more than 80% are supratentorial (especially parietal), over 80% are solitary, and 2% are multiple.
AVMs are solitary in 98% of patients, with multiple AVMs (2%) seen in Rendu-Osler-Weber syndrome, Wyburn-Mason syndrome, craniofacial arteriovenous metameric syndrome.
Major vascular supply is generally from internal carotid artery (ICA) (pial, 75%), but large AVMs may recruit external carotid artery (ECA) (dural, 15%) vessels or both (mixed, 10%) or even contralateral ICA and ECA.
Computed tomography (CT) shows calcification in 30% of intracranial AVMs; cyst may be seen especially after stereotactic radiosurgery.
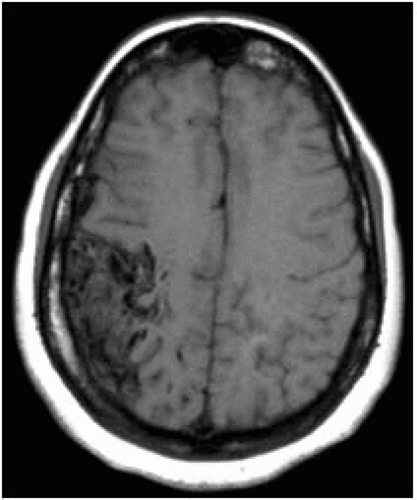 FIGURE 12-1. Noncontrast axial T1 shows a wedge-shaped AVM in the right frontoparietal region. |
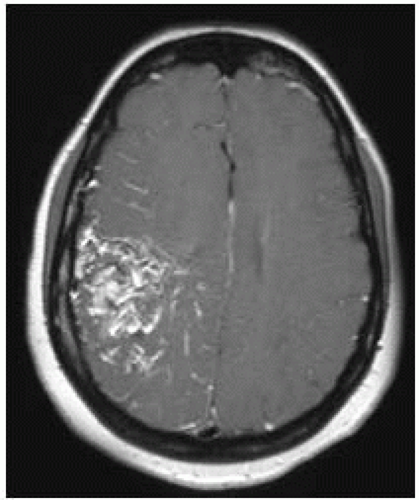 FIGURE 12-2. Corresponding postcontrast T1 shows enhancement of most of the lesion. |
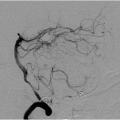
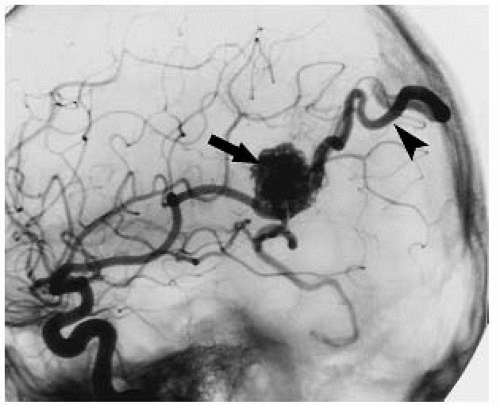 FIGURE 12-3. Lateral DSA view, in a different patient, shows AVM nidus (arrow) being fed by branches of the MCA and immediate filling of a draining vein (arrowhead). |
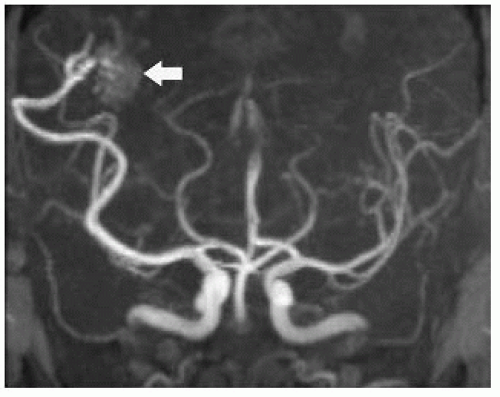 FIGURE 12-4. FrontalTOF MRAview, in a different patient, only faintly shows AVM nidus (arrow) due to fast flow and signal dephasing. |
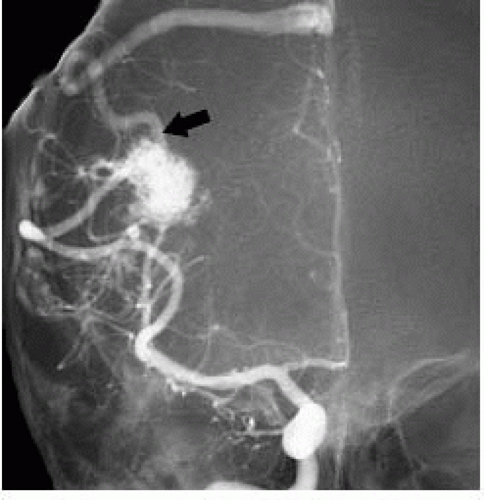 FIGURE 12-5. Frontal view of DSA in same patient as 12-4 shows feeding arteries, nidus, and draining vein (arrow) not seen on MRA due to fast and turbulent flow. |
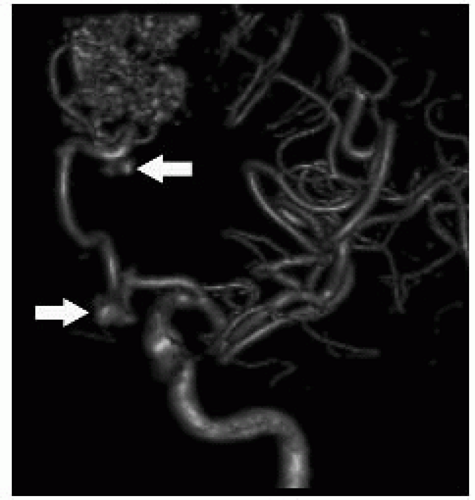 FIGURE 12-6. Three-dimensional DSA in a different patient shows a frontal AVM with multiple aneurysms (arrows) in feeding arteries. (See color insert) |
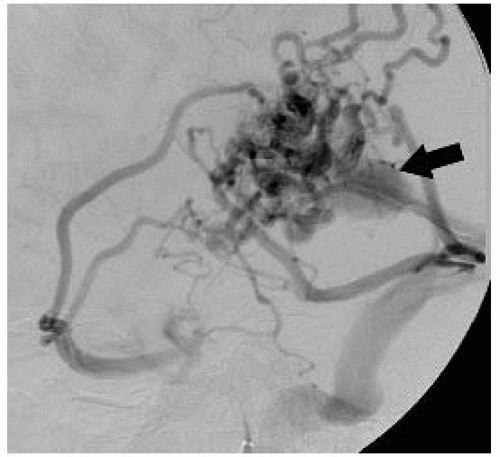 FIGURE 12-7. Lateral DSA view, in a different patient, shows presence of AVM and an aneurysm (arrow) in draining vein. |
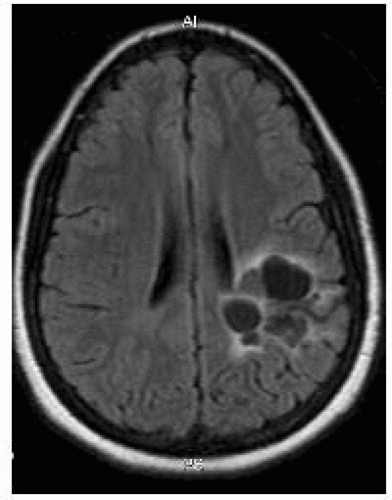 FIGURE 12-8. Axial fluid attenuated inversion recovery (FLAIR) obtained 3 years after stereotactic radiosurgery shows no residual AVM but formation of cysts. |
SUGGESTED READING
Gupta V Chugh M, Walia BS, Vaishya S, Jha AN. Use of CT angiography for anatomic localization of arteriovenous malformation nidal components. Am J Neuroradiol 2008;29:1837-1840.
CAVERNOUS MALFORMATIONS
KEY FACTS
Slow-flow low-pressure malformations with no normal intervening brain parenchyma.
80% are supratentorial and 15% are multiple (often a familial component is present) and they may occur in the presence of developmental venous anomalies. Multiple (10% to 30%) ones maybe seen after irradiation or in a specific familial syndrome (autosomal dominant). Giant ones are more common in children.
Second most common intracranial vascular malformation after developmental venous anomalies.
Annual risk of bleeding is <1%; when it occurs, it tends to be self-limited and clinically not significant; however, risk of bleeding increases after one hemorrhage. Hemorrhagic ones typically have a surrounding rim of moderate T1 hyperintensity.
Most common clinical symptom is seizures (nearly 50%); most are asymptomatic.
Many have associated venous malformations (called “transitional” type); cavernous malformations may form from occlusion of a vein in developmental venous anomaly.
They are better visualized with T2* and SWI.
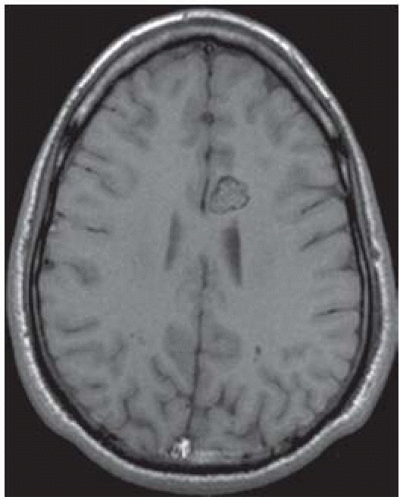 FIGURE 12-9. Axial noncontrast T1 shows typical “popcorn” or “mulberry” appearance of a cavernous malformation in the medial left frontal lobe. |
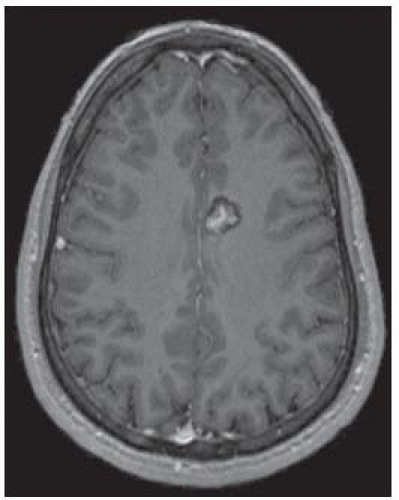 FIGURE 12-10. Corresponding postcontrast T1 shows enhancement of the central part of the malformation. |
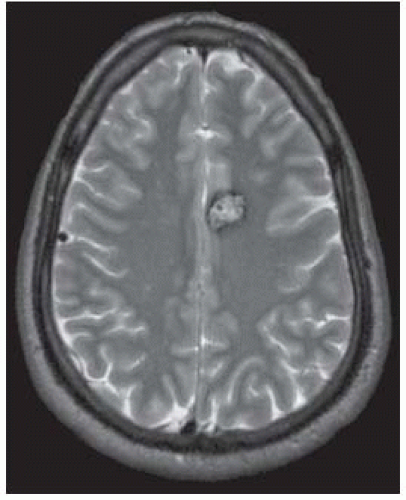 FIGURE 12-11. Corresponding T2 shows a dark rim surrounding the lesion. |
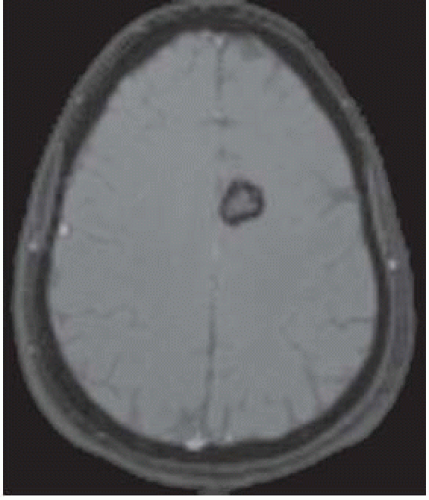 FIGURE 12-12. Corresponding T2* shows “blooming” of the rim due to magnetic susceptibility from chronic blood products. |
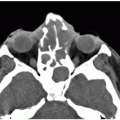
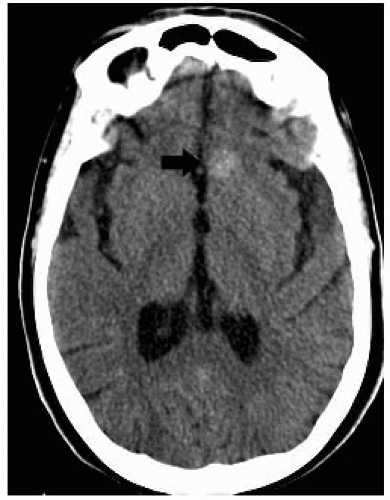 FIGURE 12-13. Axial noncontrast CT, in a different patient, shows a dense left frontal cavernoma (arrow). |
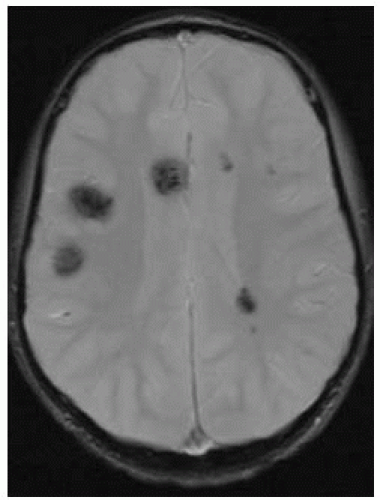 FIGURE 12-14. Axial T2*, in a different patient with familial cevernoma syndrome, shows multiple dark lesions. |
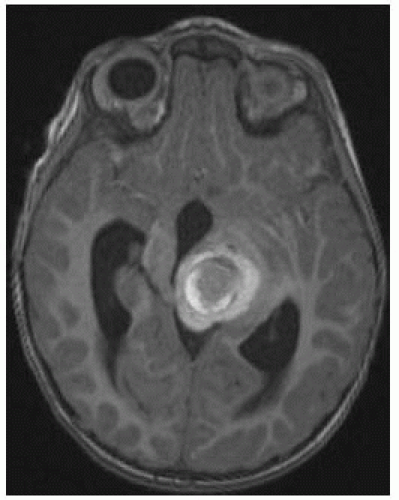 FIGURE 12-15. Axial noncontrast T1, in a different patient, shows hemorrhagic cavernoma with typical hyperintense rim. |
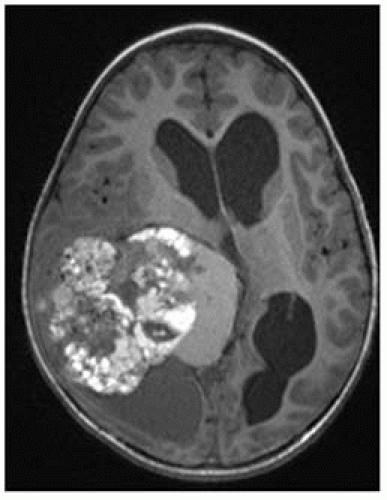 FIGURE 12-16. Axial noncontrast T1, in a different patient, shows a giant cavernoma. |
SUGGESTED READING
de Souza JM, Domingues RC, Cruz LCH Jr, Domingues FS, Iasbeck T, Gasparetto EL. Susceptibility-weighted imaging for the evaluation of patients with familial cerebral cavernous malformations: a comparison with T2-weighted fast spin-echo and gradient-echo sequences. Am J Neuroradiol 2008;29:154-158.
Yun TJ, Na DG, Kwon BJ, Rho HG, Park S-H, Suh Y-L, et al. A T1 hyperintense perilesional signal aids in the differentiation of a cavernous angioma from other hemorrhagic masses. Am J Neuroradiol 2008;29:494-500.
DEVELOPMENTAL VENOUS ANOMALIES
KEY FACTS
Most common (60%) cerebral vascular malformation (formerly called venous angioma).
Most are incidentally found and asymptomatic but occasionally may present with seizures, headaches, and/or focal neurologic deficits.
Hemorrhage is uncommon but may occur with developmental venous anomalies (DVAs) located in the posterior fossa; when a venous malformation bleeds, a coexisting cavernous malformation (15% to 20%) is usually responsible for the hemorrhage. Hemorrhage may also be secondary to stenosis or thrombosis of a vein.Related posts:

Stay updated, free articles. Join our Telegram channel

Full access? Get Clinical Tree