(1)
Radiation Monitoring Devices Research Nuclear Medicine, Water town, Massachusetts, USA
4.1 Introduction
4.1.1 Molecular Biology
4.1.2 Optical Imaging
4.1.3 Radionuclide Imaging
4.3.2 Thermography
4.3.3 Endoscopy
4.5.1 Fluoroscopy
4.8.1 Slice Thickness
4.8.3 Simple Back Projection
4.8.4 Scattered Radiation
4.8.5 Spatial Resolution
4.8.6 Optical Density (OD)
4.9.1 Screen Film Technology
4.10.1 Noise
4.10.2 Contrast
4.11 Energy Resolution
4.13 Summary
Abstract
Medical imaging refers to the techniques and processes used to create images of the human body or animals (or parts thereof) for clinical purposes or medical therapy. As a discipline in its widest sense or as a subdiscipline, medical imaging is the perturbation of the cellular molecules to identify the true identity of the cells or tissues of a living organism. As a matter of fact, the biomedical engineering, medical physics, or medicine unites molecular biology and in vivo imaging [1].
4.1 Introduction
Medical imaging refers to the techniques and processes used to create images of the human body or animals (or parts thereof) for clinical purposes or medical therapy. As a discipline in its widest sense or as a subdiscipline, medical imaging is the perturbation of the cellular molecules to identify the true identity of the cells or tissues of a living organism. As a matter of fact, the biomedical engineering, medical physics, or medicine unites molecular biology and in vivo imaging [1].
The multiple and numerous potentialities of this field of engineering coupled with molecular biology, chemistry, optical imaging, structural engineering, radionuclide imaging, and instrumentation/tools like MRI, CT, and PET are applicable to the diagnosis of cancer and neurological and cardiovascular diseases [1, 2]. Therefore, it will not be unrealistic to represent medical imaging by Venn diagrams or a set of diagrams that show hypothetical possible logic relations between a finite collection of sets (groups of things as mentioned). As a matter of fact, Venn diagram was conceived around 1880 by John Venn and comprises overlapping circles. The interior of the circle symbolically represents the elements of the set, while the exterior represents elements which are not numbers of the set. Figure 4.1 shows overlapping circles representing the Venn diagram with separate sets of different disciplines of molecular (medical) imaging system [3]. According to an expert in the field, molecular imaging reflects a shift in emphasis and a shift in attitude, moving from the undeniably useful, but largely nonspecific, diagnostic imaging approaches that are currently employed in clinic [1]. Thus, molecular imaging has become a part and parcel of medical imaging.
Fig. 4.1
Venn diagram with different sets of molecular biology
4.1.1 Molecular Biology
It is the study of biology at the molecular level. The field overlaps with other areas of biology and chemistry, particularly with genetics and biochemistry. It mostly deals with various systems of a cell, including interaction between DNA, RNA, and protein biosynthesis [3].
4.1.2 Optical Imaging
It falls under the categories of in vivo fluorescence and bioluminescence imaging. It plays an important role in interrogating biological systems, particularly, rodent models for human diseases [3].
4.1.3 Radionuclide Imaging
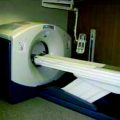
It is a technique that uses the introduction of tiny amounts of radioactive materials into a patient’s body in order to obtain images. Common tests include computed tomography (CT), positron emission tomography (PET), single-photon emission computed tomography (SPECT), and scans. Figure 4.2 shows the scanned image of a human body captured by computed tomography (CT). X-ray-based CT scans are increasingly used for providing three-dimensional (3-D) view of a human body or parts thereof. It is estimated that by the year 2011, more than 100 million CT scans will be performed in the USA compared to three million in 1980 [4].
Fig. 4.2
Scanning image of a human body obtained by CT scanning
4.2 Radiation and Carcinogen
The ionization radiation can damage the biological tissues by breaking the water molecule—one of the constituents of the living tissue. The interaction of ionizing radiation with a molecule of water creating ion pair consisting of the ejected electron and a water molecule with an unpaired outer orbital electron is referred to as free radicals (H2O → H+ + HO−) (Fig. 4.3).
Fig. 4.3
An artist’s impression of the dissociation of a molecule when it is subjected to electromagnetic radiation which is ultimately imaged to detect the abnormalities inside a biological tissue or cell
Two types of radiation are especially dangerous because they can modify DNA: ultraviolet radiation and ionizing radiation. Ionizing radiation mainly causes breaks in DNA chains. Both types of radiation can cause cancer in animals and can transform cells in culture [5].
Energy deposited by the ionizing radiation damages the chemicals of life within each cell. When the energy of ionization is deposited directly into the chemicals of life—such as DNA, RNA, proteins, and enzymes—damage is referred as direct effect. DNA is known to be critically important molecule located at the nucleus of the cell and is called the irreplaceable master molecule. If the master molecule is severely damaged, the cell can die or one can notice the abnormality of the cell/tissue [6]. Molecular imaging enables visualization of the cellular function and the follow-up of the molecular process in living organism without perturbing them. As a result, molecular (medical) imaging system has multiple and numerous potentialities in diagnosing diseases such as cancer and neurological and cardiovascular diseases [7].
4.3 Molecular (Medical) Imaging
Medical imaging in its widest sense is a part of biological imaging and incorporates radiology, radiological sciences, thermography, endoscopy, medical photography, and microscopy besides X-ray fluoroscopy, computer tomography (CT), positron emission tomography (PET), single-photon emission tomography (SPECT), magnetic resonance imaging (MRI), and ultrasound. As a matter of fact, medical imaging constitutes a subdiscipline of biomedical engineering, medical physics, or medicine depending upon the context [8, 9].
4.3.1 Radiology and Radiological Science
Radiology or the entire field of radiological science is the part of the medical science dealing with the use of electromagnetic (EM) energy emitted by X-ray generators or other such devices for the purpose of obtaining visual information as a part of medical imaging.
It is more than a century when physics made a dramatic entry into the field of nuclear medicine with the discoveries of X-rays and natural radioactivity, which are considered to have potential for medical imaging and therapy [10]. By and by, X-ray radiography and therapy have made impressive progress over recent decades as medical innovation has taken full advantage of the results of the fundamental research in physics, chemistry, and molecular biology [11]. As a matter of fact, X-rays are just one of the many (e.g., thermography, endoscopy, microscopy) technological tools that make up medical imaging technology.
4.3.2 Thermography
Thermography, thermal imaging, thermographic imaging, or thermal video all fall in one discipline of infrared (IR) imaging, and it displays the amount of IR energy that is emitted, transmitted, and reflected by an object of interest. As such, thermographic cameras detect radiation in the infrared range of the EM spectrum (roughly 900–14,000 nm) and produce images of that radiation, called thermogram.
The incident IR energy comprises of emitted energy, transmitted energy, and the reflected energy, and the energy profile is viewed through a thermal imaging device. In general, the emitted energy from the object is of interest, which is being measured. The thermographic camera employs a series of mathematical algorithms and builds a picture in the viewer, which is ultimately recorded [12]. Figure 4.4 shows the IR picture of the female breast. Different colors indicate temperature of the tissues on different parts of the breast. The scale on the right-hand side indicates the temperature of each color associated with the picture.
Fig. 4.4
The IR picture of the human breast. Different colors indicate temperature of the tissues on different parts of the breast (Photo courtesy of Pacific Chiropractic and Research Center)
The principle of thermography is applied in digital IR imaging of a breast to diagnose any existence of cancerous tumor. It is based on the principle that metabolic activity and vascular circulation in both precancerous tissue and the area surrounding a developing breast cancer are almost always higher than in normal breast tissue. In an ever-increasing need for nutrients, cancerous cells increase blood circulation by holding open existing blood vessels, opening dormant vessels, and creating new ones. The activities naturally result in an increase in regional surface temperatures of the breast. The ultrasensitive thermoscopy with IR camera and sophisticated computer can detect, analyze, and produce high-resolution image [12, 13].
The difference between infrared (IR) film and thermography is that the former one is sensitive to IR radiation in the range between 250C and 500C, while the range of thermography is approximately −50C to over 2,000C. Thermography has different advantages over IR and other imaging systems such as the following: (1) it is capable of catching moving targets in real time, (2) it can be used to measure or observe an area inaccessible or hazardous for other methods, and (3) it can be used to find defects in shafts and metals.
4.3.3 Endoscopy
It is a procedure which enables a physician to look inside human body without an operation (Fig. 4.5a). It uses an instrument called an endoscope which has a tiny camera attached to a long thin tube (Fig. 4.5b). The tip of the instrument is inserted inside the body through a passage or opening to see some abnormalities of an organ. Sometimes the instrument is used to perform surgery, such as removal of polyps from a colon.
Fig. 4.5
(a) Endoscope inside a human body to monitor any suspicious material inside the stomach. (b) Endoscope with an attached camera at the end of the long-necked tube (Courtesy: National Cancer Institute, US)
4.3.4 Microscopy or Medical Photography
Recently, the researchers at the University of California, Berkeley, have unveiled a new gadget that could be used by the physician to diagnose diseases like tuberculosis and malaria. The device has programmable mini mobile phone with a camera attached to the tip. It can be used as a microscope to examine blood samples in the field and help spot some of the world’s deadliest diseases. The CellScope microscope as it is called has attachment clips on to the mobile phone that uses the built-in camera to process the images. As a result, physician can perform complex high-resolution microscopy on a blood or sputum sample placed on the slide. Sample evaluation could potentially be performed in real time while a patient is still in the presence of a health care worker. Figure 4.6 shows the picture of a mobile phone microscope (celloscope with attached camera).
Fig. 4.6
Picture of a mobile phone microscope (CellScope with attached camera) (Photo courtesy of Wiki)
The ability to make accurate, permanent, and objective images for the use in medical diagnosis, treatment and further prevention of the disease, medical photography are being used extensively in the medical Community. In this field, images are made to document all of the prominent features of a subject without exaggeration, enhancement, distortion, deliberate obliteration, or addition of details that might lead to misinterpretation by the radiologists. Figure 4.7 shows an exhaustive effort by a medical team taking photographs with a medical microscopic camera after surgical procedures.
Fig. 4.7
Photograph of a medical team taking photographs after surgical procedures with a medical microscopic camera
4.4 More Advanced Technology for Medical Imaging
The degree of importance of imaging to physicians and their ability to provide care was summed up by the New England Journal of Medicine in 2000. In a retrospective on the turn of the millennium, the editors of the journal called medical imaging one of the most important medical developments of the past 1,000 years—ranking with such milestones as the discovery of anesthesia and discovery of antibiotics [14]. Indeed, better imaging permitted the development of new treatments for cancer and vascular and cardiac diseases.
Over the past two decades, the advances in medical imaging have dramatically improved cancer diagnoses and its treatment. In fact, the death rates in America due to breast cancer have declined [15] because of minimally invasive imaging procedures. As for example, X-ray fluoroscopy—which allows biopsies of breast, bone, and other tissue without surgery—is dramatically reducing infections and recovery time [16].
Indeed, CT scans and X-ray fluoroscopy have enabled precise diagnosis of cancer and provided the physician to locate the affected area more precisely than ever. No wonder, 3-D imaging technology has allowed surgeons to remove cancerous tissue while sparing neighboring healthy tissue. Use of imaging technologies like CT, X-ray fluoroscopy, positron emission tomography (PET), single-photon emission computed tomography (SPECT), magnetic resonance imaging (MRI), ultrasound, and nuclear medicine has contributed to the significant improvements in treating vascular and cardiac diseases and has made significant improvements in mortality and morbidity.
According to a survey in 2003 by a group of physicians, X-ray fluoroscopy is the therapy of choice for coronary angioplasty [17]. More broadly, studies revealed that as much as 70 % of the survival improvement in heart attacks over the past 30 years is the result of changes in medical technology, including cardiac catheterization, coronary angioplasty, and cardiac stents—all made possible by X-ray-based or other imaging technology [18, 19].
The computer tomography (CT) scan, on the other hand, can identify stroke early, and the physicians can take early decision about which treatment will be better for the patient [20], including clot-busting drugs known as thrombolytic therapy. On the other hand, if the stroke is caused by hemorrhage, X-ray fluoroscopy guides delicate surgical procedures to close ruptured arteries [21].
There is no doubt that the medical imaging technology has empowered doctors and medical professionals to do a better job in diagnosing and treating patient and providing them with more medical care. As a result, there is a significant improvement in mortality and morbidity from vascular- and cancer-related diseases. However, radiation exposure during imaging is a critical issue with regard to imaging children. However, National Cancer Institute points out that the benefit of the imaging technology outweighs potential risk. As a matter of fact, discussions of radiation risk are often highly complex. At the same time, the potential risk of radiation exposure from imaging technologies must also be understood in relationship to other potential sources of radiation. It goes without saying that the innovations in product design (automatic tube current modulation in X-ray radiation system, automatic exposure control, improvements in electronics, beam collimation, beam filtration, adaptive software filtration, and use of short radiation pulses) and operation have enabled dose reduction and ultimately reduced the potential risk of radiation (Table 4.1).
Table 4.1
Innovations in imaging technologies and ultimate dose reduction
Features | Amount of dose reduction |
|---|---|
Automatic tube current modulation | Between 20 and 60 % |
Pre-patient filtration (Cu/Al) | Up to 50 % |
Pre-patient beam filtration and shaping | Up to 50 % |
Use of pulse instead of continuous radiation | ~50–75 % |
Ceramic CT detector material | ~50 % |
Use of advanced hardware and software for X-ray beam collimation | Reduce multi-slice over-beaming by 35 % |
Use of noise reduction filter | ~50 % |
Tube current reduction in ECG | ~50 % (in cardiac CT) |
Optimization of X-ray beam filtration | 15–25 % |
Step and shoot acquisition and volumetric reconstruction | ~70 % (in cardiac CT) |
4.5 Advanced Tools (Instruments) for Medical (Molecular) Imaging
The area of advanced instrumentation for medical imaging covers image acquisition, modeling and quantification, image correction, and interpretation of medical images. In other words, medical imaging is often perceived to designate the set of techniques that produce images of the internal aspect of the body (without having to open it). The advanced imaging system may use any one of the following or the combination of any two of them [22–25]:
1.
Fluoroscopy and computer tomography (CT)
2.
Positron emission tomography (PET)
3.
Single-photon emission tomography (SPECT)
4.
Gamma (γ) rays
5.
High-frequency sound waves (ultrasound)
6.
Magnetic fields (MRI) to produce images of organs and other internal structures of the body
4.5.1 Fluoroscopy
It is a dynamic X-ray imaging system that is used in radiology mainly for real-time imaging and for aligning the patient with respect to the imaging system for filming. Fluoroscopy and radiography both use X-ray radiation to image the anatomy of the body of a patient [22, 23].
Figure 4.8 shows the schematic of a typical fluoroscopy imaging system. It consists of an X-ray system with a collimator, image intensifier (Fig. 4.9), couple of lenses for focusing the images, and a video camera to record the picture of the anatomy of the body of interest. The collimator limits the size of the X-ray beam and is automatically adjusted to the proper field of view. During panning over anatomical regions, the thickness of the anatomical region changes and accordingly the source-to-detector distance is also changed. The collimator on the other hand opens or closes to accommodate the differing height of the image intensifier.
Fig. 4.8
Schematic of a fluoroscopic imaging system
Fig. 4.9
Diagram of image intensifier used in fluoroscopy imaging system
The image intensifier is the most important part of the fluoroscopy system. It is composed of four principal components, namely, the glass or metal input window, a fluorescent input screen, a high-voltage focusing electrode E 1 , and other two electrodes E 2 and E 3 leading to anode and output fluorescent screen coupled to a cine camera (Fig. 4.10) and/or a video camera. Figure 4.9 shows the diagram of an image intensifier.
Fig. 4.10
A cine camera
As the name suggests, the purpose of the image intensifier is to amplify the light signal produced by a phosphor to generate a bright X-ray image which can be viewed easily or recorded with a photographic or cine/video camera. The most important aspect of the image intensifier is that it can produce a live image in which the physicians and the radiologists can watch the dynamic changes such as ventricular contraction of the heart. Figure 4.10 shows the picture of a cine camera.
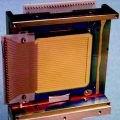
The input layer of the image intensifier consists of four layers, namely, input window, substrate, a phosphor material, and a photocathode. The photocathode is generally a combination of a thin layer of antimony (Sb) metal and alkali that releases electrons when stuck by visible light. The phosphor is, generally, a thick film with columnar cesium iodide doped with thallium (CsI:Tl) grown by vacuum evaporation on to the substrate. The columnar structure of CsI:Tl (Fig. 4.11) minimizes the internal reflection of light and thereby intensifies the number of photons received by the recording instrument [26]. The physical and chemical characteristics of the phosphors and the deposition techniques will be dealt in a separate chapter. Theoretical calculation shows that approximately 3,000 light photons (at about 420-nm wavelength) will be produced when the phosphor (CsI:Tl) is exposed to 60-keV X-ray.
During diagnosis of the anatomy of a patient, dynamic studies require a real-time imaging device capable of displaying a sequence of events with enough temporal resolution (images per second). Temporal resolution can be improved by acquiring images at a faster rate. Indeed, the live display of the X-ray image by fluoroscopic instrument made it possible to provide excellent temporal resolution [27, 28]. Dynamic studies are usually recorded on video tape recorders for playback and interpretation. In cardiology, cine camera with high-resolution film is attached to the image intensifier and record what is essentially high exposure rate onto film.
The gastrointestinal (GI) series and the barium enema are the most common fluoroscopic studies. In GI and angiographic studies, fluoroscopy is used to guide barium through the GI tract or catheters through the vascular system. In both cases, there is the intention of identifying diagnostic views for radiographic film acquisition.
The anode, a window, and a phosphor, which is small relative to the input phosphor, are placed on the output side. To maintain an equal path length between all points on the input and the output phosphors, the input phosphor/photocathode is curved, and the amount of curvature is a function of the field of view (FOV) and length of the image intensifier. In order to maintain the length of the image intensifier, minimum curvature is maximized. Unfortunately, this results in unavoidable pincushion distortion of the image. Figure 4.12 shows how the straight grid lines of the input are curved inward on the output image.
Fig. 4.12
The pincushion distortion effects
The fluoroscopic imaging system plays an important role in radiologic imaging system. Image is generally created by a series of imaging chain, which allows the adjustment of the exposure rate used in producing images, by manipulation of the aperture in the optical stage between image intensifier and TV camera.
Continuous low current in the fluoroscopic systems can acquire images 30 frames per second in 33 ms. There are three major radiography/fluoroscopy designs available in the market, namely, (a) the over-table, (b) the under-table, and (c) the single or biplanar cine fluoroscopy.
Figure 4.13a and b show the diagrams of an over-table (OT) and under-table (UT) fluoroscopy systems, respectively. These instruments are versatile in designs with remote controls and a variety of imaging systems. Beside the positions of the X-ray tubes and the source to image distances (115–150 cm in OT system and 68–98 cm in UT system), most of the facilities offered by the over-table (OT) design are available in the under-table (UT) fluoroscopy system.
Fig. 4.13
(a) An over-table fluoroscopy system and (b) an under-table fluoroscopy system (Courtesy: WIKI)
Recently, a movable C-arm design finds applications in surgery including orthopedics, bone fracture inspection, foreign body localization, and pacemaker implantation. Further, modification of the instrument which is known as double C-arm cine fluoroscopy system with horizontal and vertical image intensifiers has facilitated simultaneous viewing in two opposite planes (biplanar unit) (Fig. 4.14). The unit is used for investigating rapidly moving organs.
Fig. 4.14
(a) Mobile C-arm fluoroscopy system and (b) C-arm biplanar cine fluoroscopy system (Courtesy: Thomson Scientific, G.B.)
The maximum dose of the patient is controlled by controlling X-ray radiation and by the use of modern image intensifiers. The minimum focal spot to skin distance is also reduced to 30 cm. On the other hand, the use of large field image intensifier and high-definition video chain in the form of a plumbicon tube or CCD camera has given digital imaging technology considerable advantages to both the patient and the operator.
4.5.2 Positron Emission Tomography (PET)
PET is a nuclear medicine imaging technique, which produces a 3-D image or picture of functional processes of a body or a part of the body [29, 30]. The history of PET can be traced to the early 1950s when a group of research workers in Massachusetts first discovered the medical imaging possibilities of a class of radioactive isotopes that decay by release of a positron. By introducing a positron emission radionuclide, a biologically active molecule, into the body, image of the radionuclide (tracer) in 3-D space within the body can be reconstructed. When the biologically active molecule is fluorodeoxyglucose (FDG), concentration of the radionuclide is imaged to explore the metabolic activities of the tissue. FDG-PET scanning and imaging is widely used in clinical oncology [31]. According to some experts, PET has a millionfold sensitivity advantage over other techniques used to study tissue metabolism and neuroreceptor activity in the brain.
Figure 4.15 shows an experimental setup for positron emission tomography (PET). The picture shows how the instrument works, the scanning procedure, and how the tracer is introduced to get an image of a particular area like kidneys, lungs, heart, chest, or abdomen of a living animal. PET is a nuclear imaging tool (instrument) which produces a 3-D map of the body or a part of the body.
Fig. 4.15
Experimental setup for positron emission tomography (PET) (Courtesy of Google image from The Mesothelioma Library)
Figure 4.16 shows the medical image of the kidneys with renal arteries and renal veins. The picture has been captured by scanning positron emission tomography (PET system).
Fig. 4.16
PET imaging of human lungs (Photo courtesy of Canadian Association of Radiologists)
4.5.3 Single-Photon Emission Computed Tomography (SPECT)
The history of SPECT goes back to the 1960s when the idea of a single-photon emission imaging technology was introduced by D. E. Kuhl and R. Q. Edwards. Like PET, SPECT acquires information on the concentration of the radionuclide introduced inside the patient’s body. However, SPECT imaging involves the rotation of a photon detector array around the body to acquire data from multiple angles [32–34].
In SPECT, only a single photon is detected from the emission of the radionuclide. As a result, a special lens known as a collimator is used to acquire the image data from multiple views of the body, which caused a tremendous decrease in detection efficiency as compared to PET. In X-ray CT, scan attenuation is measured, not the transmissions source. To compensate for the attenuation experienced by emission photons from the injected tracers in the body, contemporary SPECT machines use mathematical reconstruction algorithms to increase resolution.
To acquire SPECT images, the gamma camera is rotated around the patient. Projections are acquired at defined points during rotation typically 3–6°. In most cases, a full 360° rotation is used to obtain an optimal reconstruction. The time taken to obtain each projection is variable, but 15–20 s is typical.
Although the resolution of SPECT-scanned image is not as good as PET-scanned image, the availability of new pharmaceuticals for brain and head and economic aspects has made SPECT more appealing to the medical professionals and the radiologists [35, 36].
Figure 4.17 shows the picture of a SPECT scanning machine from Siemens. The model is Symbia T-SPECT CT scanner, the first of its kind with a combination of the functional sensitivity of a SPECT system which can provide detailed anatomical information for diagnostic multi-slice CT scan.
Fig. 4.17
A SPECT (Symbia) scanning machine (Photo-courtesy: Siemens, US)
4.5.4 Magnetic Resonance Imaging (MRI)
The discovery of magnetic resonance imaging (MRI) and its development and application in modern medical imaging is one of the spectacular and successful events in medical imaging science and technology. Nuclei of the same type have different resonance frequencies depending on the chemical composition caused by typical field screening effect by the electrons in the molecule [37, 38].
In the center of the magnet, a typical symmetric field inhomogeneity is created that has a sort of three-dimensionally saddle-shaped field distribution. Then, only in the vicinity of the saddle point is the field sufficiently homogeneous to raise a measurable resonance signal. The system which is known as FONAR (field-focusing NMR) can not only perform localized measurement of resonance signals and relaxation parameters but it can also produce an image in a point by point scan when the specimen is moved [39].
The MRI is actually a map of the very weak magnetization, originated from some of the atomic nuclei in the body tissue, in the presence of an external magnetic field. Since this magnetization is proportional to the density of the nuclei, the MR image shows the distribution of the selected atoms. The magnetic resonance imaging has the capability of not only mapping the tissue density but also it can it sense alterations in the chemical structure which actually differentiate MR from other imaging techniques. The ability resides in the fact that different tissues have values of T 1 and T 2 significantly distinctly, especially between normal and cancerous tissue. Table 4.2 shows the characteristics of T 1 and T 2 times with respect to molecular motion, size, and interactions.
Table 4.2
T 1 and T 2 values for various tissues
Tissue | T 1 (0.5 T) (ms) | T 1 (1.5 T) (ms) | T 2 (ms) |
|---|---|---|---|
Fat | 210 | 260 | 80 |
Liver | 350 | 500 | 40 |
Muscle | 550 | 870 | 45 |
White matter | 500 | 780 | 90 |
Gray matter | 650 | 900 | 100 |
CSF | 1,800 | 2,400 | 160 |
The relaxation processes that T 1 and T 2 characterize depend on the size of the molecules and the tissue type constituting the spins. Emphasizing the differences of spin density (the local hydrogen concentration) as well as T 1 and T 2 relaxation, time constants of different tissues are the key to exquisite contrast sensitivity of the MRIs [40, 41].
The time to acquire (AT) an image in MRI system is equal to (time of repetition (TR)) × (phase encode steps) × (number of signal averages), and the total number of slices is equal to {(TR)}/{(TE, time of echo + K, a constant)}. The value of K is dependent on the capabilities of the instrument. Acquisition time (AT) can be shortened either by synthesizing data or by fast spin echo (FSE) technique. The first one takes advantage of the symmetry and redundancy characteristics of the frequency domain signals in k-space. The second one uses multiple phase encode steps per TR interval to speed up the data collection rate and fill k-space much faster.
Acquisition of 3-D images requires the use of broadband, nonselective radio frequency (RF) pulse to excite large volume spins simultaneously. Two-phase encode gradients are discretely applied in the slice encode and phase encode directions, before the frequency encode gradient. A 3-D FT (Fourier transform) is independently applied for each column, row, and depth axis in the image matrix cube. Volume orientation may be either isotropic or anisotropic. Isotropic orientation is preferred to anisotropic because of better resolution.
Figure 4.18 shows a magnetic resonance instrument or imaging (MRI) with a long arm for positioning the patient. MRI is an indispensable diagnostic tool because of its noninvasive, nonionizing, real-time portable and moderate-cost nature. Diagnostic usage for MRI has greatly expanded over the past couple of decades because it offers many advantages as an imaging modality.
Fig. 4.18
A magnetic resonance imaging machine (Courtesy: Siemens Med., US)
Figure 4.19 shows the magnetic resonance imaging (MRI) of knee showing different parts. MRI uses a powerful magnetic field, radio frequency pulses, and a computer to produce detailed pictures of organs like the knee bones as shown in the figure below. The images can be examined on a computer monitor, printed or copied to hardware of the computer and disk. The most important criterion of the MRI is that it does not use any ionizing radiation (X-ray) [42, 43].
Fig. 4.19
Magnetic resonance imaging of knee showing different parts (Courtesy: WIKI)
(a)
Spatial Resolution: The spatial resolution of MR image depends on the field of view (FOV), receiver coil characteristics, gradient field strength, sampling bandwidth, and image matrix. In general, MR provides almost same resolution of CT images when the contrast of image is high and the field of view is reasonably large. As a general rule, the higher the field, the better will be the resolution. Higher field strength generates a larger signal to noise ratio (SNR). At the same time, longer T 1 relaxation timing and reduced depth of RF penetration can limit the advantages of the higher field strengths in terms of spatial resolution and contrast sensitivity.
As a matter of fact, contrast sensitivity is a major attribute of MR for the discrimination of soft tissues and contrast effects due to blood flow. Higher field strength of the magnet increases the T 1 relaxation timing and decreases sensitivity.
(b)
Signal to Noise Ratio: The signal to noise ratio (SNR) of a MR image depends on the FOV, magnetic field strength, quality factor of the coil, slice thickness, image matrix, and intrinsic signal intensity. Another important parameter that affects the quality of the image is the magnetic field inhomogeneity, which ultimately causes a more rapid decay of the signal from T 2 relaxation due to dephasing effects. However, modern MRI machines are provided with self-shielded magnets, and automatic shimming has been able to minimize the field inhomogeneity artifacts.
Prior to the end of the nineteenth century, doctors lacked the ability to definitively diagnose many internal medical problems without having to cut open the patient. The invention of X-ray and its uses in medical imaging have brought obvious benefits to health care, but as with all new technologies, it also required some changes in behavior and processes. Thus, each time as the demand continues to push, the medical image processing is changing to accommodate better technology and instrumentation. The issues include cost and productivity, the need to acquire skills, radiation doses, overuse, and image quality. Moreover, some of the ethical and legal issues surrounding teleradiology remain unclear [44].
4.6 X-Ray Computed Tomography (CT)
Needless to say that medical imaging continues to empower doctors and medical professionals to view the human body with ever-increasing clarity and accuracy [44]. For example, computed tomography (CT) has all but eliminated the practice of exploratory surgery with its associated invasive risks and lengthy recovery periods. Indeed, as a result of the use of radiation, medical imaging and nuclear medicinal therapy has brought tremendous improvement in health science, saving lives of millions, especially, in the field of CT, X-ray, and nuclear medicine. The introduction of medical imaging technology, new product, and system innovations during the past 20 years has reduced radiation dose for many imaging procedures by 20–75 % while preserving the ability of imaging technologies to aid physicians in diagnosing and treating disease. These dose reductions have been achieved through innovations in product operation and design, software applications, operating practices, and procedure algorithms. Figure 4.20 shows a three-dimensional view of a human heart scanned by computed tomographic (CT) technique. Dr. D. J. Brenner and E. J. Hall from the Center for Radiological Research at Columbia University, New York, argue that the potential carcinogenic effects from using CT scans may be underestimated or overlooked. It is estimated that more than 62 million CT scans per year are currently given in the USA, compared to three million in 1980. Because CT scans result in a far larger radiation exposure compared with conventional plain X-ray, this resulted in a marked increase in the average personal exposure in the USA, which has about doubled since 1980, largely because of the increased CT usage [45]. Figure 4.20 shows a scanning image of a heart by computed tomographic (CT) technique.
Fig. 4.20
A scanning image of a heart by computed tomographic (CT) technique (Photo courtesy of D. J. Brenner and E. J. Hall, Columbia University Medical Center, New York)
In spite of criticism from different corners of the medical professionals, CT has become the forefront technology in medical imaging system because of so many innovations during its early clinical use. As a result of the invention of the CT scanner by Godfrey Hounsfield and Allan Cormack, many possibilities of X-ray imaging system have been opened up not only in medicine but also in many other industrial applications such as nondestructive testing and soil core analysis.
The CT scanner acquires a large number of CT projections around the patient that can be 800 or more. Each data point that is acquired by the detector array is a transmission measurement through the patient along a given line. During acquisition, the detector integrates attenuation information along a known path of the narrow X-ray beam. The CT projection data (P x) can be expressed mathematically as
where I 0 and I x are the intensities of X-ray without and with the object, μ is the attenuation coefficient, and x is the distance the ray has traveled.
(4.1)
The processing of the data before image reconstruction is independent of the intensity of the X-ray beam, but during actual processing step, it normalizes variations in the beam intensity and provides attenuation measurements. However, during back projection reconstruction, data from a number of different angular profiles are smeared back onto the image matrix (back-projected). As a result, areas of high and low attenuation tend to reinforce with each other, building up the image in the computer.
CT images are two-dimensional matrix numbers with different possibilities for the value of each pixel and each number corresponding to a spatial location of the image and in the patient. The numerical value of each pixel in the computer represents a certain level of gray on the CT image. Other names for the numbers that correspond to the brightness of each pixel in a CT image are Hounsfield units or CT numbers. The CT numbers for a certain pixel correlate linear attenuation coefficients, which are ultimately related to the composition and density of a material under study and can be represented mathematically as

where μ pixel is the linear attenuation coefficient for a given pixel and μ water is the attenuation coefficient in water.
(4.2)
Compton scattering is the primary type of interaction that contributes to the subject contrast in the images and depends both on the mass density (g/cm3) of the material under study as well as the number of electrons per unit mass (electrons/g and is equal to N (Z/A), where N = Avogadro’s number, Z = atomic number, and A = atomic mass). As a result, bone tissue has a higher CT number than lung tissue which is highly aerated.
The medical imaging systems and the processes have come a long way, and it is now matured. As a matter of fact, the art and the understanding of an image modality involve the appreciation of maturation of that modality. As for example, the first generation of CT scanner, which was a rotate/translate pencil beam system, had been modified in the second generation with a linear array of 30 detectors to increase the utilization of the X-ray beam by 30 times over the single detector used per slice. But soon, the difficulties like pragmatic problems with cable wear and in perfect balancing were felt with too many detectors. As a result, to ease the difficulties, the linear detector array was designed to form an arc wide enough to allow the X-ray beam to interrogate the entire patient in the third generation (Fig. 4.21).
Fig. 4.21
(a) Conventional third-generation CT scanner and (b) the multiplexing CT scanner (courtesy: J. Zang, UNC)
But soon, further modifications in the fourth-generation CT scanners were performed. Here each individual detector is responsible for acquiring a fan of transmission data, I (x), and its own reference measurement of I 0, instead of measuring them separately as in third-generation system. The CT projection value P is then calculated from the relation below:
where the gains g 1 and g 2 are taken to be equal, since I 0 and I (x) are acquired by the same detector. Therefore, the value of P is not sensitive to detector drift. However, an additional motion of detector array during CT acquisition introduces constraint to rotate the X-ray tube inside the detector ring that surrounds the patient, and this results very often magnified the focal spot.
(4.3)
Figure 4.22 shows the schematic of third- and fourth-generation scanners. Third-generation scanners require excellent detector calibration and stability, whereas the fourth generation requires excellent X-ray tube output stability. The scanners generally use solid state scintillator materials, which emit visible light when struck by X-ray. Details of the scintillator materials will be dealt in a separate chapter.
 Instrumentation and Its Applications in Nuclear Medicine
 Device Fabrication (Scintillators/Radiation Detectors)
 Theoretical Approach of Crystal and Film Growths of Materials Used in Medical Imaging System
 Characterization of Radiation Detectors (Scintillators) Used in Nuclear Medicine
 Basic Principles of Radiation Detectors
 Radiation Exposure: Consequences, Detection, and Measurements


Related posts:
Instrumentation and Its Applications in Nuclear Medicine
Device Fabrication (Scintillators/Radiation Detectors)
Theoretical Approach of Crystal and Film Growths of Materials Used in Medical Imaging System
Characterization of Radiation Detectors (Scintillators) Used in Nuclear Medicine
Radiation Exposure: Consequences, Detection, and Measurements
Stay updated, free articles. Join our Telegram channel
Full access? Get Clinical Tree
