CHAPTER EDITOR
JAMES M. PROVENZALE
HISTORY
A 21-year-old man with a sudden onset of the worst headache of his life.
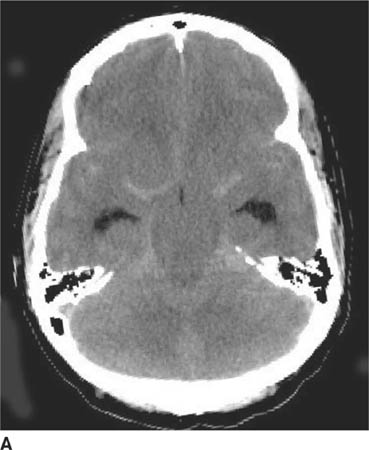
 FIGURE 6-1A Unenhanced axial CT image shows marked narrowing of the basal cisterns, hydrocephalus, and a hyperdense appearance of the subarachnoid space.
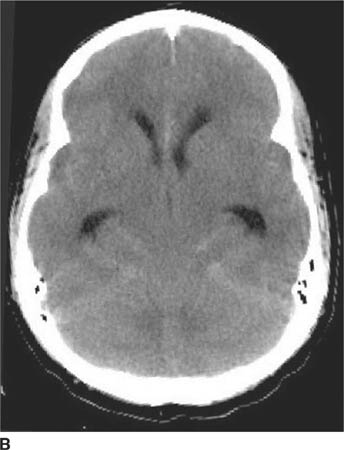
 FIGURE 6-1B Unenhanced axial CT image in the same patient as Figure 6-1A shows a rounded density in the cephalad portion of the third ventricle bordering the posteromedial aspect of the frontal horns of the lateral ventricles that is isodense with brain tissue. Figures 6-2A and 6-2B are from a different patient with the same diagnosis.
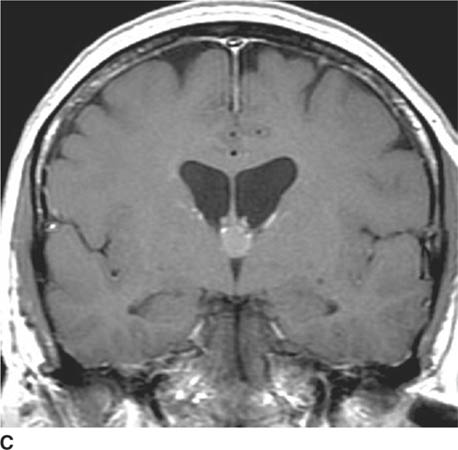
 FIGURE 6-1C Contrast-enhanced coronal T1-weighted image shows a rounded mass that abuts the fornix and is hyperintense relative to CSF. When compared to unenhanced T1-weighted images (not shown), the lesion did not contrast-enhance.
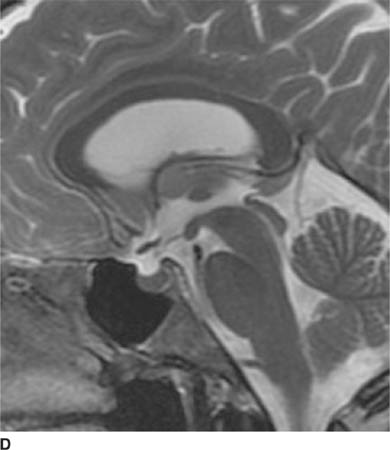
 FIGURE 6-1D Sagittal T2-weighted image shows an oval mass in the roof of the third ventricle that is relatively isointense to gray matter. The mass is located just cephalad and anterior to the (darker) massa intermedia located in the center of the third ventricle.
 Ruptured cerebral aneurysm: This diagnosis might be considered because of the oval lesion associated with hyperdensity of the subarachnoid spaces (Figures 6-1A and 6-1B), suggesting subarachnoid hemorrhage (SAH). However, Figures 6-2A and 6-2B are not typical for an aneurysm because the lesion lacks the typical appearance of a “flow void” and has a very unusual location for an aneurysm. In fact, the patient shown in Figure 6-1 does not have SAH but instead has compression of small vessels in the subarachnoid space (due to raised intra-cranial pressure associated with the hydrocephalus) mimicking SAH, a phenomenon termed “pseudo-SAH.”
 Arachnoid cyst: This diagnosis might be considered because the lesions shown are oval extraaxial lesions. However, arachnoid cysts are isodense with cerebro-spinal fluid (CSF) on CT and isointense with CSF on MRI, unlike the lesions shown, making this an incorrect diagnosis.
 Neurocysticercosis: Neurocysticercosis lesions can occur within brain ventricles and may present as a solitary lesion. However, such lesions typically have a region that is similar in appearance to CSF, not seen in this case. Nonetheless, cysticercosis remains as a diagnostic consideration.
 Dermoid cyst: This diagnosis might be considered because the lesions shown are located in the midline, typical of dermoid tumors. However, dermoid cysts are typically hypodense on CT relative to CSF due to their fat content, making this an unlikely diagnosis.
 Colloid cyst: This lesion is commonly slightly isodense or hyperdense on unenhanced CT, hyperintense to CSF on unenhanced T1-weighted MR images, and hypoin-tense on T2-weighted images. In addition, it causes obstructive hydrocephalus (as shown in this case) that may be intermittent. This diagnosis is a likely one.
DIAGNOSIS
Colloid cyst
KEY FACTS
Clinical
 A number of entities must be considered when a patient presents with the complaint of “worst headache of my life.” The differential diagnosis includes aneurysm, arterial dissection, dural sinus thrombosis (DST), spontaneous intracranial hypertension, intracranial hemorrhage, pituitary apoplexy, and colloid cyst of the third ventricle.
 Colloid cysts are benign masses that account for <1% of intracranial neoplasms.
 Colloid cysts are almost always located in the anterosu-perior portion of the third ventricle. Rarely, they can be found in other locations, such as the lateral ventricle, fourth ventricle, and brainstem.
 These lesions are usually discovered in adolescence or young adulthood. The typical presentation is that of severe headaches of short duration. The headache, which is due to intermittent obstructive hydrocephalus at the level of the foramina of Monro, is often positional (e.g., worsened by leaning forward) and can be relieved by lying down (which is unusual for headache due to intracranial tumors).
 Performance of lumbar puncture in the setting of the acute hydrocephalus caused by a colloid cyst is contra-indicated because of the possibility of cerebellar tonsil-lar herniation.
 These lesions are thin-walled, well-circumscribed, round structures with various degrees of attachment to the roof of the third ventricle.
 The exact cells of origin of colloid cysts are not well established. Some authors have suggested that colloid cysts are derived from neuroepithelium (which is the category of cells from which ependyma and cho-roid plexus develop). According to this way of thinking, the lesions are derived from the paraphysis, a stalked protuberance of extraventricular choroid plexus that is derived from the neuroepithelial lining of the roof of the diencephalon. However, other authors have found structural elements very similar to respiratory epithelium, suggesting an endodermal (rather than a neuro-epithelial) origin.
 Contents of colloid cysts include mucinous substances (including secretory products, such as fat and cholesterol crystals), hemorrhagic products, and variable types of ions, such as calcium, magnesium, and sodium.
 Currently, microsurgical techniques and endoscopic surgery are preferred by many surgeons for treatment of these lesions, rather than conventional craniotomy.
Radiologic
 On CT, colloid cysts are typically homogeneous and hyperdense relative to CSF due to their mucinous contents. Following administration of contrast material, a small amount of enhancement of the cyst capsule can occasionally be present. However, dense enhancement is not a feature of these lesions.
 Lesions can be difficult to identify on either CT or MR when the cyst is very small or when the cyst contents are not conspicuous against the background appearance of adjacent CSF.
 Variable degrees of obstructive hydrocephalus can be seen. Because the lesion is located in the anterior portion of the third ventricle, only the lateral ventricles would be expected to be enlarged.
 Calcification is rare and considered a finding that makes the diagnosis of colloid cyst less likely.
 MRI can be used for localizing the lesion to the anterior third ventricle rather than adjacent sites such as the hypothalamus, optic tract, or suprasellar cistern.
 On MRI, the cyst will almost always be seen to differ in signal intensity from CSF on one or more pulse sequences. The cysts are often hyperintense relative to CSF on T1-weighted sequences due to the mucinous contents and, possibly, presence of cholesterol crystals.
 Often, colloid cysts are hypointense to CSF on T2-weighted images, which some authors have considered to be due to paramagnetic properties of ions contained within the cyst fluid. Such lesions are difficult to identify on fluid attenuated inversion recovery (FLAIR) images against the background of hypointense CSF.
 Because in some cases colloid cysts are relatively isointense with CSF on all MR pulse sequences, the lesions occasionally are more evident on CT than on MR imaging.
 Occasionally, CSF flow artifacts in the anterior third ventricle can simulate the appearance of a colloid cyst. Careful evaluation of this region on all pulse sequences can help one avoid this pitfall.
SUGGESTED READING
Given CA, II, Burdette JH, Elster AD, Williams DW, III. Pseudo-subarach-noid hemorrhage: a potential imaging pitfall associated with diffuse cerebral edema. AJNR Am J Neuroradiol 2003;24:254–256.
Cakirer S, Karaarslan E, Arslan A. Spontaneously T1-hyperintense lesions of the brain on MRI: a pictorial review. Curr Probl Diagn Radiol 2003;32:194–217.
Grondin RT, Hader W, MacRae ME, Hamilton MG. Endoscopic versus microsurgical resection of third ventricle colloid cysts. Can J Neurol Sci 2007;34:197–207.
Spears RC. Colloid cyst headache. Curr Pain Headache Rep 2004;8: 297–300.
Armao D, Castillo M, Chen H, Kwock, L. Colloid cyst of the third ventricle: Imaging-pathologic correlation. AJNR Am J Neuroradiol 2000;21:1470–1477.
Osborn AG, Preece MT. Intracranial cysts: radiologic-pathologic correlation and imaging approach. Radiology 2006;239:650–664.
Gupta A, Nadimpalli SP, Cavallino RP. Intraventricular neurocysticercosis mimicking colloid cyst. J Neurosurg 2002;97:208–210.
JAMES M. PROVENZALE AND FERNANDO M. ZALDUONDO
HISTORY
A 26-year-old woman with acquired immunodeficiency syndrome (AIDS), headache, and confusion.
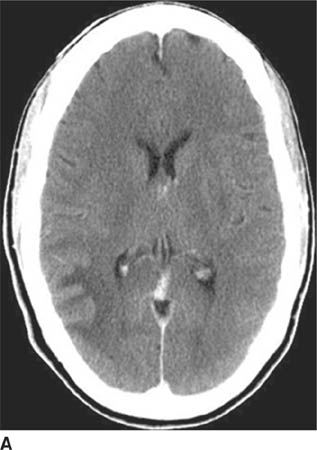
 FIGURE 6-2A Axial contrast-enhanced CT image shows an unenhancing hypodense lesion in the white matter of the posterior right temporal and occipital lobes.
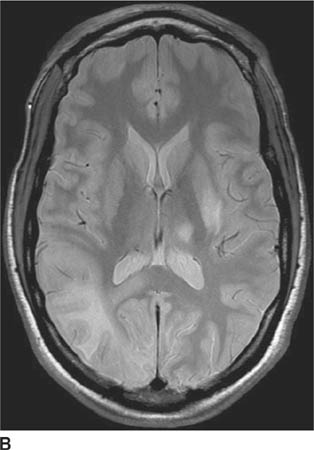
 FIGURE 6-2B Axial proton density-weighted MR image shows the right hemisphere lesion is hyperintense on this pulse sequence. Additional abnormalities are present in the left thalamus, basal ganglia and external capsule. No mass effect is present.
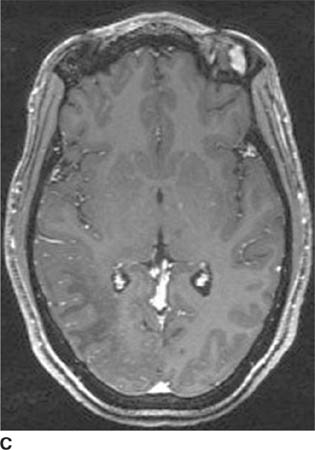
 FIGURE 6-2C Axial contrast-enhanced T1-weighted image shows the right hemisphere lesion is hypointense and does not contrast-enhance. The left basal ganglia lesion minimally contrast-enhances and the left thalamic lesion does not contrast-enhance.
 FIGURE 6-2D Axial proton density-weighted MR image shows a hyperintense lesion in the posterior left frontal lobe. On contrast-enhanced imaging (not shown), the lesion did not contrast-enhance.
 Toxoplasmosis: This diagnosis might be considered because it is common in AIDS patients. Although lesions can occur anywhere in the brain, a more central location (in the periventricular regions) is typical. Furthermore, lesions generally contrast-enhance and have edema and mass effect, making this an unlikely diagnosis.
 Lymphoma: Primary B cell central nervous system (CNS) lymphoma is also relatively common in AIDS patients. However, in the immunocompromised patient, ring-enhancement is typical and frequently accompanied by edema and mass effect. These features make lymphoma an unlikely diagnosis.
 Cryptococcosis: Cryptococcal infection is common in AIDS patients and can have a number of radiologic appearances: meningeal enhancement (due to meningitis), nonenhancing (or rim-enhancing) masses typically occurring in the basal ganglia (so-called gelatinous pseudocysts), ring-enhancing parenchymal masses (cryptococcomas), and intraventricular masses. Unen-hancing lesions lacking mass effect would be distinctly unusual.
 Infarction: Infarcts commonly occur in the periphery of the brain, usually in the setting of embolic infarction. However, the extent of these lesions—that is, abrupt termination at the gray-white junction with sparing of the cortex (as opposed to involvement of both gray matter and white matter)—would be very unusual for infarction. This is an unlikely diagnosis.
 Progressive multifocal leukoencephalopathy (PML): The typical appearance of PML is that of one or more nonenhancing white matter lesions lacking mass effect in an immunocompromised host. This is the correct diagnosis.
DIAGNOSIS
Progressive multifocal leukoencephalopathy
KEY FACTS
Clinical
 PML is due to an infection caused by the human papo-vavirus (also known as the JC virus, the initials of the patient in whom it was first described). Asymptomatic infection likely occurs early in life in many individuals but remains latent until reactivated by acquisition of an immunodeficient state.
 The JC virus can be detected by polymerase chain reaction testing of the CSF.
 This infection occurs primarily in immunocompromised patients. It occurs in 1% to 4% of adult AIDS patients but is extremely rare in children. Organ transplant recipients are another non-AIDS group at increased risk of acquiring the infection.
 Symptoms include visual deficits and cranial nerve palsy, focal neurologic deficits such as motor weakness and sensory loss, and nonfocal neurologic symptoms—for example, encephalopathy or headache.
 Prognosis is generally very poor with a mean survival of only a few months after diagnosis. However, recently, administration of highly active antiretroviral therapy has shown some promise of relatively longer survival in AIDS-related PML.
Radiologic
 On CT, lesions are typically seen as unenhancing, hypodense white matter lesions lacking mass effect. MRI is superior to CT in displaying the number and size of lesions.
 On T2-weighted and FLAIR images, lesions are hyper-intense; they are hypointense on T1-weighted images. With disease progression, lesions become more hypoin-tense on T1-weighted images: particularly, aggressive infection may be indicated by markedly low signal intensity.
 Lesions are frequently bilateral but distributed in an asymmetric manner between the hemispheres. The posterior centrum semiovale is the most common location.
 White matter lesions in PML have been reported to start subcortically before extending into the deep white matter; this feature is considered by some as a feature distinguishing PML from HIV encephalitis.
 External capsule and posterior fossa involvement is less common but can occur even in the absence of centrum semiovale lesions.
 The absence of mass effect and contrast-enhancement is a characteristic feature. Faint peripheral enhancement can rarely be seen. Nonetheless, the lack of contrast-enhancement and mass effect is a useful finding in distinguishing PML from other AIDS-related lesions.
 Cavitary changes can be seen as a late manifestation of PML.
 On diffusion-weighted images, hyperintense signal consistent with restricted diffusion can be seen in acute lesions. Some lesions have both restricted diffusion at the periphery (possibly representing acute demyelin-ation) and elevated diffusion centrally.
SUGGESTED READING
Hurley RA, Ernst T, Khalili K, et al. Identification of HIV-associated progressive multifocal leukoencephalopathy: magnetic resonance imaging and spectroscopy. J Neuropsychiatry Clin Neurosci 2003;15:1–6.
Thurnher M, Donovan Post J, Rieger A, et al. Initial and follow-up MR imaging findings in AIDS-related progressive multifocal leukoencephalopathy treated with highly active antiretroviral therapy. AJNR 2001; 22:977–984.
Bergui M, Bradac GB, Oguz KK, et al. Progressive multifocal leukoenceph-alopathy: diffusion-weighted imaging and pathological correlations. Neuroradiology 2004;46:22–25.
Donovan Post MJD, Yiannoutsos C, Simpson D, et al. Progressive multifocal leukoencephalopathy in AIDS: are there any MR findings useful to patient management and predictive of patient survival? AJNR Am J Neuroradiol 1999;20:1896–1906.
JAMES M. PROVENZALE
HISTORY
A 16-year-old boy with lethargy, confusion, and increasing thirst and urination.
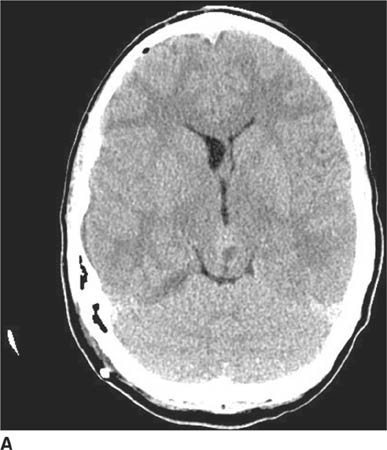
 FIGURE 6-3A Unenhanced axial CT image shows an inhomogeneous mass projected over the back of the midbrain. The lesion is actually within the pineal recess.
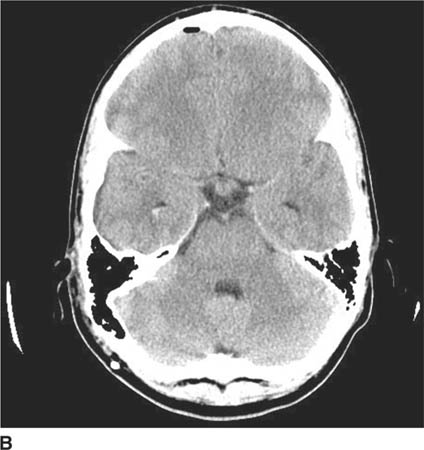
 FIGURE 6-3B Image at a more caudal level from the same unenhanced CT shows a smaller mass in the suprasellar cistern.
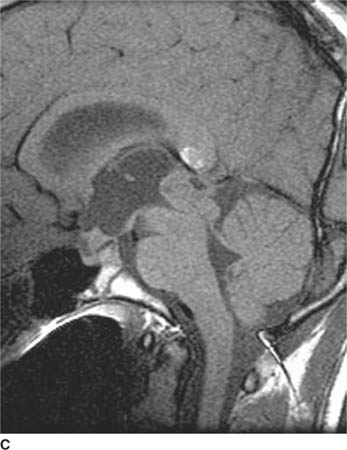
 FIGURE 6-3C Unenhanced sagittal T1-weighted image shows an inhomogeneous mass within the pineal recess with associated enlargement of the third ventricle due to obstructive hydrocephalus. Another mass is seen in the suprasellar cistern. The hyperintense signal within the splenium of the corpus callosum is due to the presence of an incidental lipoma that bears no relationship to the pineal recess mass.
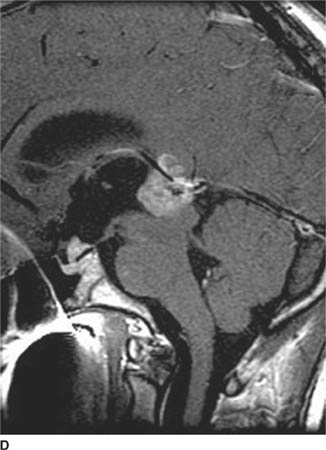
 FIGURE 6-3D Contrast-enhanced sagittal T1-weighted image shows that both the pineal recess and suprasellar cistern masses contrast-enhance.
 Primary CNS lymphoma: Lymphoma is a consideration because this tumor can occur in an extraaxial location in adults and children. Although synchronous lymphoma lesions in the pineal and suprasellar cisterns could theoretically be seen, this event would be very rare making this diagnosis unlikely.
 Pineoblastoma: This tumor is a consideration when a pineal region tumor is seen in a child. However, this diagnosis would not account for the suprasellar mass; this diagnosis is unlikely.
 Germinoma: These tumors are one of the more common intracranial tumors of childhood and are located in the pineal or suprasellar region in 95% of cases. Synchronous tumors in both the pineal and suprasellar recesses are seen in about 5% of cases, which is a very rare phenomenon in other types of mass lesions. This diagnosis is correct.
 Metastases: Intracranial metastases are uncommon in childhood. The majority of intracranial tumors are primary in origin. Furthermore, metastases are usually intraaxial in location, unlike the extraaxial lesions shown in the case illustrated, making metastases an unlikely diagnosis.
 Eosinophilic Granuloma: Intracranial lesions commonly involve the pituitary stalk and are, thus, in the suprasellar region. However, this diagnosis would not account for the synchronous pineal recess mass. This diagnosis is unlikely.
DIAGNOSIS
Germinoma
KEY FACTS
Clinical
 Germ cell tumors (GCTs) are an important category of pediatric brain tumors. The vast majority of GCTs occur in an extracranial site and do not involve the CNS.
 Intracranial GCTs typically present in the second (70%) or third decades, possibly due to increased gonadotro-pin secretion during puberty.
 Symptoms depend on tumor location: Suprasellar GCTs typically present with neuroendocrine dysfunction, visual symptoms, or headache; pineal region GCTs present with features of elevated intracranial pressure or Parinaud’s syndrome (failure of upward gaze and retractory nystagmus).
 The increased thirst and urination of the patient here was due to diabetes insipidus related to the suprasel-lar lesion. When synchronous suprasellar and pineal recess lesions are present, symptoms are usually due to the suprasellar tumor.
 Two major forms of GCTs are recognized: germinomas and nongerminomatous GCTs. Germinomas are the least malignant type of GCTs. The spectrum of non-germinomatous GCTs includes embryonal carcinoma, endodermal sinus tumor, benign or malignant terato-mas, and choriocarcinoma—all are more malignant than germinomas.
 GCTs account for 1% to 3% of pediatric brain tumors in the Western hemisphere, but they are reported to be more common in Japan, where they comprise 5% to 15%.
 Ninety-five percent of intracranial GCTs are located in the midline, along an axis from the suprasellar cistern to the pineal gland. About 55% solely involve the pineal region, 35% involve the suprasellar region, and 5% to 10% involve both locations (as in the case illustrated here).
 About 70% of GCTs in the suprasellar region are germinomas. Conversely, 65% of GCTs in the pineal region are of the nongerminomatous type. Ninety percent of germinomas occur in patients younger than 20 years of age.
 Pineal region GCTs do not arise from the pineal gland itself but from rest of embryonic germ cells.
 Suprasellar GCTs are equally frequent in males and females, but the ratio of males to females with pineal GCTs is about 10 to 1.
 Visual disturbance and neuroendocrine dysfunction are common clinical presentations of suprasellar germinomas. Pineal germinomas often present with obstructive hydrocephalus.
 Germinomas infiltrate locally and also frequently disseminate along CSF pathways; spinal imaging is an important component of evaluation of tumor progression.
 Germinomas are very radiosensitive tumors, usually rapidly shrinking within a few months of beginning radiation therapy. Nongerminomatous GCTs respond poorly to radiotherapy but are sometimes sensitive to chemotherapy.
 Overall prognosis for GCTs depends on patient age, tumor type, and tumor location. Patients <15 years at the time of diagnosis have a better 10-year survival rate (90%) than older patients (50%). The prognosis for suprasellar germinomas (90% survival at 10 years) is much better than for pineal germinomas.
 Prognosis for nongerminomatous GCTs is generally poor, with about a 50% 1-year survival rate.
 On rare occasions, germinomas may arise in sites that are not in a midline location, such as the basal ganglia, internal capsule, and thalamus.
Radiologic
 Ideally, it would be helpful to distinguish, based on imaging studies, tumors arising from the pineal gland (e.g., pineoblastomas and pineocytomas) from those arising from nonpineal tissue (e.g., GCTs) by identification of the pineal gland as a separate structure. Unfortunately, the pineal gland is almost never seen as a structure separate from a pineal region tumor.
 The typical appearance of intracranial germinomas on unenhanced CT is that of a relatively homogeneous, mildly or moderately hyperdense mass that densely enhances after contrast administration.
 On unenhanced MRI, the solid portions of germinomas are generally isointense to gray matter on T1-weighted images and often isointense (and less commonly hyper-intense) to gray matter on T2-weighted images.
 About one-half of germinomas have cystic components, as compared to approximately 85% to 95% of nonger-minomatous GCTs.
 In reported series, germinomas have been found to homogeneously contrast-enhance in 50% to 90% of cases, whereas nongerminomatous GCTs almost always enhance in an inhomogeneous manner.
 Small suprasellar germinomas may initially be seen on imaging studies as solely thickening of the infundibulum.
 Nongerminomatous GCTs frequently have hyperintense foci on unenhanced T1-weighted images due to the presence of hemorrhage, fat, or proteinaceous fluid.
 The finding of synchronous tumors both having a hyper-dense appearance on unenhanced CT (as shown in the case above) is highly suggestive of the diagnosis of germinoma. Although only 5% of germinomas are found in both regions, no other tumor would be expected to be located at both sites and have this CT appearance.
 Brain imaging studies of patients with GCTs must be assessed for tumor extension into adjacent intracranial structures as well as dissemination throughout intracra-nial CSF spaces. Spinal imaging is usually indicated to exclude spinal metastases, seen in about 10% of cases.
 Determination of hormonal tumor markers in CSF is sometimes useful in attempting to establish the diagnosis of nongerminomatous GCTs. Alpha-fetoprotein is often secreted by endodermal sinus tumors, human chorionic gonadotropin (HCG) by choriocarcinomas, and both markers by embryonal carcinomas. However, elevated CSF HCG levels can also be seen occasionally with germinomas.
SUGGESTED READING
Liang L, Korogi Y, Suguhara T, et al. MRI of intracranial germ-cell tumors. Neuroradiology 2004;44:382–388.
Banks KP, Brown SJ. AJR teaching file: solid masses of the pineal region. AJR Am J Roentgenol 2006;186:S233–S235.
Rao VJ, James RA, Mitra D. Imaging characteristics of common suprasellar lesions with emphasis on MRI findings. Clin Radiol 2008;63:939–947.
Kanagaki M, Miki Y, Takahashi JA, et al. MRI and CT findings of neurohypophyseal germinoma. Eur J Radiol 2004;49:204–211.
Warmuth-Metz M, Gnekow AK, Muller H, Solymosi L. Differential diagnosis of suprasellar tumors in children. Klinische Padiatrie 2004;216: 323–330.
Lee L, Saran F, Hargrave D, et al. Germinoma with synchronous lesions in the pineal and suprasellar regions. Childs Nerv Syst 2006;22: 1513–1518.
Osuka S, Tsuboi K, Takano S, et al. Long-term outcome of patients with intracranial germinoma. J Neurooncol 2007;83:71–79.
E. RALPH HEINZ AND JAMES PROVENZALE
HISTORY
A 40-year-old man with radicular pain in the left arm and mild spasticity in the legs.
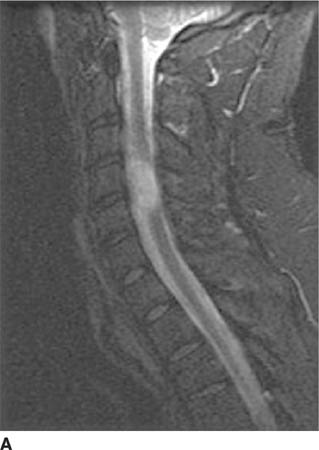
 FIGURE 6-4A Sagittal T2-weighted image shows a hyperin-tense oval mass adjacent to the cervical segment of the spinal cord.
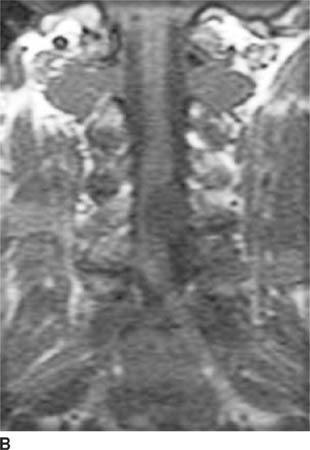
 FIGURE 6-4B Coronal unenhanced T1-weighted image shows that the mass is hypointense on this pulse sequence. A sharp line of demarcation exists between the mass and the spinal cord; the mass is eccentric to the left.
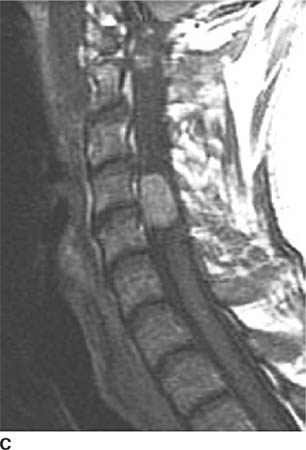
 FIGURE 6-4C On this sagittal contrast-enhanced T1-weighted image, the mass densely and homogeneously contrast-enhances.
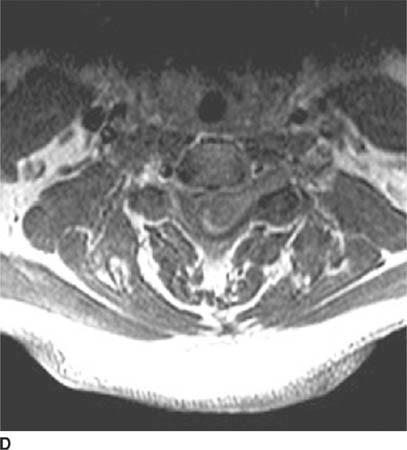
 FIGURE 6-4D Axial contrast-enhanced T1-weighted image shows that the mass extends into the left neural foramen at this level.
 Meningioma: This is a possible consideration because the lesion shown in this case is extramedullary. Meningioma cannot be definitively excluded on the basis of the images shown. However, spinal meningiomas typically occur in patients older than the man depicted here. Furthermore, extension into the neural foramen, which is shown in Figure 6-4D, is more common in nerve sheath tumors than in meningiomas. This diagnosis is less likely than nerve sheath tumor.
 Drop metastases: Solitary CSF metastases along the proximal nerve root can be seen occasionally but are rare. In the absence of any other likely cause, this consideration could be essentially excluded by imaging the remainder of the CNS.
 Plexiform neurofibroma: These tumors appear as multiple, tortuous, worm-like masses arising along the axis of a major nerve—unlike the solitary, smoothly marginated mass seen in this case—making this an unlikely diagnosis.
 Nerve sheath tumor: These lesions are typically smoothly contoured masses that are located within the spinal canal and frequently extend into the neural foramen. These characteristics make this diagnosis the most likely consideration.
DIAGNOSIS
Nerve sheath tumor (schwannoma)
KEY FACTS
Clinical
 Schwannoma, neurinoma, and neurilemmoma are synonymous terms used to refer to Schwann cell tumors.
 Schwannomas and neurofibromas are collectively referred to as nerve sheath tumors but are different pathologic entities.
 Nerve root schwannomas do not encase the adjacent nerve root, usually involve the dorsal (sensory) root, are typically solitary, and are not associated with neurofibromatosis. In contrast, neurofibromas encase the dorsal nerve root, are usually multiple, and are frequently associated with neurofibromatosis, even when solitary.
 Nerve sheath tumors are often associated with radicular pain or motor dysfunction related to a specific nerve root.
 Nerve sheath tumors are found most frequently in the cervical region and usually located in the extramed-ullary intradural compartment (about 60% of cases), but they are extradural in 25% of cases, and both extra- and intradural (in which case they often assume a dumbbell configuration) in 15% of cases. Rarely, these tumors can be intramedullary.
 Nerve sheath tumors can undergo malignant degeneration (seen in 5% to 10% of cases), usually after a latency period of 10 to 20 years. Thus, malignant degeneration would typically be seen in the third or fourth decade of life.
Radiologic
 From an imaging standpoint, schwannomas and neuro-fibromas resemble one another very closely. However, distinction of the two entities on imaging studies is usually not an important issue. For these reasons, they are generally reported on imaging studies simply as nerve sheath tumors.
 One feature that can occasionally be used to distinguish schwannomas from neurofibromas is the asymmetric location of schwannomas. Because schwannomas arise from one side of the nerve root, they displace and efface the normal nerve. They appear lobulated and eccentric, whereas neurofibromas typically have a fusiform shape.
 Nerve sheath tumors generally cause widening of the neural foramina. In the setting of neurofibromatosis, they can be associated with posterior scalloping of the vertebral bodies due to dural ectasia.
 Nerve sheath tumors can have increased signal on unenhanced T1-weighted images (probably related to mucopolysaccharide content). Furthermore, these lesions densely contrast-enhancement. Usually, markedly increased signal is seen on T2-weighted images (due to high water content). Many neurofibromas have central areas of low signal on T2-weighted images.
 Differential diagnosis of benign versus malignant: On CT and MRI, malignant nerve sheath tumors usually have irregular, infiltrative margins, whereas benign nerve sheath tumors usually have smooth margins. In addition, malignant nerve sheath tumors are typically larger than benign lesions.
SUGGESTED READING
Conti P, Pansini G, Mouchaty H, et al. Spinal neurinomas: Retrospective analysis and long-term outcome of 179 consecutively operated cases and review of the literature. Surg Neurol 2004;61:34–43.
Liu WC, Choi G, Lee SH, et al. Radiological findings of spinal schwannomas and meningiomas: focus on discrimination of two disease entities. Eur Radiol 2009;19:2707–2715.
Parmar HA, Ibrahim M, Castillo M, Mukherji SK. Pictorial essay: diverse imaging features of spinal schwannomas. J Comput Assist Tomogr 2007;31:329–334.
JAMES PROVENZALE AND DAVID S. ENTERLINE
HISTORY
A 17-year-old girl with headache.
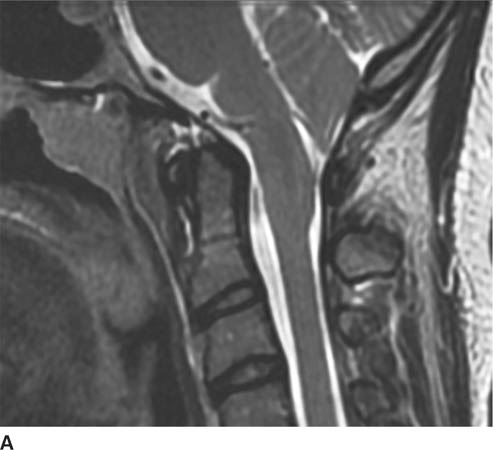
 FIGURE 6-5A Sagittal T2-weighted image shows downward displacement of the cerebellar tonsils. The tonsils were measured to be 10 mm below the level of the foramen magnum.
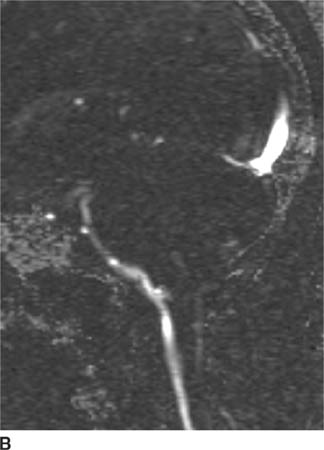
 FIGURE 6-5B Image from cine MR CSF flow study shows bright signal consistent with CSF flow anterior to the brainstem but no flow posterior to the cerebellar tonsils.
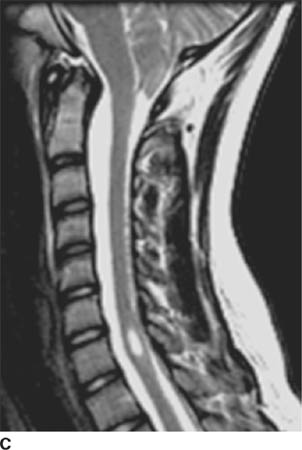
 FIGURE 6-5C Sagittal T2-weighted image in a different patient shows downward displacement of the cerebellar tonsils and a syrinx cavity in the lower cervical spinal cord.
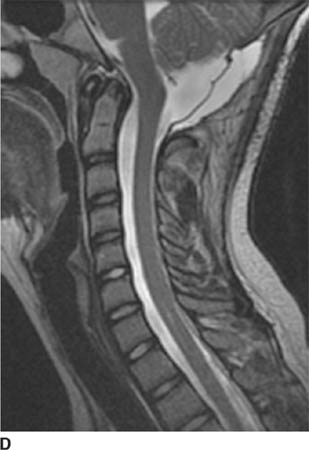
 FIGURE 6-5D Sagittal T2-weighted image in the same patient as in Figure 6-5C after surgical decompression of the posterior fossa and C1 laminectomy now shows a widened CSF space at the base of skull and near-complete resolution of the syrinx cavity.
 Chiari I malformation: This congenital malformation is characterized by downward displacement of the cer-ebellar tonsils through the foramen magnum, which is present in the case depicted here. The images shown here indicate an abnormality within the spinal cord that is isointense to spinal fluid on all pulse sequences, representing syringohydromyelia, which is commonly seen in patients with Chiari I malformation. These findings make Chiari I malformation the most likely diagnosis.
 Chiari II: This entity might be considered because of the downward herniation of cerebellar tissue. However, other manifestations of Chiari II—for example, medullary kinking, tectal “beaking”, a towering cerebellum, hydrocephalus, and myelomeningocele—are absent, making this diagnosis incorrect.
 Chiari III malformation: In this malformation, hernia-tion of the hindbrain into a low occipital or high cervical encephalocele is seen, often in association with aplasia of the posterior elements of the three highest cervical vertebral bodies. The absence of any of these features excludes this diagnosis in the case shown.
 Other causes of cerebellar tonsillar herniation: A posterior fossa mass can cause downward herniation of the cerebellar tonsils. Developmental disorders involving the craniovertebral junction (e.g., basilar impression or cranial settling) due to a variety of conditions (e.g., Paget’s disease and rheumatoid arthritis) can also cause an abnormal relationship of the cerebellar tonsils to the foramen magnum. None of these conditions is present in the case shown.
DIAGNOSIS
Chiari I malformation
KEY FACTS
Clinical
 Congenital hindbrain dysgenesis characterized by downward herniation of the cerebellar tonsils was described in 1891 by Hans Chiari. In Chiari I malformation, downward herniation of the cerebellar tonsils into the spinal canal is present; the fourth ventricle and cerebellar vermis remain in a relatively normal position, except in severe cases.
 This malformation is has been thought by some investigators to result from a dysplasia of bone at the cranio-cervical junction.
 In about half of cases diagnosed by MR imaging, the findings are incidental and unrelated to symptoms. In some series, the degree of tonsillar displacement in asymptomatic patients has been shown to be similar to that seen in symptomatic patients.
 Most patients with incidentally-discovered downward displacement of the cerebellar tonsils do not have a syrinx and do not develop symptoms; such patients are not treated surgically.
 Patients with Chiari I malformation typically are first diagnosed in young adulthood. Almost all symptomatic patients have at least 5 mm of cerebellar herniation. Symptoms and signs can be on the basis of either compression of the cervicomedullary junction or syringohydromyelia (which is often accompanied by widening of the spinal cord).
 The most common clinical features are hypesthesia (decreased sensation) and weakness in the extremities (about 50%) due to syringohydromyelia, headaches, cranial neuropathy, and upper motor neuron corticospinal tract findings (e.g., gait disturbance, spas-ticity, and bowel and bladder dysfunction).
 Scoliosis is common in children with Chiari malformation and syringomyelia.
 Treatment usually consists of posterior decompression of the cervicomedullary junction by suboccipital decompression of the foramen magnum and cervical laminec-tomy to the most caudal level of the tonsillar herniation (Figure 6-2B). Some surgeons will place a shunt tube through the foramen of Magendie into the fourth ventricle. In addition, treatment of syringohydromyelia can be performed by decompression and, on occasion, shunting.
 Following posterior fossa decompression, the diameter of the syrinx cavity typically substantially diminishes within a few months and may continue for a few years (Figure 6-2B).
Radiologic
 The diagnosis is made by measuring the displacement of the tonsils below a line from the basion (anterior lip of foramen magnum) to the opisthion (posterior lip of the foramen magnum). The normal position of the tonsils varies with age. Tonsillar herniation is present when the tonsils are >6 mm (in children <10 years), 5 mm (age 11 to 30), or 4 mm (age 31 to 80) below this line. Most patients present in late childhood or early adulthood—hence, the usual criterion of 5 mm. The cerebellar tonsils are considered low-lying (rather than herniated) when 3 to 5 mm of inferior displacement is present in an adult 30-years old or younger.
 The peg-like configuration of the cerebellar tonsils narrows the posterior CSF space at the level of the foramen magnum, altering the CSF flow dynamics. This may be shown by cine MR flow techniques by diminished flow posterior to the cerebellar tonsils (Figure 6-5B).
 Hydrocephalus is seen in 20% to 25% of Chiari I malformation patients.
 Compression of the brainstem and upper cervical spinal cord may be an important cause of symptoms. Arachnoid adhesions may develop due to repeated trauma of the cerebellum, further compromising CSF flow.
 Syringohydromyelia has been reported in up to 60% to 70% of patients, usually in symptomatic patients. This condition is more appropriately termed hydromyelia because the CSF-filled cavity develops in the ependyma-lined central canal.
 Basilar invagination, i.e., extension of the tip of the odontoid process >5 mm above Chamberlain’s line (a line drawn from the posterior margin of the hard palate to the posterior aspect of the foramen magnum), is reportedly seen in about 25% of Chiari I malformation patients.
 Skeletal anomalies are common in Chiari I malformation and include assimilation of C1 to the occiput (10%), partial nonsegmentation of C2 and C3 (15%), and Klippel-Feil deformity (5%).
SUGGESTED READING
Novegno F, Caldarelli M, Massa A, et al. The natural history of the Chiari Type I anomaly. J Neurosurg: Pediatrics 2008;2:179–187.
Arnett BC. Tonsillar ectopia and headaches. Neurol Clin North Am 2004;22:229–236.
Hofkes SK, Iskandar BJ, Turski PA, et al. Differentiation between symptomatic Chiari I malformation and asymptomatic tonsillar ectopia by using cerebrospinal fluid flow imaging: initial estimate of imaging accuracy. Radiology 2007;245:532–540.
Wetjen NM, Heiss JD, Oldfield EH. Time course of syringomyelia resolution following decompression of Chiari malformation Type I. J Neurosurg Pediatr 2008;1:118–123.
FERNANDO M. ZALDUONDO AND JAMES M. PROVENZALE
HISTORY
A 31-year-old man who developed proptosis and chemosis (i.e., red eye) of the left eye and a left orbital bruit 2 days after head trauma incurred during a motor vehicle accident.
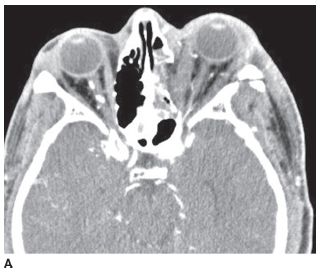
 FIGURE 6-6A Axial contrast-enhanced CT shows proptosis of the left eye and a fracture of the lateral wall of the left orbit. The left medial rectus and lateral rectus muscles are expanded compared to their counterparts in the right orbit.
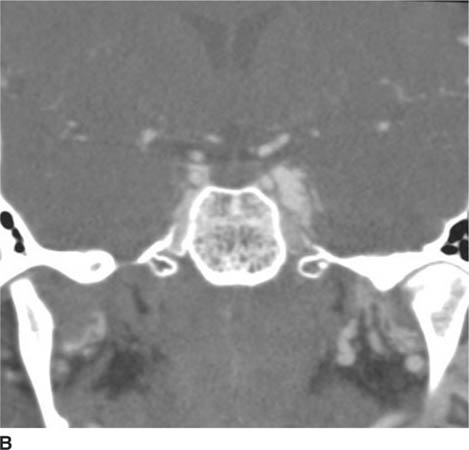
 FIGURE 6-6B Coronal reconstruction image from CT angiogram shows dilation of the left cavernous sinus.
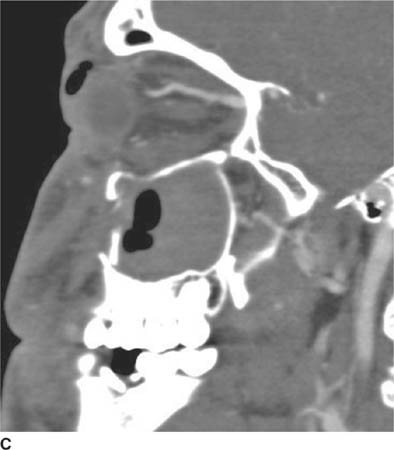
 FIGURE 6-6C Image from CT angiogram reconstructed in the left parasagittal plane shows dilation of the superior ophthalmic vein.
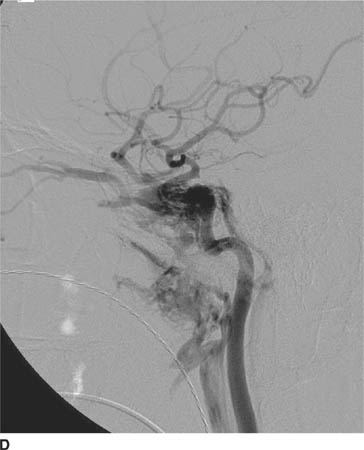
 FIGURE 6-6D Lateral view from catheter angiogram, left ICA injection shows early opacification of the cavernous sinus, which is enlarged. Venous drainage from the cavernous sinus is via a dilated superior ophthalmic vein in a retrograde fashion, which is responsible for the patient’s presenting symptoms of proptosis and chemosis. Venous drainage inferiorly is via the inferior petrosal sinus posteriorly and the pterygoid plexus anteriorly.
 Orbital pseudotumor: This diagnosis would not account for a number of features in the case shown—for example, orbital bruit, dilatation of the superior ophthalmic vein, and abnormal communication between the internal carotid artery (ICA) and superior ophthalmic vein. This diagnosis, therefore, is unlikely.
 Thyroid orbitopathy (Graves’ disease): This diagnosis might be considered because of the proptosis and extraocular muscle enlargement. However, involvement of both orbits is typical, and patients are usually much older than in the case presented. Furthermore, Graves’ disease would not account for the dilated cavernous sinus and superior ophthalmic vein or the angi-ographic findings. This diagnosis is incorrect.
 Carotid-cavernous fistula (CCF): Patients with this diagnosis typically present with orbital pain, proptosis, and a bruit. Imaging findings can include dilation of the SOV and widening of the cavernous sinus. This is the correct diagnosis.
DIAGNOSIS
Carotid-cavernous fistula
KEY FACTS
Clinical
 The term “carotid-cavernous fistula” (CCF) refers to an abnormal communication between the carotid artery and one or more veins in the cavernous sinus. Because arterial pressure is standardly higher than venous pressure, a CCF can produce a marked increase in the veins of the cavernous sinus, often causing dilation of the sinus and enlargement of draining veins.
 CCFs can occur following trauma or spontaneously (i.e., in the absence of trauma). The inciting traumatic event may be penetrating in nature (e.g., a missile injury) or blunt (e.g., producing basal skull fracture at or near the cavernous sinus). The cause of spontaneous direct CCFs is usually not known but in a small percentage of cases is due to rupture of an aneurysm in the cavernous segment of the ICA.
 Symptoms due to traumatic CCFs can begin within days of the injury but may be delayed by a matter of weeks. Symptoms due to spontaneous CCFs are typically slow in onset, often taking many weeks or a few months to develop.
 Clinical features of CCF depend on the predominant route of venous drainage. When the majority of the venous drainage is into the superior ophthalmic and inferior ophthalmic veins, the primary symptoms are related to the orbit, such as ocular chemosis, propto-sis (secondary to venous congestion), glaucoma, and, occasionally, unilateral visual loss. Alternatively, when the bulk of the venous drainage is into the superior, inferior, and petrosal sinuses, or when the cavernous sinus becomes greatly distended, a cavernous sinus syndrome consisting of ophthalmoplegia and facial pain can occur.
 CCFs are best classified by the nature of the arteriove-nous connection, which is either direct or indirect.
 Direct CCFs are due to a direct connection between the ICA and the veins of the cavernous sinus. Etiologies include (1) trauma, (2) rupture of an intracavern-ous ICA aneurysm, and (3) a fistulous communication due to an underlying vasculopathy (e.g., Ehlers-Danlos syndrome).
 Traumatic CCFs frequently follow skull base fracture or penetrating injuries but can be iatrogenic (e.g., after surgery at sites near the cavernous sinus, such as sphenoidotomy or trigeminal rhizotomy). These lesions are often high flow conduits between the arterial and venous circulation.
 Indirect CCFs are typically spontaneous and caused by development of multiple fistulous communications between dural branches of the carotid circulation and the cavernous sinus. The volume of blood shunted in indirect CCFs is usually much smaller than in direct CCFs.
 CCFs sometimes involve both cavernous sinuses (and hence both orbits) because communication between the cavernous sinuses is allowed by the circular sinus, the collective term for the anterior and posterior intercav-ernous sinuses that variably connect both cavernous sinuses.
 Complications requiring emergency treatment are (1) rapid progression of proptosis or visual loss and (2) development of increased intracranial pressure (due to cortical venous hypertension, caused by diversion of blood flow into cortical veins) and intraparenchymal hemorrhage or SAH (following rupture of a large cavernous sinus varix or congested cortical vein).
 A classification system has been proposed based on the source of arterial supply to the fistulae: Type A is a direct communication between the ICA and the cavernous sinus; types B, C, and D are forms of indirect fistula. Type B is supplied solely by dural branches of the ICA, type C is supplied solely by dural branches of the external carotid artery (ECA) and type D is supplied by dural branches of both the ICA and ECA.
 Type A (i.e., direct) fistulas are standardly treated by endovascular therapy. Endovascular coiling via a trans-venous route is usually the first line treatment for a type A (direct) CCF. One preferred method is to begin coil placement at the base of the superior ophthalmic vein and then continue posteriorly past the lumen of the fistula and then into the cavernous sinus.
 Conservative treatment of patients with indirect CCFs and mild symptoms is often attempted by frequent, self-administered external compression of the carotid artery and jugular vein for many minutes at a time. However, most patients need invasive treatment.
Radiologic
 Major findings on CT and MRI include extraocular muscle enlargement, proptosis, and dilation of the ipsilat-eral cavernous sinus and SOV.
 The diagnosis of CCF can be made noninvasively using CT angiography and MR angiography by showing enlargement of the cavernous sinus and its veins, as well as reversal of flow in the SOV (e.g., on phase-contrast MR angiography).
 CT angiography and MR angiography are unable to show the specific site of the fistula. For this purpose, as well as for showing the exact arterial supply (needed for planning endovascular therapy), catheter angiography is necessary. In many centers, a 3D catheter angiogra-phy, which allows reconstructed images of the vascular anatomy to be rotated in space as well as endoluminal (i.e., virtual endoscopic) images to be obtained, is used.
 Catheter angiography findings include early opacification of the cavernous sinus, poor opacification of the ICA distal to the fistula, and retrograde filling of dilated venous tributaries.
 Endovascular therapy with preservation of distal ICA flow is the standard first-line therapy. Therapeutic options for direct CCFs include detachable balloons or detachable coils alone or in combination with N-butyl-2-cyanoac-rylate (n-BCA) for large-hole fistulas (e.g., direct CCFs). More recently, covered stents have been used to maintain arterial patency while occluding the fistula. Embolic agents such as isobutyl-2-cyanoacrylate or polyvinyl-alcohol particles are used for indirect CCFs. Surgery is reserved for cases that fail endovascular therapy.
SUGGESTED READING
Coskun O, Hamon M, Catroux G, et al. Carotid-cavernous fistula: Diagnosis with spiral CT angiography. AJNR Am J Neuroradiol 2000;21:712–716.
Chen CC, Chang PCT, Shy GC, et al. CT Angiography and MR angiography in the evaluation of carotid cavernous sinus fistula prior to embolization: a comparison of techniques. AJNR Am J Neuroradiol 2005;26: 2349–2356.
Gemmete JJ, Chaudhary N, Pandey A, Ansari S. Treatment of carotid cavernous fistulas. Curr Treat Options Neurol 2010;12:43–53.
Gomez F, Escobar W, Gomez AM, et al. Treatment of carotid cavernous fistulas using covered stents: midterm results in seven patients. AJNR Am J Neuroradiol 2007;28:1762–1768.
van Rooij WJ, Sluzewski M, Beute GN. Ruptured cavernous sinus aneurysms causing carotid cavernous fistula: Incidence, clinical presentation, treatment, and outcome. AJNR Am J Neuroradiol 2006;27:185–189.
Moron FE, Klucznik RP, Mawad ME, Strother CM. Endovascular treatment of high-flow carotid cavernous fistulas by stent-assisted coil placement. AJNR Am J Neuroradiol 2005;26:1399–1404.
JOSEPH B. CORNETT AND JAMES M. PROVENZALE
HISTORY
Images from two patients are shown. Figures 6-7A and 6-7B show a 72-year-old woman with proptosis and Figures 7-7C and 7-7D show a 58-year-old woman with proptosis.
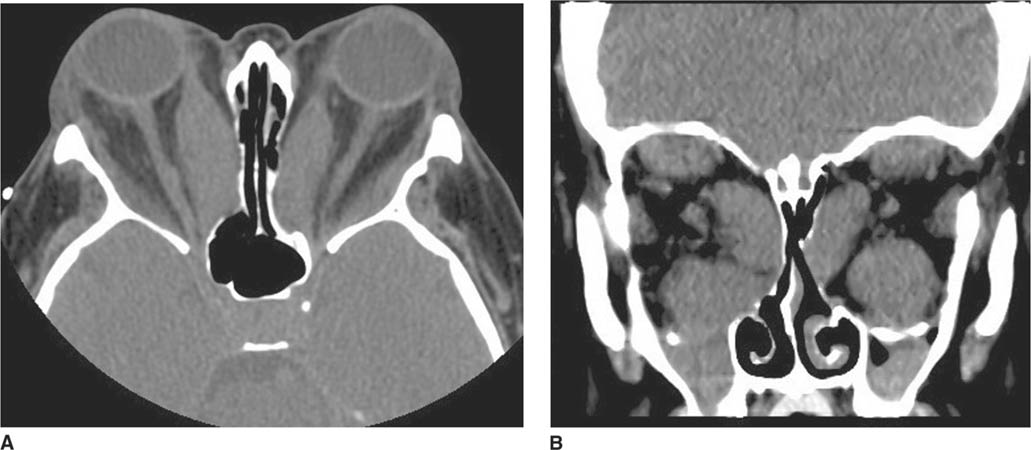
 FIGURES 6-7A and 6-7B Unenhanced axial CT of the orbits In a 72-year-old woman. (A) Axial Image shows marked enlargement of the bellies of the medial rectus muscles; the muscle tendons are of normal size. The orbital fat is normal in appearance. (B) Coronal image shows marked enlargement of the inferior rectus and medial rectus muscles. The superior rectus muscle is mildly enlarged. The superior ophthalmic vein is normal in diameter.
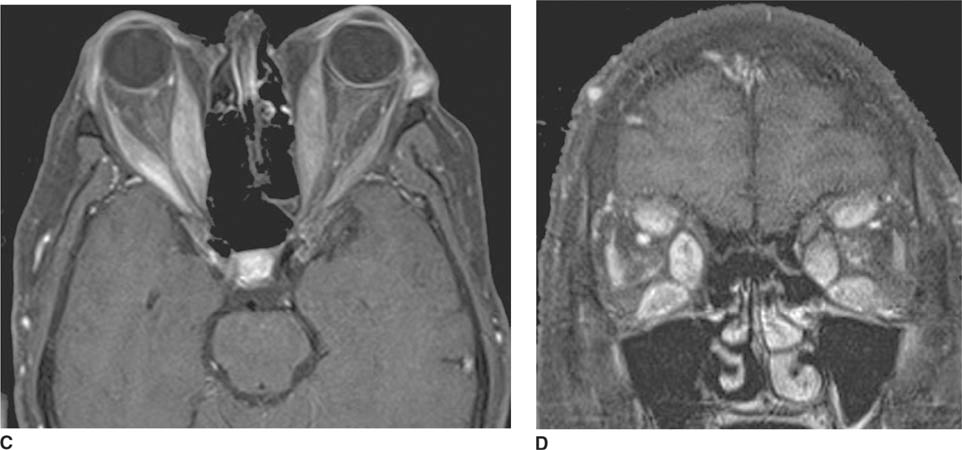
 FIGURES 6-7C and 6-7D Contrast-enhanced T1-weighted MR images using fat saturation technique in a 58-year-old woman with proptosis. (C) Axial image shows enlargement of both medial rectus muscles and the right lateral rec-tus muscle. The space around the optic nerves is narrowed bilaterally by expansion of the muscles. The orbital fat is normal in appearance. (D) Coronal image shows marked expansion of the medial rectus, inferior rectus and superior rectus muscles. The orbital veins are normal in size.
 Orbital pseudotumor (idiopathic orbital myositis): Myositis is one of many manifestations of orbital pseudotumor. This is an unlikely diagnosis for the case shown above because diffuse enlargement of the entire extraocular muscle is usually seen in orbital pseudotumor, whereas the tendinous portions of the muscles are not enlarged in the figures shown.
 Neoplasm arising from muscle: Tumors such as rhab-domyosarcoma, lymphoma, leukemia, and metastases can involve the extraocular muscles. However, bilateral, symmetric involvement makes this diagnosis unlikely.
 Vascular congestion causing extraocular muscle enlargement: Muscle enlargement can result from vascular congestion associated with high blood-flow states such as CCF (see Case 6). This condition is often manifested clinically by chemosis and an orbital bruit (neither of which was reported in the clinical history of these patients). On imaging, dilatation and tortuosity of the superior ophthalmic vein and distention of the cavernous sinus are typically seen; both findings are absent in the patients shown. This diagnosis is, therefore, unlikely.
 Graves’ ophthalmopathy: This is the best diagnosis given the bilateral muscle enlargement, predominant involvement of the inferior, medial, and superior rectus muscles, and sparing of tendinous insertions of the extraocular muscles. Subsequent laboratory tests in both women showed findings indicative of hyperthyroidism.
DIAGNOSIS
Graves’ ophthalmopathy (thyroid ophthalmopathy)
KEY FACTS
Clinical
 Graves’ disease is an autoimmune disease caused by circulating antibodies that are directed against the thyrotropin receptor and cause hyperthyroidism. The disease is approximately eight times more common in women and typically has onset in the fourth or fifth decade of life.
 Thyroid ophthalmopathy is a common cause of unilateral or bilateral proptosis in adults.
 Extraocular muscle enlargement occurs due to lym-phocytic and plasmacytic infiltration of connective tissue (presumed to be autoimmune in origin) accompanied by mucopolysaccharide deposition, edema, and fibrosis.
 Enlargement of the extraocular muscles can produce proptosis, decreased range of globe motion and diplopia, and periorbital and conjunctional edema due to elevated orbital pressure.
 Visual loss is threatened in 10% of patients due to compressive optic neuropathy (caused by compression of the optic nerve at the orbital apex due to muscle enlargement) or corneal ulceration (due to corneal exposure secondary to lid retraction and exophthalmos).
 Thyroid ophthalmopathy usually occurs in patients with hyperthyroidism, but 10% of patients have no clinical or laboratory evidence of thyroid disease.
 Treatment is typically with corticosteroids. Occasionally, radiation therapy or surgical decompression of the optic nerve is performed is cases in which vision is threatened.
 In many patients, the major alternative diagnosis to be considered is orbital myositis, especially in cases of unilateral disease. Clinically, myositis usually has onset over the course of days, is painful, is often accompanied by ptosis and responds quickly to corticosteroids. Thyroid ophthalmopathy usually has an onset of many weeks, is painless, is typically accompanied by lid retraction (rather than ptosis) and has a slow and, often, incomplete response to corticosteroids. On imaging, myositis typically involves solely one muscle and involves both the muscle belly and the tendinous insertion; neither feature is present in thyroid ophthalmopathy.
Radiologic
 Thyroid ophthalmopathy typically produces enlargement of the bellies of the extraocular muscles, with sparing of the tendinous insertions, which can be helpful in distinguishing it from other causes of extraocular muscle enlargement.
 The inferior rectus muscles and medial rectus are affected earliest and most severely. The lateral rectus muscle is usually the least involved. In 6% of cases, only one muscle is enlarged.
 Approximately 85% of cases have bilateral disease on CT or MRI. In 15% of cases, orbitopathy presents with predominantly unilateral eye findings or precedes onset of clinical hyperthyroidism, making correct diagnosis difficult.
 Imaging in the coronal or sagittal plane is better suited for determination of enlargement of the extraocular muscles, particularly the inferior rectus and superior rectus muscles (which are cut tangentially on axial images).
 Findings other than extraocular muscle enlargement that may be seen include an increase in the volume of orbital fat and enlargement or anterior displacement of the lacrimal gland. The increased orbital fat may cause bowing of the medial wall of the orbit or prolapse of fat into the superior orbital fissure.
 Indications for imaging in Graves’ orbitopathy include (1) increasing certainty regarding the diagnosis and excluding other causes of clinical findings, (2) determining best treatment (e.g., immunosuppressive therapy vs. surgery), and (3) monitoring treatment response.
SUGGESTED READING
Kirsch E, Hammer B, von Arx G. Graves’ orbitopathy: current imaging procedures. Swiss Med Weekly 2009;139:618–623.
Mayer EJ, Fox DL, Herdman G, et al. Signal intensity, clinical activity and cross-sectional areas on MRI scans in thyroid eye disease. Eur J Radiol 2005;56:20–24.
Naik VMN, Naik MN, Goldberg RA, et al. Immunopathogenesis of thyroid eye disease: emerging paradigms. Ophthalmol 2010;55:215–226.
JAMES M. PROVENZALE AND CHARLES B. DONOVAN
HISTORY
A 9-year-old boy with diabetes insipidus.
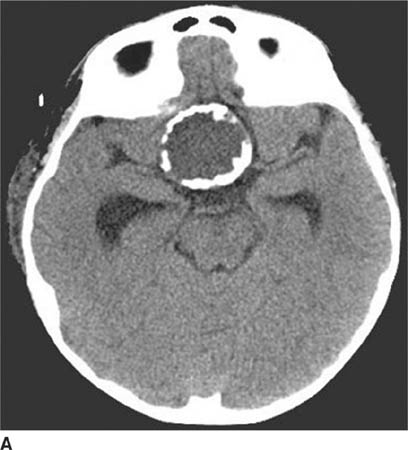
 FIGURE 6-8A Unenhanced axial CT shows a mass with peripheral calcification located in a suprasellar location.
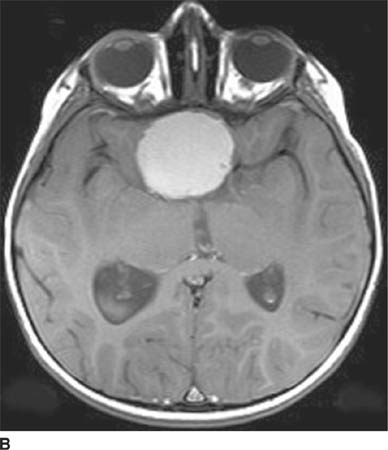
 FIGURE 6-8B Unenhanced axial T1-weighted MR image shows that the mass is hyperintense on this pulse sequence. The calcifications seen on CT are evident as very small foci along the rim of the lesion.
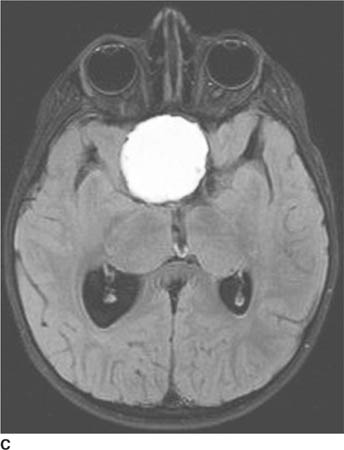
 FIGURE 6-8C Axial FLAIR image shows the mass is also hyperintense on this pulse sequence.
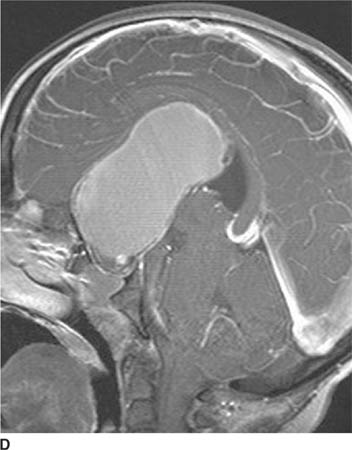
 FIGURE 6-8D Sagittal contrast-enhanced T1-welghted Image shows that the lesion Is very large and extends from the sella cephalad to elevate the corpus callosum. A small enhancing region Indicative of a small soft tissue component Is seen at the caudad aspect of the mass and within the sella.
 Optic glioma: This diagnosis could be considered based on the fact that some of the mass shown in the case presented is located in the suprasellar space, a common location for optic glioma. However, the lesion shown in this case is not oriented along the visual pathways. Also, optic gliomas are rarely calcified or invade the sella. Although optic gliomas can have cystic regions (often indicating necrosis), unlike the case shown here, the cystic component is usually small. This diagnosis is unlikely.
 Craniopharyngioma: This diagnosis is a common cause of a suprasellar mass in childhood, accounting for about half of suprasellar tumors. These lesions typically have both a calcified component and a cyst. This diagnosis is correct.
 Germinoma: This diagnosis might be considered because of the suprasellar location of the lesion in the case shown here. However, germinomas are usually solid masses, unlike the cystic lesion shown here; this diagnosis is unlikely.
 Pituitary adenoma: Pituitary adenomas are rare in children. Furthermore, a large cystic component and calcification would be unusual. This diagnosis is incorrect.
 Rathke’s cleft cyst: This diagnosis might be considered because of the sellar and suprasellar location of the mass in the case shown. However, Rathke’s cleft cysts are typically predominantly intrasellar, usually much smaller than the lesion shown here, do not contain a soft tissue component, and are not calcified. This diagnosis is incorrect.
DIAGNOSIS
Craniopharyngioma
KEY FACTS
Clinical
 Craniopharyngiomas are World Health Organization classification grade I tumors that are derived from squamous epithelial remnants of Rathke’s cleft. Most involve both the sellar and suprasellar regions, but less commonly, they can be located solely within the sella or the third ventricle.
 These tumors represent 3% to 5% of all intracra-nial tumors, show no gender predilection, and have a bimodal age distribution. More than half occur in childhood (peak: ages 5 to10 years) and adolescence, but a second peak is seen in later years (50 to 74 years old).
 Craniopharyngiomas account for 5% to 15% of childhood intracranial tumors.
 Clinical symptoms are typically due to mass effect on adjacent structures—for example, visual field defects due to compression of the optic pathways and neuroendocrine dysfunction due to compression of the hypothalamus and pituitary gland. The most common symptoms are headache, nausea, papilledema, growth failure (in children), and hypogonadism (in adults).
 Two distinct clinicopathologic variants are recognized. The adamantinomatous type is the more common of the two variants and can be seen in both adults and children but is more common in the latter. This tumor type more frequently is calcified, exhibits necrosis, and contains cholesterol within cysts. The papillary form almost always occurs in adults but still represents only about one-third of adult craniopharyngiomas. It is more often solid, less frequently calcified, and has been reported to have a better surgical outcome than adamantinomatous tumors in the adult.
 Adamantinomatous lesions may have a surrounding region of gliosis at the interface of the lesion with brain tissue, which can cause the tumor to tightly adhere to brain tissue, often making complete resection impossible.
 Presenting symptoms and signs are usually those associated with increased intracranial pressure (headache, nausea, vomiting, and papilledema) or visual disturbance. Craniopharyngiomas are hormonally inactive but can compress the pituitary gland and hypothalamus, causing neuroendocrine dysfunction.
 There is a considerable debate regarding the best management of craniopharyngiomas—that is, whether to use surgical resection or cyst aspiration followed by radiation therapy. Surgical excision is complicated by the fact that complete resection of the tumor away from the hypothalamus and pituitary stalk is often impossible.
 Tumors with a size >5 cm have a much higher recurrence rate (80%) than that found for smaller lesions (20%).
Radiologic
 Craniopharyngiomas are typically heterogeneous masses; the heterogeneous composition of a craniopharyngioma is often more easily discernible on MR imaging than on CT.
 The triad of suprasellar location, calcifications, and a cyst is highly suggestive of craniophrayngioma. Calcifications, readily detectable on CT, are present in about 90% of childhood lesions and 70% of adult lesions.
 Approximately 95% of lesions have a suprasellar component, including 20-40% that are solely suprasellar. Only 5% are solely intrasellar.
 About 90% of craniopharyngiomas are partially cystic. Rarely, the lesion is purely cystic. The cyst contents consist of straw-colored or oily brownish fluid with variable amounts of cholesterol crystals and triglycerides, which often produces a hyperintense appearance on unenhanced T1-weighted images.
 The unenhanced CT appearance is that of an inhomo-geneous mass that frequently has cystic components and punctate or clumpy calcifications. Occasionally, the cyst is hyperdense, reflecting very high protein concentration. Variable degrees of a soft tissue component can be seen, but administration of contrast material is frequently necessary to depict it.
 The papillary type has a more uniform CT and MR appearance with less frequent calcification and cyst formation.
 On CT and MR studies, when cyst contents are identical in appearance to CSF, the presence of calcifications and soft tissue components helps to distinguish cranio-pharyngioma from arachnoid cyst, a lesion that also commonly occurs in the suprasellar region.
 The cystic components of craniopharyngiomas are variable on T1-weighted images, varying from isointensity with CSF to hyperintensity. Fluid that is isointense to CSF is more commonly seen in small (<10 mm) lesions, while fluid that is hyperintense on T1-weighted images (as in the case shown here) is more commonly seen in large lesions. Solid portions are frequently relatively isointense to brain on all pulse sequences.
 On occasion, various signal intensities can be seen within the cystic component of the tumor, thought due to compartments containing fluids of different protein composition.
 MRI is helpful in preoperative definition of the relationship of the tumor to the optic nerves and chiasm, internal carotid arteries and their branches, pituitary stalk, hypothalamus, and third ventricle.
 Gradient recalled echo or susceptibility-weighted images are useful for depicting the calcifications in this tumor on MR imaging.
SUGGESTED READING
Osborn AG, Preece MT. Intracranial cysts: radiologic-pathologic correlation and imaging approach. Radiology 2006;239:650–664.
Garre ML, Cama A. Craniopharyngioma: modern concepts in pathogenesis and treatment. Curr Opin Pediatr 2007;19:471–479.
Bonneville F, Cattin F, Marsot-Dupuch K, et al. T1 signal hyperintensity in the sellar region: spectrum of findings. Radiographics 2006;26: 93–113.
Curran JG, O’Connor E. Imaging of craniopharyngioma. Child’s Nerv Syst 2005;21:635–639.
Molla E, Marti’-Bonmati L, Revert A, et al. Craniopharyngiomas: identification of different semiological patterns with MRI. Eur Radiol 2002;12:1829–1836.
Karavitaki N, Cudlip S, Adams CBT, Wass JAH. Craniopharyngioma. Endo-crin Rev 2006;27:371–397.
JAMES M. PROVENZALE
HISTORY
A 40-year-old woman with 10 days of right hand weakness. She experienced a transient episode of painful right monocular visual loss 2 years earlier.
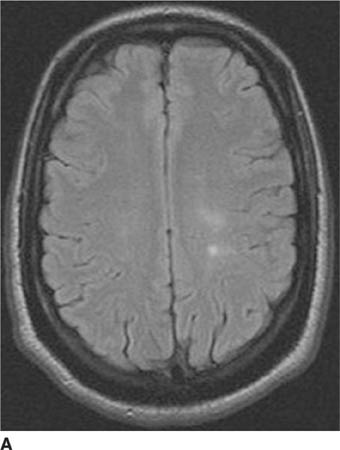
 FIGURE 6-9A Axial FLAIR image shows two hyperintense foci with ill-defined borders in the left frontal white matter.
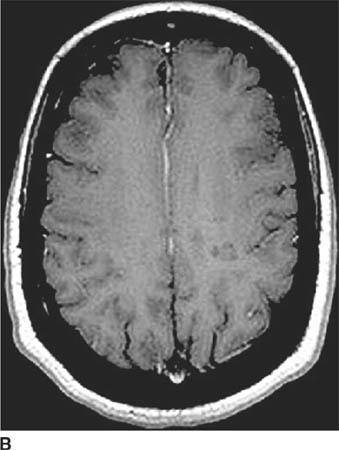
 FIGURE 6-9B Axial contrast-enhanced T1-welghted image shows that neither lesion contrast-enhances. The posterior lesion is clearly hypointense relative to white matter. The anterior lesion also has subtle decreased signal intensity.
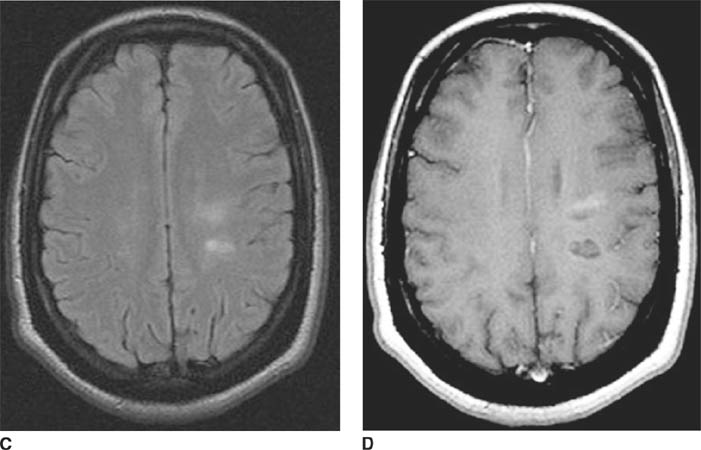
 FIGURES 6-9C and 6-9D C Axial FLAIR image obtained 2 months after the images in 6-9A and 6-9B shows that the two hyperintense foci have increased in size. D Axial contrast-enhanced T1-weighted image shows that the anterior lesion is larger and now hypointense relative to white matter. The region of lesion growth anteriorly now contrast-enhances.
 Deep “watershed” infarcts: Such infarcts occur at border zones between major arterial territories or in deep white matter locations. They are typically seen as rounded foci or elongated foci that have their longest dimension in the anteroposterior direction. The lesions shown here are oval, with their long axis in the lateral dimension, making watershed infarct unlikely. In this particular case, it would be important to carefully look for the presence of other white matter lesions that are not in a single vascular distribution; if present, such lesions would make watershed infarction even less likely.
 Low-grade neoplasm: This diagnosis does not account for the past medical history. The two separate lesions or the oval appearance of the abnormalities.
 Vasculitis: The history of a previous neurologic event years before does not support this diagnosis. Furthermore, most infarcts within the white matter are rounded or linear; the oval shape of the lesions does not support this diagnosis.
 Multiple sclerosis (MS): The clinical history in this patient describes a bout of optic neuritis, commonly seen in MS patients. Multiple white matter lesions that are hyperintense on T2-weighted images, hypointense on T1-weighted images (so-called black holes) and aligned at right angles to the ventricular surface are common. This is the correct diagnosis.
 Acute disseminated encephalomyelitis (ADEM): This disease generally occurs after a systemic viral infection or a vaccination. No such history is given in this patient. Furthermore, ADEM typically has a monophasic course, unlike the history given here.
DIAGNOSIS
Multiple sclerosis
KEY FACTS
Clinical
 MS is a demyelinating disease typified by multiple exacerbations and remissions involving different parts of the CNS. Thus, lesions are characterized by being “multiple in space and time.”
 The most common sites of involvement are the white matter tracts of the centrum semiovale, corona radiata, and brain stem.
 Spinal cord involvement is seen in about 10% of cases.
 Onset of symptoms is usually in the third to fifth decades.
 Optic neuritis is common. Furthermore, a significant proportion of patients with isolated optic neuritis later are diagnosed as having MS.
 The prevalence of MS is higher at northern and temperate climates compared to regions near the equator.
 Laboratory abnormalities include the presence of oligoclonal bands in cerebrospinal and abnormal electrophysiologic studies (i.e., visual, auditory, or somatosensory evoked potentials).
 The exact etiology is unknown, but MS is generally considered an autoimmune phenomenon.
Radiologic
 MS lesions are typically periventricular in location. Although many diseases can produce such lesions, MS plaques are often oval and have a perpendicular orientation to the lateral ventricles.
 Lesions in the corpus callosum, middle cerebellar peduncle, or spinal cord increase the likelihood of the diagnosis of MS.
 FLAIR images are most sensitive for detecting small lesions adjacent to ventricular surface.
 Contrast-enhancing lesions are relatively frequently seen and are generally considered to represent plaques in the acute (“active”) stage of demyelination.
 MS plaques are generally either isointense (most commonly) or hypointense (“black holes” appearance) compared to white matter on T1-weighted images. The latter likely represent either areas of edema or severe tissues injury (e.g., axonal loss).
 Most contrast-enhancing lesions are also hypointense on unenhanced T1-weighted images.
 Solely spinal cord involvement (most commonly the cervical spinal cord) is seen in 10% to 20% of cases.
 Advanced MR imaging techniques such as diffusiontensor imaging, MR spectroscopy, and magnetization transfer imaging show that much of the white matter that appears normal on FLAIR images is, in fact, abnormal
SUGGESTED READING
Ge Y. Multiple Sclerosis: The role of MR imaging. AJNR Am J Neuroradiol 2006;27:1165–1176.
Bourekas EC, Varakis K, Bruns D, et al. Lesions of the Corpus Callosum: MR Imaging and Differential Considerations in Adults and Children. AJR 2002;179:251–257.
Bagnato F, Jeffries N, Richert ND, et al. Evolution of T1 black holes in patients with multiple sclerosis imaged monthly for 4 years. Brain 2003;126:1782–1789.
Filippi M, Grossman RI. MRI techniques to monitor MS evolution. The present and the future. Neurology 2002;58:1147–1153.
Arnold DL, Matthews PM. MRI in the diagnosis and management of multiple sclerosis. Neurology 2002;58:S23–S31.
Guo AC, MacFall JR, Provenzale JM. Diffusion tensor imaging of multiple sclerosis: Evaluation of normal-appearing white matter. Radiology 2002;222:729–736.
Kealey SK, Kim YJ, Provenzale JM. Redefinition of multiple sclerosis plaque size using diffusion tensor MRI. AJR 2004;183:497–503.
E. RALPH HEINZ
HISTORY
A 20-year-old man with a primary brain tumor.
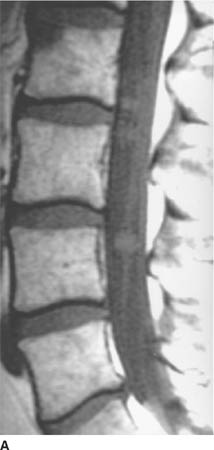
 FIGURE 6-10A Unenhanced T1-weighted sagittal image of the spine. A number of nodules are seen within the thecal sac.
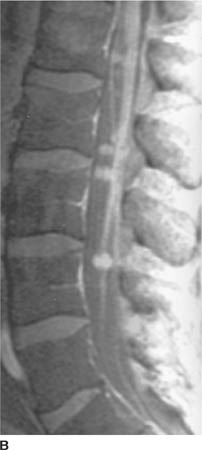
 FIGURE 6-10B Contrast-enhanced T1-weighted sagittal image of the spine using fat saturation technique. The nodules densely contrast-enhance in a homogeneous manner.
 Leptomeningeal (“drop”) metastases: This term refers to leptomeningeal spread of tumor arising from a primary CNS neoplasm. Small metastases disseminate through the cerebrospinal spaces and subsequently enlarge. The diffuse pattern of enhancing nodules along the entire length of the cauda equina in a patient with a known primary brain tumor makes this diagnosis the most likely consideration.
 Neurofibroma of the spinal roots: This diagnosis is considered because neurofibromas usually contrast-enhance. However, they are usually larger and oriented along the axis of the nerve root.
 Granulomatous disease: Granulomatous diseases—for example, sarcoidosis—can coat the spinal cord and spinal nerve roots. The appearance is usually that of contrast-enhancing nodules accompanied by adjacent enhancement of the pia and arachnoid (not present in the case shown above). Granulomatous involvement at other cranial sites (e.g., the basilar meninges) or extra-CNS sites (e.g., the lungs) might be expected, which is not reported in this patient.
 Contrast-enhancement of spinal cord vessels: Contrast-enhancement of veins posterior to the spinal cord is often seen on MRI, even in normal subjects. On a single axial image, contrast-enhancement within veins can be mistaken for enhancing metastases. The distinction between the two entities can be made by looking at serial axial images. Because veins are generally oriented along the craniocaudad axis, venous enhancement should be seen in the same site on serial axial images; metastases will be seen on only one or two of a series of axial images. The lesions shown above are not oriented along the spinal cord and do not represent enhancing vessels.
DIAGNOSIS
Drop metastases
KEY FACTS
Clinical
 Between 5% and 30% of children with CNS tumors will have CSF metastasis at the time of diagnosis or at some point in the clinical course—that is, at initial diagnosis or at time of recurrence.
 Clinical status is not a good predictor of the presence of drop metastases. Unless CSF metastases are quite large, patients with drop metastases are generally asymptomatic and appear well.
 Detection of drop metastases is vital, because survival is poor if early treatment of tumor dissemination is not performed.
 Imaging studies are frequently positive for drop metastases in patients in whom cytologic examination of the CSF is negative. However, CSF cytologic findings are positive in 30% of cases in which imaging studies are negative. Therefore, CSF examination and imaging studies are complementary—either examination can be positive when the other examination is negative.
 Medulloblastoma is the most common source of drop metastasis (about 50% of all cases), followed by glio-blastoma (about 15%).
 Two age peaks of drop metastases are seen in patients with childhood brain tumors. The first peak occurs at about age 6 years, at the time of initial diagnosis. The second occurs at about age 15 years and occurs in two conditions (1) patients with an incompletely treated brain tumor who have had previous prophylactic spinal radiation but subsequently develop drop metastases, and (2) patients with previous remission of brain tumor who develop recurrence of the brain tumor with coexistent drop metastases.
 CSF cytology is still the most sensitive means for determining leptomeningeal tumor spread, being positive on initial lumbar puncture in about half of patients with proven CSF metastases.
Radiologic
 Drop metastases tend to be more frequent in the lower spinal canal—that is, the lumbosacral area (73%), probably due to the effects of gravity.
 Metastases within the spinal canal are usually dorsal in location, reflecting CSF flow from the head; ventral CSF flow tends to be toward the head.
 The sensitivity of contrast-enhanced MRI is greater than CT myelography or myelography alone. Rapid screening of the entire spinal axis can be performed by MRI in a noninvasive manner. CT myelography is an invasive study in which the myelogram is typically used to direct CT imaging of only a portion of the spinal canal.
SUGGESTED READING
Heinz ER, Weiner D, Friedman H, Tien RD. Detection of cerebral spinal fluid metastasis: CT myelography or MR. AJNR 1995;16:1147–1151.
Kramer ED, Rafto S, Packer RJ, Zimmerman RA. Comparison of myelogra-phy with CT follow-up vs. gadolinium MRI for subarachnoid metastatic disease in children. Neurology 1991;41:46–50.
Yousem DM, Patrone PM, Grossman RI. Leptomeningeal metastasis: MR evaluation. J Comput Assist Tomogr 1990;14:255–261.
JAMES M. PROVENZALE
HISTORY
A 50-year-old woman with a sudden onset of low back pain and progressive paraparesis over 1 hour. Symptoms began suddenly after the patient sneezed.
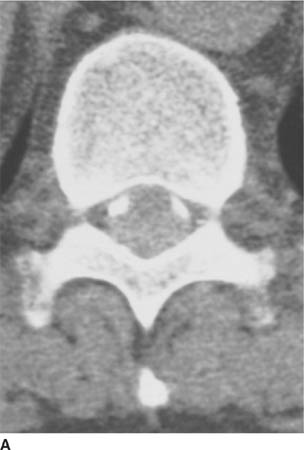
 FIGURE 6-11A Axial image from a postmyelography CT at the T10 level shows marked compression of the spinal cord (seen anteriorly in the midline, bounded on each side by the contrast-filled thecal sac). A mass that is isodense to soft tissue is in the midline posteriorly.
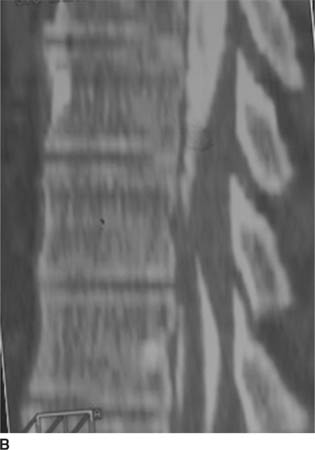
 FIGURE 6-11B Sagittal reconstruction derived from axial images from the postmyelography CT shows the mass is fusiform in shape and aligned along the length of the spinal canal.
DIFFERENTIAL DIAGNOSIS
 Epidural metastasis: Such metastases usually arise from vertebral body metastases and extend into the spinal canal, making this an unlikely diagnosis. Nonetheless, in rare instances, some metastases (e.g., lymphoma and leukemia) can infiltrate solely the soft tissues and dura. However, these diagnoses would be unlikely in light of the acute onset of symptoms and the hypointense signal of the lesion in the second patient shown above.
 Spinal epidural abscess: Usually spinal epidural abscesses have a clinical onset lasting over a day or more and are located in the anterior epidural space and osteomyelitis or discitis is present. However, in the patients shown above, the clinical onset is very short, only the posterior epidural space is involved, and neither osteomyelitis nor discitis is present.
 Spinal epidural hematoma: The rapid onset of neurologic deficit is consistent with this diagnosis. The absence does not exclude this diagnosis, because spinal epidural hematoma sometimes occurs after Valsalva maneuvers that accompany exertion (e.g., weight-lifting) or vigorous coughing or sneezing (as in this patient). Such hematomas typically occur in the posterior epidural compartment, as in the case shown here.
 Spinal cord infarction: This entity is a consideration based on the acute onset of neurologic findings. However, infarction would be expected to produce an intramedullary lesion, not an epidural lesion. This diagnosis is incorrect.
DIAGNOSIS
Spinal epidural hematoma
KEY FACTS
Clinical
 The term spontaneous spinal epidural hematoma refers to a hematoma that arises without any cause known prior to development of the hematoma. Thus, spontaneous lesions occur in the absence of recognized trauma to the spine. In most cases of spontaneous spinal epidural hematoma, a cause is never identified.
 Most cases occur in the 55- to 70-year-old age range.
 A precipitating cause (e.g., spinal vascular malformation) may occasionally be found after diagnosis of the hematoma but this is seen in only about 5% of cases.
 A substantial number of patients who develop spinal epidural hematoma have been undergoing treatment with anticoagulants at the time of symptom onset.
 Spontaneous spinal epidural hematoma may occur after physiologic events that momentarily raise intraspinal pressure, for example, Valsalva maneuver or forceful coughing.
 Some spinal epidural hematomas occur after a minor invasive procedure, such as a lumbar puncture, myelo-gram, or placement of an epidural catheter or needle. Patients who have a coagulopathy or medicated with antioagulants are at increased risk for development of a hematoma.
 The typical clinical presentation is acute onset of back pain and rapid development of myelopathy inferior to the level of the hematoma. However, in some reported series, only abut 50% of patients have back pain. Early diagnosis of spinal epidural hematoma is critical because the likelihood of reversal of neurologic deficit is related to duration of symptoms.
 Lesions usually occur in the thoracic or lower cervical spine.
 In most patients, the etiology of spinal epidural hematoma is not known, even after surgery. Most spontaneous hematomas are thought to be venous in origin and related to the fact that the veins in the epidural space are valveless and, thus, more directly influenced by changes in thoracic or abdominal pressure. Less commonly, hematomas may be due to rupture of a spinal vascular malformation or due to hemorrhage from an arterial source.
 Emergency laminectomy to evacuate the hematoma is usually performed. Preoperative radiologic demonstration of the extent of the hematoma is important for surgical planning.
 Degree of recovery of neurologic function is related to degree of preoperative deficit (which itself appears to be related to time interval between symptom onset and surgery). In patients who have incomplete sensorimotor loss prior to surgery, about 95% receive some benefit from surgery (and about 40% have complete recovery of function). However, patients with complete sensorim-otor loss have only about a 10% complete recovery and only about 45% recover some function.
Radiologic
 Spinal epidural hematomas are typically fusiform in shape, with their longest dimension along the craniocau-dad axis. They are often best seen on sagittal MR images.
 These lesions are usually located in the posterior epi-dural space and are typically three to four vertebral bodies in length.
 MRI is the most sensitive and specific means of making the diagnosis but the diagnosis can also be, CT myelography, myelography alone and, in some instances, CT alone.
 The MR signal intensity of spinal epidural hematoma depends on the age of the hemorrhage. In the first 12 hours after symptom onset, the hematoma is relatively isointense to the spinal cord on T1-weighted images and hyperintense on T2-weighted images. After intravenous administration of contrast material, small foci of contrast-enhancement can be seen within the hematoma of T1-weighted images.
 After the first 12 hours but within the first few days after onset, the hematoma is often heterogeneous on both T1-weighted and T2-weighted images. Alternatively, the hematoma may uniformly attain the signal characteristics of intracellular methemoglobin, being hyper-intense on T1-weighted images and often hypointense on T2-weighted images. Because epidural fat is hyper-intense on T1-weighted images, use of fat-suppressed T1-weighted imaging can make the hematoma more conspicuous.
 On MR imaging, hematomas that are older than one week in onset are often hyperintense on T1-weighted and T2-weighted images. On T2-weighted images, the hyperintense appearance may render the hematoma difficult to distinguish from CSF.
 If MRI is unavailable or contraindicated, CT myelogra-phy is an acceptable means of making the diagnosis. On axial images, the lesion is seen as a (usually posterior) epidural mass that is isodense or hyperdense to spinal cord and displaces the thecal sac or spinal cord.
 Myelographic findings are nonspecific and consist of narrowing or block of the intrathecal contrast column. The lesion can often be seen to be smoothly tapered at each end.
 The diagnosis can be difficult to make by plain CT when the epidural mass is isodense to the spinal cord.
 Spinal epidural hematoma can be difficult to distinguish from spinal subdural hematoma—a very uncommon entity. The distinction is usually not important, because surgical evacuation is usually performed in both cases. On axial CT and MRI, subdural hematoma is frequently crescentic and sometimes separated from the lamina by epidural fat. On MRI, subdural hematoma can sometimes be seen to be separated from the epidural fat by the linear hypointense signal of the dura.
 Therapy is typically emergency surgical decompression and evacuation of the hematoma. Preoperative angi-ography is generally not performed because it delays therapy and usually will not provide information that is needed in surgical decision making.
SUGGESTED READING
Hsieh CT, Chang CF, Lin EY, et al. Spontaneous spinal epidural hematomas of cervical spine: report of 4 cases and literature review. Am J Emerg Med 2006;24:736–740.
Kreppel D, Antoniadis G, Seeling W. Spinal hematoma: a literature survey with meta-analysis of 613 patients. Neuorsurg Rev 2003;26:1–49.
Layton KF, Kallmes DF, Horlocker TT. Recommendations for anticoagulated patients undergoing image-guided spinal procedures. AJNR Am J Neuroradiol 2006;27:467–471.
Cullen DJ, Bogdanov E, Htut N. Spinal epidural hematoma occurrence in the absence of known risk factors: a case series. J Clin Anesth 2004;16:317–319.
Lonjon MM, Paquis P, Chanalet S, Grellier P. Nontraumatic spinal epidural hematoma: report of four cases and review of the literature. Neurosur-gery 1997;41:483–486.
Braun P, Kazmib K, Nogues-Melendez P, et al. MRI findings in spinal subdural and epidural hematomas. Eur J Radiol 2007;64:119–125.
Chang F-C, Lirng J-F, Chen S-S, et al. Contrast-enhancement patterns of acute spinal epidural hematomas: a report of two cases. AJNR Am J Neuroradiol 2003;24:366–369.
JAMES M. PROVENZALE AND E. RALPH HEINZ
HISTORY
A 60-year-old man with a 2-month history of headache and confusion.
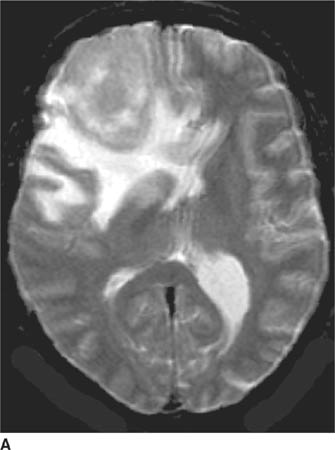
 FIGURE 6-12A Axial T2-weighted image shows a large mass in the right frontal lobe surrounded by hyperintense vasogenic edema. Portions of the mass are only mildly hyperintense compared to normal gray matter.
Related posts:
Stay updated, free articles. Join our Telegram channel

Full access? Get Clinical Tree


