Structure
Location
Normal T2-weighted MRI appearance
Other
Peripheral zone
Surrounds the central zone and the distal prostatic urethra
Homogeneous high signal intensity
Most common site of prostate cancer
Transition zone
Forms two bulges on either side of the urethra that extend superiorly, anteriorly, and laterally from the verumontanum
Heterogeneous appearance owing to variable mix of stromal and glandular components
Most common site of benign prostatic hyperplasia (BPH)
Central zone
Surrounds the ejaculatory ducts, enclosing both the transition zone and the urethra proximal to the verumontanum
Most commonly of homogeneous low signal intensity
Embryologically more akin to seminal vesicles than to the rest of the prostate
Seminal vesicles
Postero-superior to the prostate
High signal intensity; convoluted “tubular” appearance
Drain into the midprostatic urethra via ejaculatory ducts at the verumontanum
Fig. 4.1
Normal prostate anatomy on MRI. Axial (a, b), sagittal (c), and coronal (d) T2-weighted MR images of the male pelvis. The seminal vesicles (arrows in a and d) drain into the midprostatic urethra via the ejaculatory ducts (arrow in c) at the level of the verumontanum (arrowhead in c). The transition zone (T) extends superiorly, anteriorly, and laterally from the verumontanum. The central zone (CZ) surrounds the ejaculatory ducts and the peripheral zone (PZ) surrounds both the central zone and the distal prostatic urethra. B bladder; EC endorectal coil
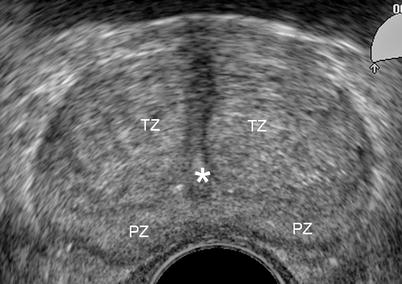
Fig. 4.2
Normal prostate anatomy on transrectal ultrasound (TRUS). TRUS image at the level of the midgland showing the peripheral zone (PZ), transition zone (TZ) and urethra (asterisk). TRUS has a limited accuracy for the detection of prostate cancer, but is typically used to guide prostate biopsies when cancer is suspected based on abnormal digital rectal examination or raised serum PSA
Prostate Cancer Diagnosis
Table 4.2
Typical appearance of prostate cancer according to imaging modality
Technique | Imaging appearance |
|---|---|
Ultrasound | Hypoechoic compared to adjacent prostate tissue. Ultrasound is primarily used for guidance of transrectal prostate biopsies and focal therapies |
CT | Hypoattenuating compared to adjacent prostate tissue, with enhancement following intravenous contrast. Not routinely used for primary diagnosis due to lack of sensitivity and specificity, however is useful for assessment of lymphadenopathy and in the post-treatment setting |
PET | Increased uptake of FDG; however, this finding is not always present and artifact from FDG accumulation in the adjacent bladder limit the use of FDG PET-CT in diagnosis |
T2-weighted MRI | Hypointense compared to adjacent prostate tissue |
Diffusion-weighted MRI | High signal intensity on diffusion-weighted images and low signal intensity on apparent diffusion coefficient (ADC) map (restricted diffusion) |
Dynamic contrast-enhanced MRI | Early enhancement, early washout |
MR spectroscopy | Alteration in the ratio of prostate metabolites: citrate, choline, creatine, polyamines |
Fig. 4.3
MRI appearance of peripheral zone prostate cancer [4]. Axial (a) and coronal (b) T2-weighted images show the typical appearance of prostate cancer in the peripheral zone (arrow): low signal intensity compared to homogeneous high signal intensity of the normal peripheral zone (PZ). CZ central zone
Fig. 4.4
MR spectroscopy (MRSI) appearance of prostate cancer [5]. MRSI spectral grid overlaid on T2-weighted MR image (bottom row) showing metabolite peaks from healthy (blue) and cancerous (red) voxels and corresponding whole-mount pathology map (top row) outlining a cancer focus in the left peripheral zone (green and black lines). Typically, the citrate level is high in normal prostatic tissue owing to the fact that the presence of zinc inhibits the first enzyme in the Krebs cycle. Citrate levels are reduced in prostate cancer but they can also be decreased as a result of prostatitis or hemorrhage. Choline is a constituent of the cell membrane, and as such its levels increase with the increased membrane turnover and phospholipids metabolism seen in prostate cancer. The polyamine level peak occurs between the creatine and choline level peaks and is typically decreased in prostate cancer
Fig. 4.5
Potential pitfall in prostate cancer detection on MRI: in the first few weeks after prostate biopsy, postbiopsy changes may be observed as areas of low, intermediate, or high signal intensity depending on the interval between biopsy and imaging, and in some cases may hinder identification of prostate cancer [6]. In this case, a clear low signal intensity tumor focus could be identified in the left peripheral zone (asterisk) despite the extensive low signal intensity regions on axial (a) and coronal (b) T2-weighted images, and high signal intensity regions on axial T1-weighted images (c) representing postbiopsy changes (arrows)
Fig. 4.6
FDG PET-CT in prostate cancer. Fused axial (a) and sagittal (b) PET-CT images demonstrate increased FDG uptake corresponding to prostate cancer with seminal vesicle invasion (arrows). Uptake in the bladder (B) due to renal excretion of FDG and the lack of FDG avidity in some prostate cancers limit the routine use of FDG PET-CT in the diagnosis of prostate cancer; however FDG PET-CT is useful in the detection of metastatic or recurrent disease in lymph nodes and bones, the two most common sites of spread of prostate cancer. Novel radiotracers (e.g., acetate, FLT [fluorothymidine], FACBC [fluorocyclobutane-1-carboxylic acid]) are currently being investigated and may play a role in imaging of prostate cancer in the future
Table 4.3
Transition zone cancer
Prostate cancer most commonly occurs in the peripheral zone; however, about 25 % of cancers occur in the transition zone (TZ) [7]. On T2-weighted images (T2WI), the normal TZ is of heterogeneous signal intensity owing to variable amounts of glandular and stromal components. Features that aid the MRI detection of cancer in the TZ include: |
1. Homogeneous low signal intensity |
2. Ill-defined margins |
3. Lack of a capsule (a feature associated with BPH nodules) |
4. Lenticular shape |
5. Invasion of the anterior fibromuscular stroma |
6. Homogeneous enhancement following intravenous contrast |
Fig. 4.7
Transition zone cancer. Axial (a) and sagittal (b) T2-weighted MRI and ADC map (c) derived from DW-MRI demonstrate an ill-defined area of homogeneous low signal intensity corresponding to a transition zone tumor (asterisk) with extension to the anterior fibromuscular stroma (arrows)
Fig. 4.8
Differential diagnosis of cancer. Axial (a), coronal (b), and sagittal (c) T2-weighted images demonstrate the typical heterogeneous appearance of BPH, in this case compressing the bladder wall (asterisk). BPH is more common with increasing age and can cause symptoms (e.g., urinary hesitancy, frequency, dysuria, and urinary retention). PSA levels may be elevated. BPH is not considered a premalignant condition. Prostatitis may also have MRI features that mimic those of prostate cancer
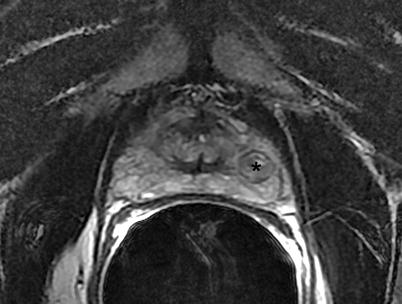
Fig. 4.9
Benign prostatic hyperplasia. Axial T2-weighted image demonstrates BPH in the peripheral zone (asterisk). Although BPH most commonly occurs in the transition zone, the peripheral zone is occasionally affected. Typical features such as the presence of a hypointense capsule and heterogeneous signal intensity aid its diagnosis
Prostate Cancer Staging
T- stage | Notes |
|---|---|
T1: Organ-confined tumor that is clinically and radiologically inapparent | |
T2: Organ-confined tumor that is clinically or radiologically apparent | T2a: Tumor localized to a quadrant |
T2b: Tumor localized to one side | |
T2c: Bilateral tumor | |
T3: Locally advanced tumor, with extraprostatic extension | T3a: Unilateral extracapsular extension |
T3b: Bilateral extracapsular extension | |
T3c: Seminal vesicle invasion | |
T4: Invasion of the bladder, external sphincter, or rectum | Microscopic bladder neck invasion is included in stage T3a |
N: Nodal evaluation | N0: No nodal metastases |
N1: Microscopic regional nodal metastases | |
N2: Macroscopic regional nodal metastases | |
N3: Extraregional nodal metastases | |
M: Metastasis evaluation | M1a: Nonregional lymph nodes |
M1b: Bones | |
M1c: Others |
Stage I | T1a, N0, M0 |
Stage II | T1b, N0, M0 |
T1c, N0, M0 | |
T2, N0, M0 | |
Stage III | T3, N0, M0 |
Stage IV | T4, N0, M0 |
Any T, N1, M0 | |
Any T, any N, M1 |
Related posts:

Stay updated, free articles. Join our Telegram channel

Full access? Get Clinical Tree


