Chapter 7 Valves
Valves
Managing diseases of the four cardiac valves is a major, and growing, feature of cardiology practice. The symptoms of valvular heart disease are well recognized and have been documented for centuries. The stethoscope could be considered as the original ‘imaging’ device providing critical information on valve disease. To a large extent, the stethoscope has been replaced by current cardiovascular imaging modalities which can now very simply provide elegant detail of the characteristics of valve disease. Therefore imaging of the four cardiac valves must be a key aspect of any cardiovascular imaging modality. Accurate analysis of each valve depends on reliable assessment of:
 valve structure—normal morphology?
 valve motion—leaflet movement normal?
 valve function—stenosis or regurgitation?
 masses—vegetations or thrombus?
 severity assessment—degree of valve lesion?
 additional factors—evidence of cardiac compensation?
Optimal imaging of valves requires high temporal resolution to define valve motion and assess flow accurately, and high spatial resolution to allow identification of calcification and masses such as small vegetations.
Imaging of prosthetic valves follows the same principles, although the presence of artefacts such as metal occluders or sewing rings can limit precise anatomical assessment.
Cardiovascular imaging
The suspicion of valve disease is based upon symptoms and clinical signs, with additional support from initial assessment with ECG and chest X-ray. Imaging of the valves is then required, and typically this is done using transthoracic echocardiography. The major pathologies are narrowing of the valve (stenosis) or leaking of the valve (regurgitation).
In many cases detailed echocardiography is sufficient to confirm the diagnosis and plan management. More complex cases may require further detailed imaging with an alternative modality.
Fig. 7.1 Short-axis view of a normal aortic valve demonstrating three valve leaflets and commisures.
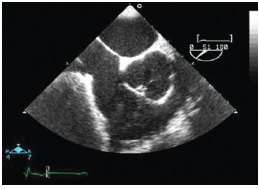
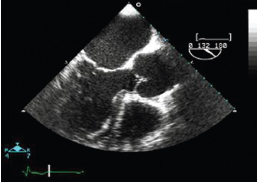
Fig. 7.2 Long-axis view from the same imaging point as in Fig. 7.1. Two of the three leaflets are visible with their attachments to the aortic wall clearly seen. Note that the imaging plane is ∼90° from the image in Fig. 7.1.
Valve structure
The assessment of valve structure requires detailed knowledge of normal valve anatomy and an understanding that the ‘valve’ is far more than just the leaflets. in reality each valve consists of a unique valve ‘complex’ which may include:
 annulus—the supporting structure of the valve
 leaflets—thin mobile ‘cusps’ of the valve
 chordae—support the mitral and tricuspid valves
 papillary muscles—secure the chordae to the ventricular mass
 ventricle—crucial to normal function of the atrioventricular valves
 great vessels—sinus of Valsalva is elemental to aortic valve function.
The annulus of the valve is never just a simple circular ring as implied by the name. For example, the ‘annulus’ of the aortic valve is shaped more like a crown, with three points representing the peaks of the interleaflet triangles formed by the semilunar attachment of each leaflet to the aorta.
The leaflets of the cardiac valves are thin pliable structures which open rapidly to allow unobstructed blood flow and close equally rapidly to minimize regurgitant flow. Leaflet movement also depends on any thickening or abnormality of leaflet tissue. Degenerative calcification of the leaflet body or tips will affect the flexibility of the leaflet.
As the valves consist of a complex of structures rather than the leaflets alone, pathology affecting these areas may affect leaflet movement—for example, prolapse or flail segments of the mitral valve due to disruption of the supporting chordae or papillary muscles.
Assessment of valve structure requires interrogation of all parts of the valve complex and integration of imaging in multiple planes to construct a three dimensional understanding of the size, shape and integration of the components.
 All valves should be imaged in a minimum of two planes, typically a short-axis plane to provide an en face view of the valve (Fig. 7.1) and a long-axis plane to examine the valve in line with flow of blood through it (Fig. 7.2).
 The regions above and below the valve itself should also be carefully imaged given their role in valve support and function.
The mitral valve complex is the most challenging to image, given its unique anatomy. In order to visualize all six segments of the valve leaflets additional imaging planes are required, typically with a series of imaging sections rotated around the long axis of the valve.
Imaging valve motion requires high temporal and spatial resolution. This is particularly important for identifying subtle movement abnormalities such as fluttering and timing of valve closure.
Fig. 7.3 M-mode echocardiography of the mitral valve leaflet tips demonstrating the high detail of leaflet motion.
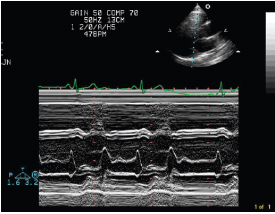
M-mode echocardiography affords the highest temporal resolution for fine-detail analysis of valve movement by continuously scanning along only one line. Subtle signs such as fluttering of the anterior mitral valve leaflet due to aortic regurgitation can be detected (Fig. 7.3).
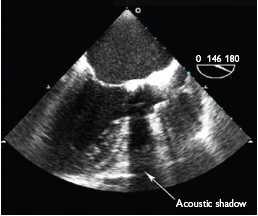
As with valve structure the assessment of valve movement must be done in several imaging planes to ensure that all parts of the valve complex are seen. Marked calcification may cause acoustic shadowing on echocardiography and disrupt imaging of structures beyond the calcium (Fig. 7.4). Alternative imaging planes or the use of transoesophogeal echocardiography may overcome this.
Cardiac magnetic resonance
Cine CMR imaging can provide good visualization of leaflet movement, but the temporal resolution remains lower than that of echocardiography).
Cardiac computed tomography (Fig. 7.5)
Cardiac CT is very useful for demonstrating calcification of valve leaflets (Fig. 7.6), but is not routinely used to assess abnormal leaflet motion.
Fig. 7.5 Computed tomography of an aortic valve bioprosthesis (19mm Edwards Perimount). The stent struts are clearly visible but the valve leaflets can hardly be seen.
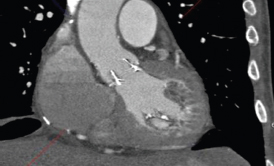
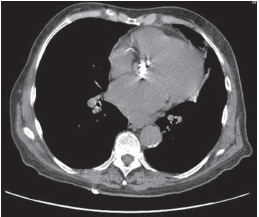
Fig. 7.6 Computed tomography demonstrating severe calcification of the aortic valve.
Valve function
If a valve is structurally abnormal, additional assessment of valve function is mandatory. Is the valve stenotic, regurgitant, or both?
Imaging the high-velocity blood pool as it passes through a valve poses further challenges to the imaging modality. Optimal blood pool imaging will provide data on both flow velocity and direction (Figs. 7.7 and 7.8).
An alternative method of assessing valve function is to measure the orifice of the valve directly. This can be useful in the assessment of stenotic lesions of the aortic and mitral valves. Ensuring that the plani-metered measurement is taken from the leaflet tips and represents the smallest possible orifice is challenging because of movement of the orifice plane during the cardiac cycle.
Many valve lesions will be a combination of stenosis and regurgitation. The effect of the regurgitant jet on forward flow velocity must be understood and integrated into the severity assessment.
If abnormal valve flow is identified, this should be correlated with the valve anatomy. For example, does the regurgitant jet relate to an area of leaflet prolapse?
Fig. 7.7 Colour M-mode of aortic regurgitation showing precise definition of onset and duration.
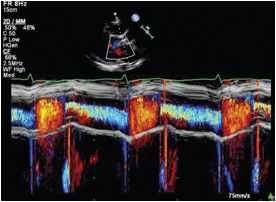
Doppler echocardiography remains the optimal tool for assessment of valve function and can provide high-resolution information on the speed and direction of blood flow. Continuous-wave, pulsed-wave and colour Doppler are used in combination to provide full details of valve function (Figs. 7.9 and 7.10).
An additional advantage of Doppler echocardiography is the ability to assess flow along a single scan line. This produces a colour M-mode along the line of interrogation and the extremely high temporal resolution (>1000 samples per second) allows precise identification of the timing of onset of flow.
Cardiac magnetic resonance
CMR can assess blood flow using cine phase contrast imaging and provide data on velocity against time for flow through a selected point. A suitable encoding velocity must be pre-chosen to avoid aliasing.
Flow can be visualized either ‘through plane’ (akin to a short-axis view of the valve) or ‘in-plane’ (this demonstrates the flow lines along the plane of interest).
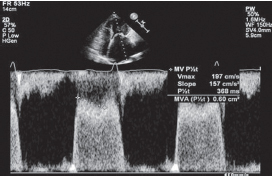
Fig. 7.9 Pulsed-wave Doppler of blood flow through a stenotic mitral valve. By measuring the rate of velocity decline, and hence the pressure drop across the valve, the stenotic area can be estimated.
Valve masses
Identification of abnormal masses attached or adjacent to valves requires similar imaging principles to those for imaging the native valve leaflets. Masses may range from large infective vegetations or tumours to small fine fibrinous strands (Figs. 7.11 and 7.12).
Differential diagnosis of valve masses includes:
 tumour
 infective vegetation
 thrombus
 calcified atherosclerotic mass
 cyst.
cyst.
Certain features of the mass may aid in identification; for example, vegetations are mobile, irregular, and usually attached to the ‘upstream’ side of the valve. Tumours such as fibroelastoma may be more uniform and have discrete attachment points.
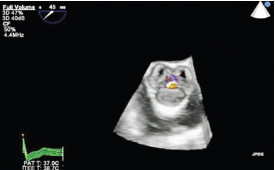
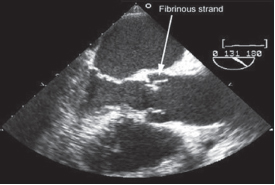
Fig. 7.11 Transoesophogeal echo image of an aortic valve with a fibrinous strand arising from the aortic surface of the non-coronary cusp.
Both transthoracic and transoesophogeal echocardiography are excellent at imaging valvular masses and are frequently able to clarify the aetiology (Fig. 7.13).
Cardiac magnetic resonance
CMR has the additional advantage of being able to identify if the mass has a blood supply. If the mass enhances to the same degree as myocardium after administration of gadolinium contrast, it is likely to be tumour.
Cardiac CT
Cardiac CT is less suited to soft tissue differentiation, but can provide clear anatomical data and extent of calcification.
Related posts:
Stay updated, free articles. Join our Telegram channel

Full access? Get Clinical Tree


