1 Fluoroscopy
Introduction
Shortly after the discovery of X-rays in the late nineteenth century, fluoroscopy was developed to enable visualization of moving anatomy. Today, fluoroscopy is used foAcquisition parameters, referencer diagnosis and guidance of clinical procedures. Applications of fluoroscopy are found throughout medicine, including radiology, cardiology, urology, and speech pathology. Fluoroscopy has the same tradeoffs between image quality and radiation exposure as other X-ray-based modalities. During a fluoroscopy exam, multiple factors affect radiation dose to patients and staff. Some may be directly controlled by the fluoroscopy operator while others are dictated by patient habitus and the procedure being performed. Some interventional procedures can be very complex, requiring long fluoroscopy times to accomplish the clinical task.
Fluoroscopy differs from most other imaging modalities in that the physician is often directly involved in image acquisition. In addition to ensuring that image quality is adequate to achieve the clinical task being performed, the operator is responsible for dose management throughout the exam, not only for the safety of the patient but also for all staff members present. Understanding fluoroscopy imaging parameters and their effect on both image quality and dose is essential for anyone operating or supervising the operation of a fluoroscopy system.
An essential function of modern fluoroscopy systems is the continuous adjustment of X-ray tube output to maintain adequate image quality throughout the procedure. This feedback loop between the detection system and the X-ray tube is commonly referred to as automatic brightness control (ABC), referring to the goal of maintaining a constant brightness on the output phosphor of the image intensifier. 1 With the advent of digital detectors, this same concept is sometimes referred to as automatic dose control (ADC). Throughout this chapter, we will use the traditional term ABC.
1.1 Case 1: SID, ABC, and Radiation Output
1.1.1 Background
A patient undergoes a fluoroscopy-guided L1 kyphoplasty procedure to treat vertebral body compression.
At the start of the procedure, the operator places the image detector 10 cm above the patient.
In order to properly insert the cannula into the vertebral body, the operator has to raise the detector to 30 cm above the patient.
1.1.2 Findings
Increasing the distance between the X-ray source and the image detector increased the reported air kerma rate (AKR) by a factor of approximately 1.5.
1.1.3 Discussion
Patient dose is dependent on the source-to-image receptor distance (SID) which is the distance between the source of X-rays (the focal spot of the X-ray tube) and the image receptor. As SID changes, the fluoroscopy system adjusts acquisition parameters, directly affecting the radiation output. As discussed in the beginning of this chapter, the ABC algorithms used by fluoroscopy systems adjust tube output to maintain image appearance. For a fixed X-ray output, as the distance to the image receptor increases, the amount of radiation that reaches the image receptor decreases. For example, at an SID of 100 cm, only 25% as many X-ray photons will intercept the detector compared to an SID of 50 cm. To compensate for fewer photons reaching the receptor at larger SIDs, ABC algorithms increase X-ray tube output. Typically, this is done by changing one or more of the following parameters: kV, mA, pulse width, or beam filtration. This will result in an increase in reference air kerma (AK) and, assuming a constant distance between the X-ray source and the patient’s skin, an increase in patient dose. This is illustrated in Table 1‑1 where entrance dose to a phantom was measured under conditions of variable SID.
In addition, the distance between the X-ray source and the patient’s skin (known as the source-to-skin distance [SSD]) directly impacts patient dose. Dictated by the inverse square law, doubling the distance between the radiation source and an object will result in a reduction in exposure to that object by 75%. In the case described here, the increase in X-ray tube output can be calculated using the equation:

or 25%.
When determining how the patient and equipment should be positioned for an exam, one should consider the location(s) where the operator needs to directly access the patient, how much working space is needed between the patient and the detector, any special positioning needs of the patient, and operator ergonomic factors such as table height. While some of these factors are dictated by the needs of the specific exam and operator, ensuring that SID is as small as practical can help to reduce patient dose.
1.1.4 Resolution
The following steps can help reduce patient dose while maintaining affecting image quality. First, for fluoroscopic systems with fixed SID, as is the case with many mobile C-arms, the patient should be positioned as close to the image receptor (as far from the source) as is practical, given the needs of the procedure. Second, for fluoroscopic systems with variable SID, such as those used in interventional radiology or cardiac catheterization labs, patient positioning may be primarily dictated by the procedure being performed. Once the patient has been positioned and the fluoroscopy system is oriented as desired, the SID should be reduced as much as is practical by moving the image receptor toward the source.
1.2 Case 2: Reference Air Kerma and Skin Dose
1.2.1 Background
A patient undergoes a superior mesenteric arteriogram for embolization of a pseudoaneurysm in the transverse colon.
At the end of the exam, the total reference AK is 5100 mGy.
The case is referred to Radiation Safety so that a peak skin dose (PSD) estimate can be performed.
1.2.2 Findings
The estimated PSD is 7000 mGy, approximately 1.5 times the reference AK displayed by the fluoroscopy system.
1.2.3 Discussion
Fluoroscopy operators can monitor the use of radiation during procedures by paying attention to machine-reported dose metrics. All modern fluoroscopy systems are required to display the reference AK and reference AKR, where the reference AK is equivalent to the dose to air at a specific reference point. (The exact location of the reference point varies based on equipment vendor and model.) These values provide the operator with real-time dosimetry information throughout a case. Consequently, it is important to know how these values are measured and how they relate to patient exposure and patient skin dose, specifically.
For fluoroscopy procedures, the primary radiation safety concern for patients is the PSD, which is the maximum dose to any single area of the skin. It is notable that in this case, the estimated PSD is substantially greater than the AK reported by the machine. Patient skin dose is affected by several factors including table attenuation, backscatter, differences in how dose is deposited in various materials, and patient positioning. None of these factors are considered when the system calculates the displayed AK. While a thorough discussion is beyond the scope of this text, special attention should be paid to the effects of patient positioning, specifically SSD.
The most common reason for large differences between the displayed AK and the actual skin dose is patient size. In the case described here, the patient was morbidly obese, and the location where the X-ray beam entered the patient’s skin was much closer to the X-ray source than the location where the fluoroscopy system calculated the AK. As a consequence, the AK at the patient’s skin was greater than the reference AK. As the AK at the patient’s skin increases, skin dose will also increase.
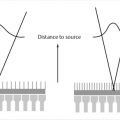
These concepts are illustrated in Fig. 1‑1. The X-ray tube is under the patient table with the X-ray focal spot (the source of the X-ray beam) indicated by a white “x.” The AK reference point (located 65 cm from the focal spot) is indicated by a black “x.” In Fig. 1‑1 a, the patient is closer to the X-ray tube than the AK reference point is. Here the entrance AK at the patient’s skin will be greater than the reference AK. The opposite happens in Fig. 1‑1 b, where the patient is farther from the source than the reference point. In this case, entrance AK will be lower than the reference AK. It should be noted that variation between the displayed AK and the entrance AK is governed by the inverse square law—as an object moves farther away from the source of radiation, the exposure decreases as a factor of the square of the distance. Consequently, entrance AK and actual patient skin dose may be larger or smaller than the reference AK.

The patient’s position relative to the AK reference point is not the only factor that affects the PSD. If, for example, the C-arm is rotated during the fluoroscopy exam, the dose will be “spread out” over different areas of the patient’s skin. Similarly, if the table or C-arm is translated so that the imaging field of view moves from the groin to the chest, the total AK displayed by the system will include radiation delivered to different portions of the skin. While any detailed PSD estimate should be performed by a qualified medical physicist, understanding the relationship between the displayed AK and patient skin dose and recognizing when these values are likely to diverge will allow the fluoroscopy operator to manage radiation dose during a procedure.
1.2.4 Resolution
If the AK reference point is at 65 cm from the focal spot, then the AK at 53 cm from the focal spot is (65/53) 2 or 1.5. This means that if the displayed AK is 5100 mGy, then the patient entrance AK will be approximately 7700 mGy. Other factors, such as attenuation of the X-ray beam by the table, backscatter generated by the patient, and a conversion of entrance skin exposure to absorbed skin dose must be considered to determine the PSD. However, entrance AK can be used as a reasonable surrogate for PSD when considering radiation management during a fluoroscopy procedure.
1.3 Case 3: Collimation
1.3.1 Background
Patient underwent a fluoroscopy-guided exchange of a retrograde left nephroureteral tube.
Two digital spot images were acquired during the procedure with different amounts of physical collimation.
1.3.2 Findings
Collimation was used to reduce the field of view (from 21.9 × 28.4 cm to 16.5 × 19.9cm; Table 1‑2).
Dose area product (DAP) was reduced by 47%.
Table 1.2 The collimated field size and dose metrics for the uncollimated and collimated images shown in Fig. 1‑2
Uncollimated (left)
Collimated (right)
Collimated field size
21.9 × 28.4 cm
(620 cm2)
16.5 × 19.9 cm
(328 cm2)
DAP (mGycm2)
446
278
AK (mGy)
1.3
1.3

Fig. 1.2 Digital spot images acquired without collimation (a) and with collimation (b).
1.3.3 Discussion
This case illustrates that collimation (also sometimes referred to as “coning in”) can reduce radiation exposure to both patients and staff and improve image quality. Collimation uses lead shutters inside the X-ray tube housing to reduce the imaging field of view. This enables one to image (and irradiate) only the patient anatomy essential for performing the procedure.
Changes in collimation will not substantially affect AK. However, collimation will affect DAP (sometimes called Kerma Area Product, or KAP) which is another dose metric that is commonly displayed on fluoroscopy systems. DAP is the product of AK and field size, so even if AK remains constant, DAP will change proportionally to the change in X-ray field size. For procedures using single fields (i.e., the position of the X-ray tube remains constant relative to the patient throughout the exam), this will not reduce the PSD substantially but will reduce the effective dose to the patient. For procedures with multiple fields, proper collimation can reduce the likelihood of having overlapping radiation fields and potentially reduce PSD. In addition, collimation can greatly reduce staff exposure since a smaller imaging field will produce less scatter radiation. Finally, proper collimation has the additional benefit of enhanced image quality. Collimated fields can be used to exclude very high- or low-attenuating tissues, reducing the variation in signal intensity across the field of view, which may improve image contrast. Moreover, since proper collimation reduces the amount of scatter created by patient tissue, images will appear with improved contrast (Table 1.2).
1.3.4 Resolution
In the example shown in Fig. 1‑2, the field of view was reduced from 21.9 × 28.4 cm (620 cm2) in Fig. 1‑2 a to 16.5 × 19.9 cm (329 cm2) in Fig. 1‑2 b; a reduction of 47%. DAP also decreased 47%, i.e., from 807 mGycm 2 (Fig. 1‑2 a) to 428 mGycm 2 (Fig. 1‑2 a). AK was the same for both images (1.3 mGy).
1.4 Case 4: Anti-scatter Grids
1.4.1 Background
A 5-year-old patient undergoes a fluoroscopy-guided cardiac procedure.
The patient had a similar procedure 6 months prior where the total AK was 450 mGy.
With a similar amount of fluoroscopy time and the same number of exposures, the AK for the current procedure was 1200 mGy.
1.4.2 Findings
The same fluoroscopy system and imaging protocol were used for both procedures.
The images for the prior procedure (Fig. 1‑3 a) have poorer image quality than the images from the later procedure (Fig. 1‑3 b).

Fig. 1.3 Fluoroscopy images of an anthropomorphic chest phantom without (a) and with (b) an anti-scatter grid.
1.4.3 Discussion
X-ray photons that reach the image detector are either primary or scattered photons. Primary photons travel along a straight path through the patient until they are absorbed by the detector. Scattered photons are those that have interacted with the patient’s tissue (or other objects) and have changed direction from their original path. Image quality is greatly influenced by the scatter-to-primary ratio (SPR) or the ratio of the amount of energy deposited in the detector by scattered versus primary photons. If a fluoroscopy system has an SPR of 3, this indicates that 75% of the energy deposited in the detector is from scattered photons while the remaining 25% is from primary photons.
As the SPR increases, low-contrast objects are more difficult to distinguish. Image quality can be improved by using an anti-scatter grid. The grids are made up of a series of septa made of lead or other X-ray-attenuating material, and these septa preferentially absorb scattered photons while allowing more of the primary photons to pass through. The grid is placed just in front of the image receptor, decreasing the SPR and improving image quality. Since the grid also absorbs some of the primary photons, the X-ray system must compensate by producing more photons (i.e., increasing mAs), which increases patient dose. A main determinant of how much scatter is produced in a specific patient is patient habitus. As the X-ray beam passes through additional tissue, the number of scatter events increases. In other words, thicker anatomy and larger patients will produce more scatter than smaller patients. Consequently, the anti-scatter grid has a substantial effect on image quality when imaging adult patients, but it has little effect when imaging extremities or small patients.
1.4.4 Resolution
Fig. 1‑3 shows an image of an anthropomorphic chest phantom. The image on the left ( Fig. 1‑3 a) was obtained without an anti-scatter grid whereas the image on the right ( Fig. 1‑3 b) was obtained with the grid in place. The effect on image quality is apparent by looking at the increase in detail visible in the image on the right (obtained using the grid.) However, for some clinical indications the image quality in Fig. 1‑3 may be sufficient. The acquisition parameters for the two images are also shown. The grid attenuates both primary and scatter photons, causing the ABC system to increase both kV and mA. As a result, the AKR increased by a factor of almost 3.
Removing the anti-scatter grid is a common way to reduce patient dose in fluoroscopy exams of pediatric patients, where image quality is not substantially affected. However, in most adult (or adult-sized) patients, the grid is required to achieve adequate image quality. It should be noted that while many fixed fluoroscopy systems have removable grids, most mobile C-arms have fixed grids that cannot be removed.
Stay updated, free articles. Join our Telegram channel

Full access? Get Clinical Tree


