1 Imaging Techniques
1.1 Introduction
Appropriate clinical interpretation of pediatric neuroradiologic studies requires an understanding of the imaging techniques they use. Only through this understanding can appropriate tests be performed and subsequently interpreted. A multitude of resources exist to provide this information, but a brief review follows, including several pediatric-specific considerations.
1.2 Radiographs (Plain-Film)
Plain-film evaluation is the foundation of radiology; however, it is not commonly used for modern evaluation of the central nervous system (CNS). Plain-film radiography is still used with shunt-series to detect discontinuity or atypical placement of cerebrospinal fluid (CSF) diversion tubing, such as a ventriculoperitoneal shunt (Fig. 1.1). In children, radiographs may still be appropriate for evaluation of the spine after trauma. Radiographic evaluation for skull fractures, craniofacial abnormalities, and calvarial suture development is sometimes performed, but its diagnostic performance is inferior to that of computed tomography (CT).

1.3 Ultrasonography
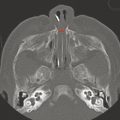
In the newborn period, sonographic evaluation of the intracranial contents can be performed through open fontanelles, most commonly the anterior fontanelle (Fig. 1.2). Evaluation through the posterior fontanelle can also be performed. Ultrasonography is also the primary screening tool for fetal imaging. These techniques, and the pathology evaluated, are further discussed in Chapter 5.

Transcranial Doppler ultrasonography is a technique of interrogation of flow velocities in branches of the circle of Willis and is used to identify abnormal blood-flow patterns in patients with sickle cell disease to determine the timing of transfusions. Ultrasonography is helpful in evaluating the soft tissues of the neck, including muscles, lymph nodes, cystic lesionsa, and infectious collections.
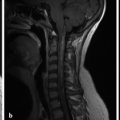
Prior to ossification of the posterior spinal elements (typically the first 3 months postnatally), the spinal cord can be evaluated with ultrasound to determine the position of the conus medullaris, thickness of the filum terminale, and motility of the cauda equina. Sacral dimples can also be evaluated with ultrasound, to identify the presence of dermal sinus tracts/pilonidal sinus tracts.
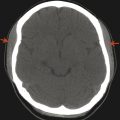
1.4 Computed Tomography
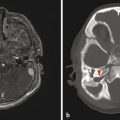
Computed tomography is a cross-sectional imaging technique that uses ionizing radiation, is widely available, and provides excellent osseous detail (Fig. 1.3). Soft tissue detail on CT is better visualized than with plain-film radiography but is limited in comparison to that provided by magnetic resonance imaging (MRI). Computed tomography is also the gold standard for detecting acute intracranial hemorrhage after trauma; however, modern MRI is more sensitive for detecting the chronic deposition of blood products/hemosiderin. Because CT is widely available and can be performed rapidly, usually without sedation, it is the mainstay imaging procedure for evaluating acute traumatic and infectious processes. Modern CT scanners can provide sagittal and coronal reformats, which significantly aid in the characterization of abnormalities in the pediatric head and are critical for imaging of the head and neck, as well as the spine. Three-dimensional (3D) reconstructions can be helpful in differentiating calvarial sutures from fractures, differentiating among craniofacial abnormalities, and characterizing complex dysraphisms of the spine.

The density detected on CT is related to the underlying electron density of the evaluated tissue. This is typically evaluated in a visual manner, but it can be evaluated quantitatively, with density values reported in Hounsfield units (HU); see Table 1-1. For CT, pure water is defined as having a density of 0 HU, and air is defined as having a density of –1000 HU.
Substance | Density (HU) |
Air | –1000 |
Fat | –200 to –30 |
Water | 0 |
Proteinaceous fluid | 10 to 30 |
Acute blood | 60 to 80 |
Muscle | ~80 |
Bone | ~600 to 1000 |
Metal | >1000 |
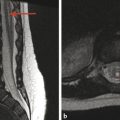
1.5 Magnetic Resonance Imaging
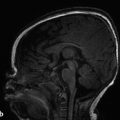
Magnetic resonance imaging provides the best noninvasive characterization of the central nervous system (CNS) and soft tissues of the head and neck (Fig. 1.4). Studies done with MRI must be tailored to the patient’s specific clinical symptoms, with the selection of specific imaging sequences and acquisition planes to highlight the suspected pathology. Because MRI is probably the most important tool in evaluation of the pediatric CNS, the basics of different MRI sequences are discussed below. Note that although CT measures electron density, MRI evaluation has more to do with the molecular constituents and the percent of protons that are in free water, proteins, and lipids. A “bright” signal in a given sequence is most accurately described as having a “hyperintense” and not a “hyperdense” appearance. Likewise, a “dark” signal is “hypointense.” Other terms related to a given sequence can be used; for instance, a hyperintense signal on T1 weighted (T1 W) imaging can be described as T1 shortening, and a hyperintense signal on T2 weighted (T2 W) imaging as T2 prolongation. A hypointense signal on T1W imaging is T1 prolongation, and a hypointense signal on T2W imaging is T2 shortening. Familiarity with these terms is helpful in understanding imaging reports produced by other persons, and in understanding journal articles and teaching resources, even if the reader does not choose to use “shortening” and “prolongation” in his or her reports (s. Tab.).

Substance | T1 W | T2 W | FLAIR |
Fat | Bright | Bright | Bright |
Water/CSF | Dark | Bright | Dark |
Proteinaceous fluid | Intermediate | Intermediate to bright | Intermediate |
Methemoglobin | Bright | Dark (extracellular) Bright (intracellular) | Variable |
Deoxyhemoglobin | Dark | Bright | Variable |
Hemosiderin | Dark | Dark | Dark |
Gray matter | Intermediate dark | Intermediate bright | Intermediate bright |
White matter (myelinated) | Intermediate bright | Dark | Dark |
White matter (unmyelinated) | Intermediate dark | Intermediate bright | Intermediate dark |
White matter (incompletely myelinated) | Intermediate bright | Intermediate | Variable/bright |
Magnetic resonance imaging uses powerful magnetic fields to manipulate hydrogen protons for obtaining diagnostic information. The stronger the magnet, the better the information obtained. Modern clinical imaging is performed with scanners having a high field strength, with a static magnetic field of either 1.5 or 3.0 teslas. Scanners with higher field strengths than this exist, most commonly for research purposes. Older scanners with lower field strengths still exist, but should only be used if a high-field-strength alternative is unavailable. There also exist “open” MRI scanners, which use a lower field strength and do not circumferentially encompass the area being scanned. Although the concept of an open scanner is appealing from a marketing standpoint, such scanners provide limited diagnostic information in many circumstances and should be avoided unless there is an absolute contraindication to standard MRI.
1.5.1 T1 Weighted Imaging
T1 weighted (T1 W) imaging is one of the two primary MRI sequences, and is related to the longitudinal relaxation of hydrogen protons. Fat, protein, melanin, and gadolinium are among substances that demonstrate T1 shortening (or “bright” signaling).
Related posts:
Stay updated, free articles. Join our Telegram channel

Full access? Get Clinical Tree


