Miscellaneous Conditions
Thomas H. Berquist
- Introduction
- Osteoporosis
- Generalized Osteoporosis
- Primary Osteoporosis
- Secondary Osteoporosis
- Imaging Features
- Regional and Localized Osteoporosis
- Disuse Osteoporosis
- Transient Regional Osteoporosis
- Imaging Features
- Complex Regional Pain Syndrome (Reflex Sympathetic Dystrophy Syndrome)
- Generalized Osteoporosis
- Rickets and Osteomalacia
- Renal Osteodystrophy
- Parathyroid Disease
- Thyroid Disorders
- Pituitary Disorders
- Paget Disease
- Bone Islands, Osteopoikilosis, Osteopathia Striata, and Melorheostosis
- Osteopetrosis
- Vitaminosis
- Heavy Metal Disorders and Transverse Metaphyseal Bands
- Hemoglobinopathies and Anemia
- Periostitis
- Primary Hypertropic Osteoarthropathy (Pachydermoperiostosis)
- Secondary Hypertropic Osteoarthropathy
- Vascular Insufficiency
- Differential Diagnosis
- Primary Hypertropic Osteoarthropathy (Pachydermoperiostosis)
- Soft Tissue Calcification and Ossification
- Sarcoidosis
- References
INTRODUCTION
Imaging of major diseases involving the foot and ankle is discussed in the preceding chapters. However, numerous conditions (e.g., systemic diseases, metabolic disease) may also affect the foot and ankle. In many cases, imaging of the foot and ankle is not performed for primary diagnostic purposes. However, radiographic changes do occur with these conditions. Therefore, it is important to be aware of the image features associated with these diseases in the foot and ankle.
OSTEOPOROSIS
Osteoporosis is the most common bone disease encountered in clinical practice. The Consensus Development Conference defined osteoporosis as a systemic skeletal disease characterized by low bone mass and microarchitectural deterioration with consequent increase in bone fragility and susceptibility to fracture [16,52]. Osteoporosis affects 75 million people in the United States, Europe, and Japan and results in about 1.5 million fractures annually in the United States [14,16]. In the United States, it is estimated that 10 million people have osteoporosis and an additional 18 million are at risk [52]. A recent study in the United Kingdom estimated that more than 200,000 fractures occur each year at a cost of £940 million. The lifetime risk for women was 33% and for men about 16% [23]. The list of potential causes of osteoporosis is lengthy (Table 11-1). In certain cases, the foot and ankle are not involved. Diagnosis of generalized forms of osteoporosis is usually based on bone mineral density changes in other areas of the skeleton. The lumbar spine, femur, wrist, and calcaneus are most commonly measured [2,11,12,14,17,25,30,34,43,49,52].
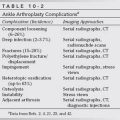
Osteopenia and osteoporosis have been defined by the World Health Organization based on comparison of bone mineral density of normal young adults (T-score). The most recent revision was accomplished in 2004 [56]. Normal bone mineral density is greater than −1.0. Osteopenia is defined as T-scores less than −1.0 but greater than −2.5. Osteoporosis is diagnosed when T-scores are less than −2.5 [16,36,38,52,56]. The radiographic features of osteoporosis vary with the type and extent of skeletal involvement, that is, generalized or local forms. Table 11-2 summarizes methods for measuring bone mineral density [16,19,36,43,56].
Generalized Osteoporosis
Generalized osteoporosis may be primary or secondary. The latter may be related to a long list of disorders (see Table 11-1) [4,21,36,50,52,56]. Generally, foot and ankle images are not required to establish the diagnosis; however, osteopenia of the foot and ankle does occur with these conditions. Therefore, they deserve mention, especially from a differential diagnostic standpoint.
Primary Osteoporosis
This is the most common cause of generalized osteoporosis [16,53,56]. The risk of fracture in women older than 50 years of age approaches 60% without medical therapy [38]. Similar osteoporotic changes occur in men older than age 60 years [16,45,53]. Primary osteoporosis is categorized as Type I (postmenopausal or osteoclastic) or Type II (senile and osteoblast mediated). Type I affects females six times more commonly than males. Type I osteoporosis affects females from 48 to 52 years of age. There is rapid bone loss with fractures occurring primarily in the wrist and hip [52]. Type II osteoporosis is also more common in females (F:M = 2:1) and is related to aging, increased bone loss, and decreased bone production [52]. Many patients are asymptomatic, but back pain may develop in the presence of early vertebral body compression. Serum calcium (Ca2+), phosphorus, alkaline phosphatase, and acid phosphatase levels are normal. Urine Ca2+ and phosphorus values are also generally normal [16,45,53].
Secondary Osteoporosis
Secondary osteoporosis can result from numerous conditions (see Table 11-1) [52,56]. Endocrine disorders are the most common cause of secondary osteoporosis. Osteoporosis may also be related to diseases of the pituitary, adrenal, thyroid, ovaries, testes, and pancreas. The five most common endocrine disorders are hypogonadism, insulinopenia, hyperparathyroidism, hyperthyroidism, and hypercortisolemia [42]. Nonendocrine tumors may also secrete hormone-like substances, thus leading to osteoporosis [32,42].
Increased levels of cortisol can occur with Cushing syndrome (adrenal neoplasm or hyperplasia) or exogenous use of steroids. Cushing disease is due to a corticotropin (ACTH) producing basophilic adenoma of the pituitary. Similar elevations in cortisol can occur, with ACTH producing extraendocrine neoplasms. The association of these conditions with osteoporosis is well known. Most patients have osteoporosis related to steroid therapy for inflammatory diseases or organ transplants [32,42]. Steroids have direct and indirect effects on bone. Factors include decreased Ca2+ absorption, increased osteoclastic activity, decreased matrix formation, and retarded osteoblastic formation [16,32,42].
Osteoporosis may also occur in hyperthyroidism. Osteopenia is most likely due to an imbalance in osteoclastic and osteoblastic activity. Although both are increased, the osteoclastic response predominates. Patients may have significant elevation of serum alkaline phosphatase and, occasionally, increased serum Ca2+ [42]. Parathyroid dysfunction also affects bone remodeling. Hypoparathyroid disorders do not result in osteoporosis. Hyperparathyroidism results in imbalance of bone remodeling that affects areas of the skeleton differently. Although most patients demonstrate osteopenia, osteosclerosis may also occur [32,42].
Diabetes mellitus is one of the most common endocrine disorders. Patients with Type 1 (insulin-dependent) diabetes have diminished bone mineral density in the spine and, to a lesser degree, the extremities. Diabetic osteoporosis may be related to insulin receptors in bone and the action of insulin as a skeletal growth factor. Complications related to diabetes mellitus also play a role in reducing bone mass [42].
Other causes of generalized osteopenia (see Table 11-1) are also reported. The mechanisms are not always clearly understood [3,7,16,42,52].
Imaging Features
Imaging studies of generalized osteoporosis have focused on the spine, femur, forearm or wrist, and calcaneus [2,5,6,16,19,20,36,37,41,49,52]. From 30% to 50% of skeletal mineral must be lost before changes are evident radiographically. Radiographs initially show diminished bone density or a more radiolucent appearance. This is often interpreted as demineralization or osteoporosis. However, radiographs cannot adequately differentiate osteoporosis, osteomalacia, and other causes of reduced bone density. Therefore, when interpreting radiographs, it is more appropriate to use the term osteopenia (poverty of bone) [2]. Cortical thinning may be evident due to endosteal resorption. However, this is nonspecific and can be seen with other metabolic disorders [41]. In generalized osteoporosis, the vertebral bodies become osteopenic, and progressive biconcavity of the end plates occurs with or without compression fractures. The appearance is generally not useful in isolating the cause. An exception to this general rule is condensation of end plates associated with steroid-induced osteoporosis [2,16,24].
In the early years, attempts were made to use the calcaneus as a measure of the degree of osteoporosis [1,8,27,34]. Aggarwal et al. [1] studied 200 calcaneal radiographs and correlated the trabecular pattern with the Singh index in the hips in the same group of patients. In patients with osteoporosis, the calcaneal secondary tensile and compressive trabeculae are resorbed before the primary trabeculae. However, calcaneal radiographs are not commonly used because they are less sensitive, do not correlate well with spine density studies, have an error rate of more than 25%, and are significantly affected by the patient’s weight and activity levels [8,27]. There is also a significant variation in observers, thereby making repeated evaluations difficult to correlate [8]. Calcaneal indices have given way to more accurate methods such as dual-energy X-ray absorptiometry (DXA) and calcaneal ultrasound [2,11,20,28,36,43].
DXA is most commonly used today to evaluate patients with bone loss and to evaluate response to therapy. The spine (frontal and lateral), hip, and radius can be included in the study. This technique offers the advantages of less radiation than CT, short scan times, excellent precision (1%), and stable calibration [36,52,56]. Patients’ data are compared with age-matched controls (Z-score) and young normal subjects (T-scores). Results are considered normal if they are less than 1 standard deviation below the mean (T-score higher than –1.0). T-scores of –1.0 to –2.5 indicate osteopenia (low bone mass), and when scores are lower –2.5, they indicate osteoporosis. This technique is used to evaluate fracture risk and to establish and monitor therapy in patients with osteoporosis [36,52].
Computed tomography (CT) can also be used to measure bone mineral density in the spine, hip, forearm, and tibia [19,52]. Although quantitative CT was an effective technique, it has been replaced by more advanced techniques. Volume quantitative CT provides microstructure detail for trabecular bone [19]. There is still ongoing research dealing with spatial resolution, radiation dose, expense, and availability of this technique [19].
Calcaneal ultrasound has also been used to evaluate bone density and architecture [12,15,24,28,52]. Numerous reports have used an Achilles device (LUNAR Corp., Madison, WI) to measure speed of sound (SOS), broadband ultrasound alteration (BUA), and stiffness. The latter is calculated using the mean BUA and SOS ([0.67 × BUA – 0.28 × SOS – 420]) [11,12,15,17,24,28,35,43]. This technique has several advantages over DEXA. The equipment is portable, it is more readily available, and the technique is less expensive than DEXA [16]. Therefore, ultrasound is potentially more efficacious as a screening technique for osteoporosis [16,43]. However, to date, precision is reduced compared with DEXA, and values obtained using calcaneal ultrasound correlate moderately with DEXA values in the spine and femur [12,14,43]. Ultrasound may be used as an alternative to screen certain patients before considering DEXA. If results of ultrasound studies are normal, no further studies are required. Equivocal cases can be referred for DEXA studies.
Magnetic resonance imaging has also been evaluated as a method for evaluating osteoporosis. Grampp et al. [20] compared MR with quantitative CT and DEXA. Using the section (2-mm), axial images with a repetition time of 67 msec and echo times of 7, 10, 12, 20, and 30 msec and a flip angle of 90° gradient-echo sequence, a T2* map was created to calculate relaxation times. Data correlated well with quantitative CT and DEXA values.
More recently, MR has been evaluated for study of trabecular architecture in the tibia, femur, radius, and calcaneus [37]. The utility of MR for evaluation of osteoporosis continues to evolve and may improve significantly with new 3T and 7T systems [37]. MR techniques may prove to be very useful, but it is difficult to imagine that cost and scanner availability will result in common clinical usage of this method in the near future with health care reform on the horizon.
Regional and Localized Osteoporosis
Osteoporosis may be more localized, affecting single or multiple osseous structures or periarticular regions. These changes typically occur in the appendicular skeleton (see Table 11-1).
Disuse Osteoporosis
Disuse or immobilization osteoporosis is common in the foot and ankle. This condition most frequently follows trauma and develops during cast immobilization and non–weight-bearing. The changes are reversible once weight bearing and stress are induced after the period of immobilization [31,41].
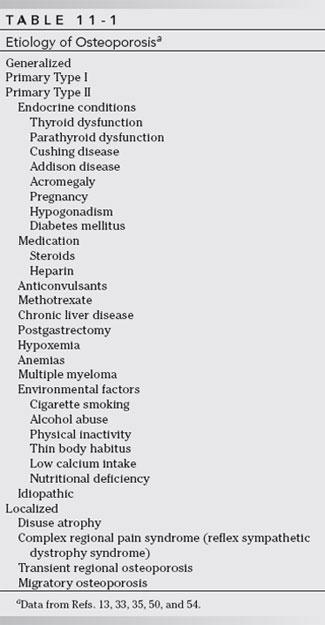
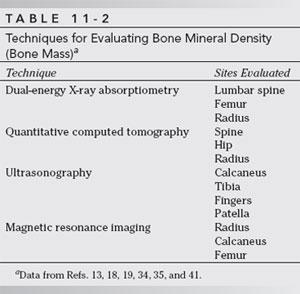
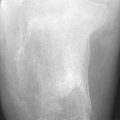
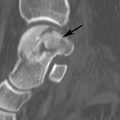
Radiographic features of disuse osteoporosis occur approximately 4 to 8 weeks after immobilization or reduced use of the involved extremity. Osteopenia may be evident sooner in younger patients (less than 20 years of age) and in adults more than 50 years old [31]. In paralyzed patients, bone changes are usually not evident for about 3 months. Several radiographic patterns of disuse osteoporosis have been described. Uniform osteopenia is most common (Fig. 11-1). Other patterns include juxta-articular osteopenia, small areas of periarticular lucency, subchondral lucency (Fig. 11-2), and lucent areas in the cortex, subperiosteal, and endosteal regions (Fig. 11-3) [31]. The last pattern may be difficult to differentiate from infection and neoplasm [32,39].
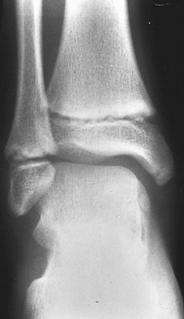
FIGURE 11-1 A) Normal pediatric ankle showing normal bone density. B) Mortise view of the right ankle 4 weeks after cast immobilization demonstrates disuse osteopenia and a healing physeal fracture (open arrow) with periosteal new bone (arrow).
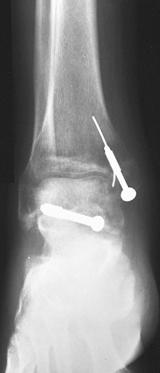
FIGURE 11-2 AP radiograph of the ankle 8 weeks after internal fixation of the medial malleolus and talus. Note the patchy metaphyseal osteopenia in the tibia with subchondral lucency at the tibiotalar joint. This feature is absent in the lateral articular aspect of the talus (Hawkins sign; see Chapter 4) because of early avascular necrosis.
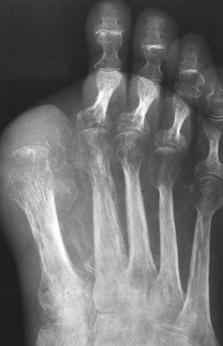
FIGURE 11-3 AP radiograph of the foot. The great toe was amputated in this diabetic patient because of ischemia and soft tissue ulceration. Patchy osteopenia and medial cortical involvement in the first metatarsal are noted. There is also cortical thinning in the second metatarsal with juxta-articular osteopenia of the metatarsophalangeal joints.
Features similar to disuse osteoporosis can be identified with infection and other inflammatory arthropathies. The cause in these situations is most likely increased bone resorption [41].
Transient Regional Osteoporosis
Transient regional osteoporosis consists of two major categories: transient osteoporosis of the hip and regional migratory osteoporosis of symptom complexes [9,10,13,22,29,41,51]. Regional migratory osteoporosis commonly involves the foot and ankle. Although the cause is unclear, mechanical factors affecting nerve conduction have been described in the foot. Byrd et al. [8] demonstrated nerve involvement from tarsal tunnel compression as a cause of regional migratory osteoporosis. Some consider this condition a variant of complex regional pain syndrome (CRPS) (reflex sympathetic dystrophy) [29]. Regional migratory osteoporosis frequently affects men (male-to-female ratio, 3:1) in the fifth and sixth decades [9]. One third of female patients in the series of Tannenbaum et al. [51] were pregnant when symptoms began. Patients present with a rapid onset of pain and swelling of one of the joints of the lower extremity (hip, knee, foot, and ankle). Symptoms typically last for 6 to 9 months. When symptoms resolve in the first joint, the adjacent joint typically becomes involved. This may occur immediately or following a symptom-free period of up to 2 years [3,9,41]. Laboratory studies are usually normal, although slight elevation of the erythrocyte sedimentation rate has been reported [10].
Imaging Features
Radiographic findings are usually not apparent for 3 to 6 weeks [9,29,41]. Juxta-articular osteopenia with extension beyond the epiphysis into the metaphysis and even the diaphysis of the involved skeleton is common. The same patterns of bone involvement noted earlier may be applied in regional migratory osteoporosis. Wavy periosteal reaction may also be noted [9,41]. With the zonal and radial patterns, the distribution of osteopenia is more localized. In any of the foregoing variants, the joint spaces remain normal, and no erosive changes occur. Although symptoms may subside in 6 to 9 months, the radiographic changes persist longer, particularly when cortical changes are present. Return to normal cortical thickness may take up to 2 years [9].
Changes can be identified earlier using isotope bone scans. Increased uptake of radionuclide usually extends well beyond the joint, a feature that is useful in differentiating regional or transient osteoporosis from other articular disorders [9,38,44]. To date, MR has not been used extensively for evaluating osteoporosis. Marrow signal intensity may be normal or similar to bone marrow edema pattern [6,9]. The edema pattern demonstrates decreased signal intensity on T1-weighted sequences and is increased on T2-weighted sequences (Fig. 11-4) [6,9].
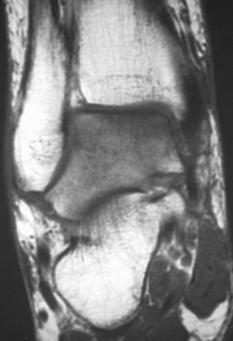
FIGURE 11-4 T1-weighted coronal image demonstrates diffuse decreased signal intensity in the talus consistent with local edema or regional osteoporosis.
Complex Regional Pain Syndrome (Reflex Sympathetic Dystrophy Syndrome)
Many terms have been used to describe this syndrome including Sudeck atrophy, causalgia, shoulder-hand syndrome, and posttraumatic osteoporosis [18,40,41,46,48,55,56]. The recently revised terminology for this symptom complex is complex regional pain syndrome [26,55,56]. Complex regional pain syndrome (CRPS) is the preferred term to reduce confusion and was coined by the International Association of Pain [26]. Two subtypes are included in the classification. Type I has no clearly defined peripheral nerve injury and Type II has a clearly defined peripheral nerve injury [26].
This condition is discussed in Chapter 4, but it deserves mention again because the radiographic changes include this process in the causes of regional osteoporosis. CRPS usually follows trauma, which may be minor. Patients typically present with pain, swelling, and reduced range of motion in the foot and ankle. Vasomotor instability, trophic skin changes, and patchy or aggressive appearing osteopenia are evident (Fig. 11-5) [18]. Bone scan findings demonstrate marked increase in flow and periarticular uptake (Fig. 11-5C–E)[18,26,41].
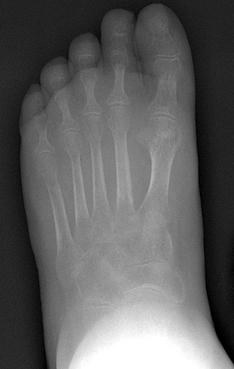
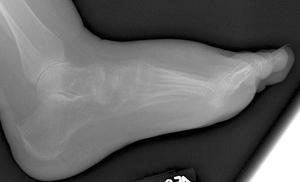

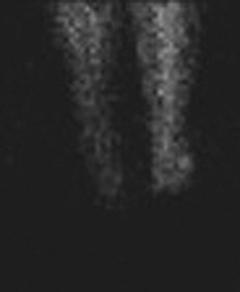
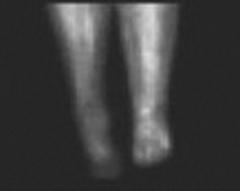
FIGURE 11-5 Complex regional pain syndrome. AP (A) and lateral (B) radiographs demonstrate soft tissue swelling and advanced osteopenia. Images from a three phase technetium-99m MDP bone scan (C,D) and blood pool image (E) demonstrate the increased uptake in the foot and ankle.


Stay updated, free articles. Join our Telegram channel

Full access? Get Clinical Tree


