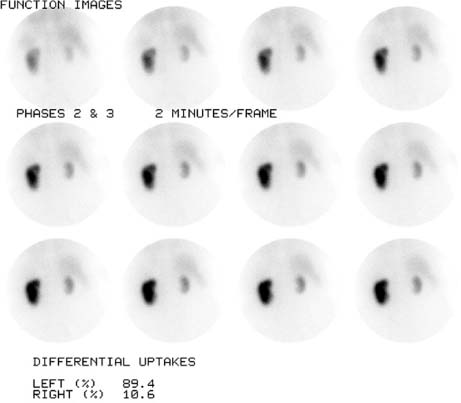
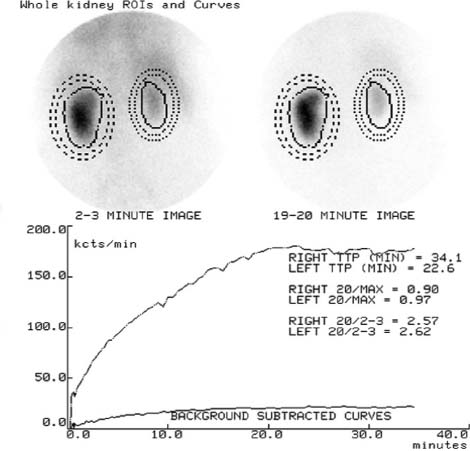
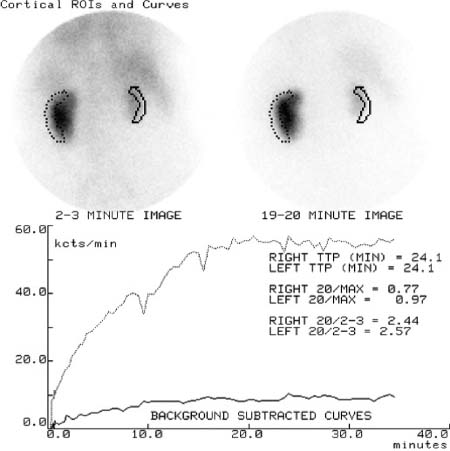
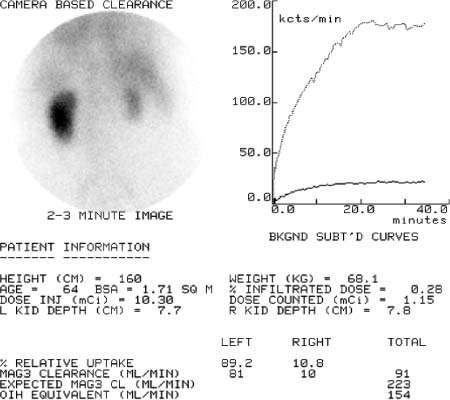
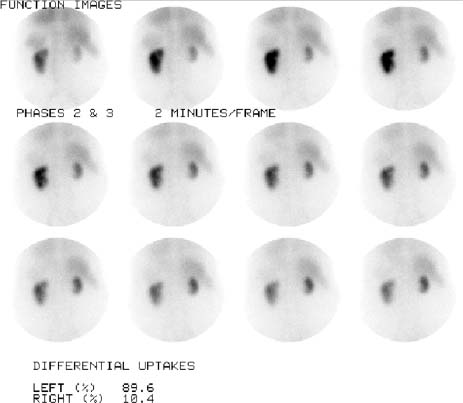
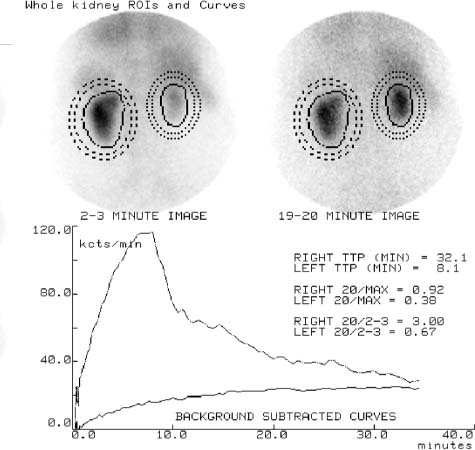
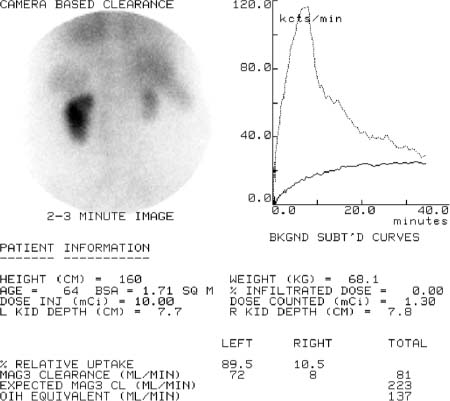
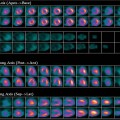
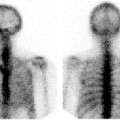
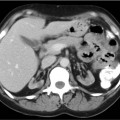
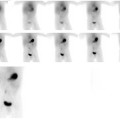
CASE 119 A 65-year-old woman presents with a history of peripheral vascular disease and hypertension. During the last year, her blood pressure has been increasingly difficult to control. She is now taking three antihypertensive drugs in high doses. Fig. 119.1 Fig. 119.2 Fig. 119.3 Fig. 119.4 Fig. 119.5 Fig. 119.6 Fig. 119.7 Fig. 119.8 • A 4 to 12 mCi dose of 99mTc-MAG-3 is administered intravenously 1 hour after 50 mg of captopril (Figs. 119.1, 119.2, 119.3, and 119.4). • A baseline study is done 5 days later (Figs. 119.5, 119.6, 119.7, and 119.8). • The patient should be hydrated before imaging for both studies. • Administer 25 to 50 mg of crushed (to ensure absorption) captopril 1 hour before imaging. • Blood pressure measurements should be taken at 15- to 30-minute intervals between the administration of captopril and the start of imaging. • Use a low-energy, general-purpose collimator. • Centered at 140 keV. • Imaging time is a dynamic sequence: 24 frames at 2 seconds per frame, 16 frames at 15 seconds per frame, and 60 frames at 30 seconds per frame. Functional images from the captopril study (Fig. 119.1) show that the left kidney is of normal size with an inhomogeneous parenchymal distribution in the form of reduced tracer in the upper third. The renal collecting system is not visualized. The right kidney appears very small, but homogeneously functioning parenchyma is present. No collecting system details are identifiable. The functional whole-kidney and cortex curves (Figs. 119.2 and 119.3) are very abnormal. The left-kidney curves are of continuous accumulation type; the right-kidney curves have very low amplitude and appear flat. Total function is markedly reduced (Fig. 119.4), and 99mTc-MAG-3 clearance is 91 mL/min, or 34% of expected (Table 119.1). Functional images of the left kidney in the baseline study (Fig. 119.5) are similar to the images with captopril, but the collecting system is now visualized (from frame 4 forward). The functional whole-kidney and cortex curves (Figs. 119.6 and 119.7) for the left kidney now show a distinct peak and clear elimination. The right-kidney curves are very similar to the curves seen during captopril challenge. Total function is markedly reduced (Fig. 119.8), and 99mTc-MAG-3 clearance is 81 mL/min (Table 119.2). The marked increase in time to maximum and the increase in cortical retention during captopril challenge compared with baseline are diagnostic for functionally significant renal artery stenosis or renovascular hypertension on the left side.
Clinical Presentation
Technique
Image Interpretation
Stay updated, free articles. Join our Telegram channel

Full access? Get Clinical Tree


