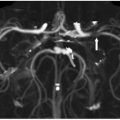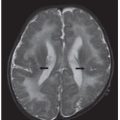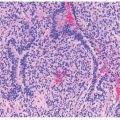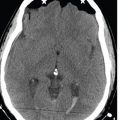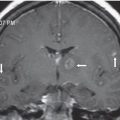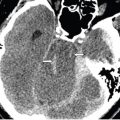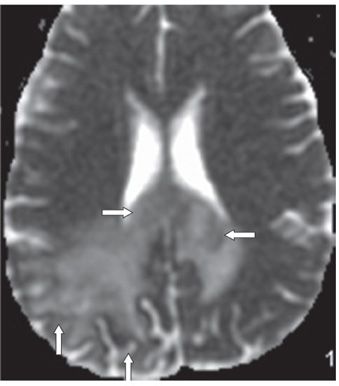
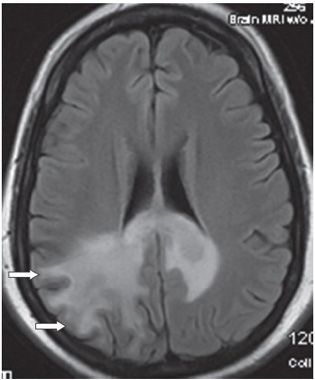
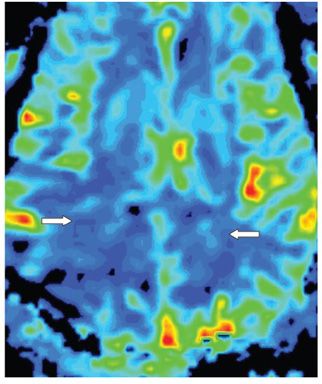
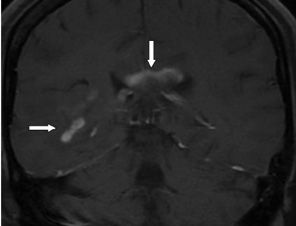
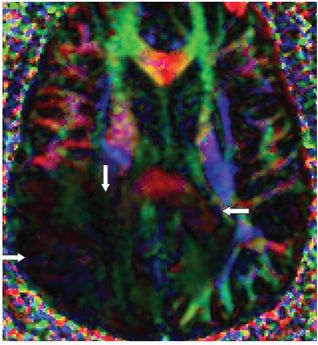
FINDINGS Figures 14-1 and 14-2. Axial DWI with ADC map through the corpus callosum (CC) and bilateral forceps major showing confluent asymmetric bilateral hyperintensity larger on the right than left crossing the splenium of the CC. There is involvement of the subcortical U fibers on the right (vertical arrows in Figure 14-2). Some areas of subtle restricted diffusion are seen within the splenium of CC (transverse arrows) in Figure 14-2. Figure 14-3. Axial FLAIR through the same level showing splenium and bilateral forceps major confluent hyperintensity surrounding isointense core extending into the subcortical region on the right (arrows). There is no significant mass effect. Figures 14-1 to 14-3 show enlargement of the splenium. Figure 14-4. Axial MRI perfusion relative Cerebral Blood volume (rCBV) map through the lesion showing low blood volume in the splenium and bilateral forceps major (arrows). Figure 14-5
Stay updated, free articles. Join our Telegram channel

Full access? Get Clinical Tree


