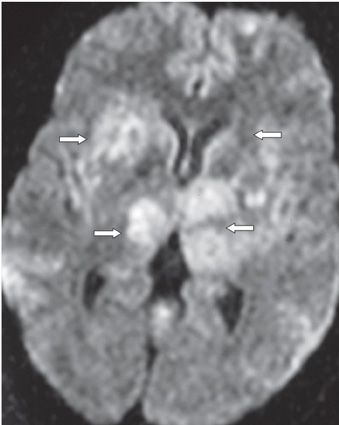
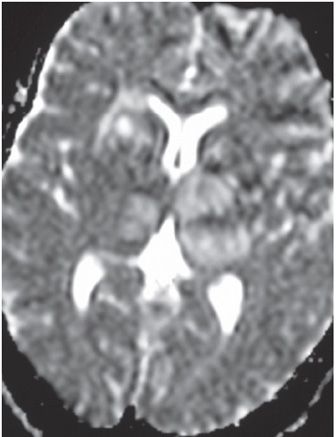
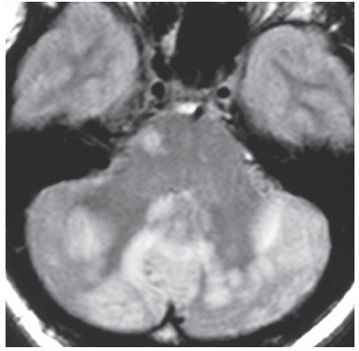
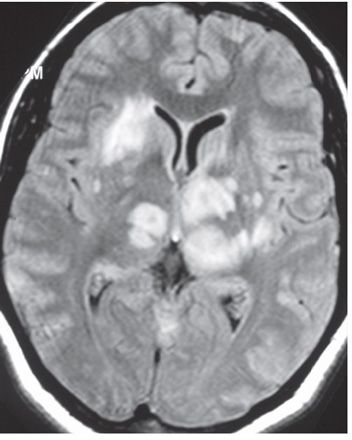
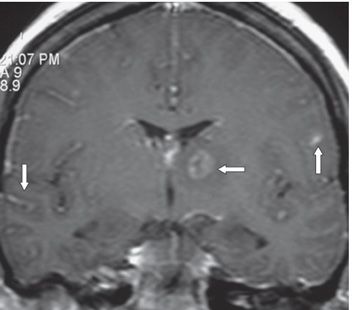
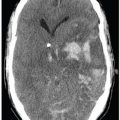
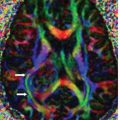
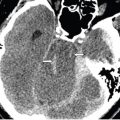
FINDINGS Figure 148-1. Axial NCCT through the basal ganglia. There are multifocal patchy hypodensities in bilateral thalami, basal ganglia, frontal, and peritrigonal white matter (WM). Similar hypodensity is present in the cerebellum (arrow). Figures 148-2 and 148-3. Axial DWI and ADC map through basal ganglia. There are multiple bilateral thalamic/basal ganglia (arrows), subcortical/cortical frontal, and posterior temporal hyperintense (non-diffusion restricting) masses of varying sizes with minimal local mass effect. Figures 148-4 and 148-5. Axial FLAIR through the posterior fossa (Figure 148-4) and through the bilateral basal ganglia (Figure 148-5

Stay updated, free articles. Join our Telegram channel

Full access? Get Clinical Tree


