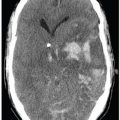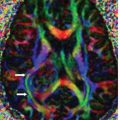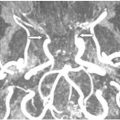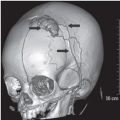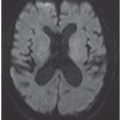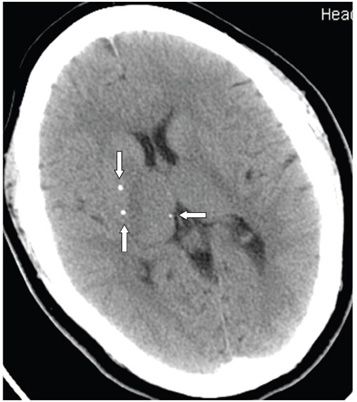
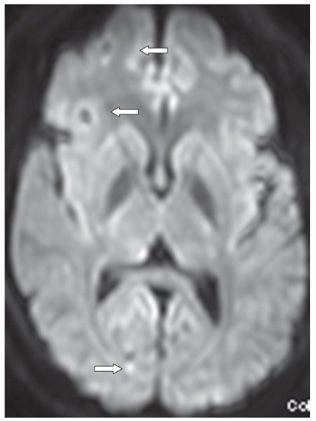
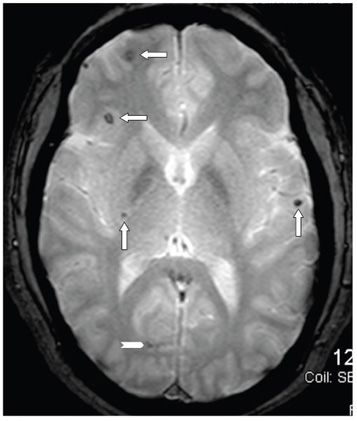
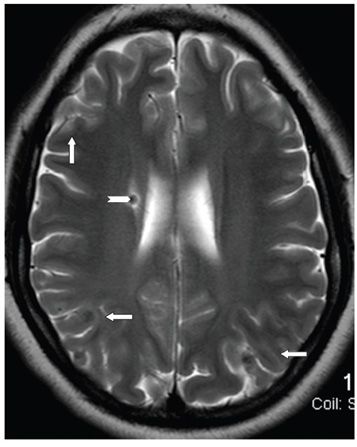
FINDINGS Figures 163-1 and 163-2. Axial NCCT through two different levels of the brain showing multiple small round hyperdense lesions, calcifications, mostly in cortical/subcortical locations of bilateral cerebral hemispheres (arrows in Figure 163-1). Two punctate calcifications are located in the right lentiform nucleus (vertical arrows in Figure 163-2). A tiny cortical right thalamic calcification is demonstrated in Figure 163-2 (transverse arrow). There is no obvious surrounding edema or contrast enhancement on post-contrast images. Figure 163-3. Axial DWI through the level of the thalamus. There are two punctate hypointense lesions in the right frontal gray–white matter junction laterally with surrounding zone of hyperintensity (arrows). The two lesions are represented by focal hypointense lesions with surrounding hyperintense halo (possibly gliosis or edema) on the axial GRE image through same level in Figure 163-4 (transverse arrows). A few other similar lesions are demonstrated in the right lentiform nucleus and left operculum (vertical arrows). Bilateral parietal cortical hypointense lesions are less well visualized on the axial T2WI (Figure 163-5
Stay updated, free articles. Join our Telegram channel

Full access? Get Clinical Tree


