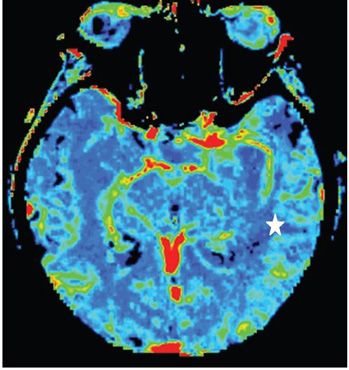
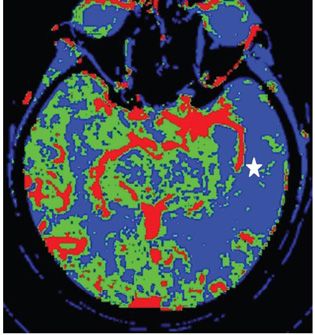
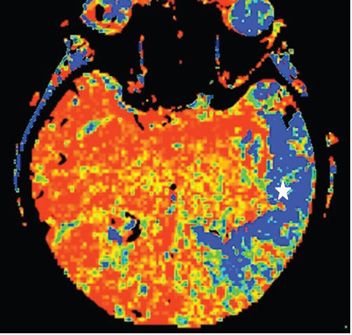
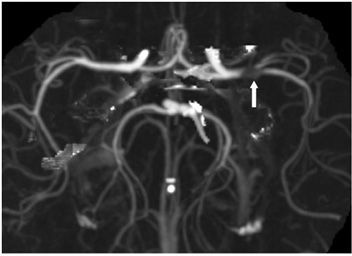
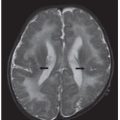
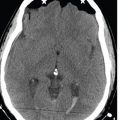
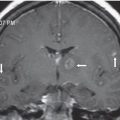
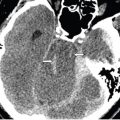
FINDINGS Figure 18-1. Axial NCCT through the temporal lobes before CT perfusion (CTP). There is normal appearance of the temporal lobes without infarct. Figure 18-2. Axial CTP blood volume color map through the temporal lobes. There is very minimal if any diminution in cerebral blood volume (CBV) in the left temporal lobe (star) compared with the right. Figure 18-3. Axial CTP blood flow color map through the temporal lobes. There is significant diminution in the left temporal lobe cerebral blood flow (CBF) (star) compared with the right. Figure 18-4. Axial CTP mean transit time (MTT) color map through the temporal lobes. There is prolonged MTT (star) through the left temporal lobe compared with the right. Figure 18-5. MIP CTA of the head. There is a filling defect in the left middle cerebral artery (MCA) bifurcation (arrow), a saddle embolus. There is minimal attenuation or reduced caliber of some left MCA branches compared with the right suggesting diminished blood flow.
DIFFERENTIAL DIAGNOSIS Acute infarct left MCA territory, ischemia left MCA territory.
DIAGNOSIS Ischemia without infarct left MCA territory.
DISCUSSION

Stay updated, free articles. Join our Telegram channel

Full access? Get Clinical Tree


