FIGURE 1-63 Illustration of muscles for plantar flexion.
Dorsiflexion is assisted by all muscles crossing the anterior ankle but primarily the tibialis anterior (Fig. 1-64). In the dorsiflexed position, the calcaneus is in slight valgus position and the talus is rotated laterally [40,54,100]. The fibula also rotates laterally, creating some widening of the anterior syndesmoses [88,100].
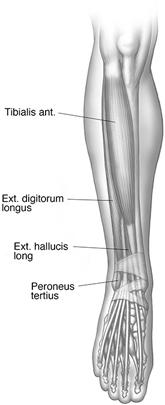
FIGURE 1-64 Illustration of the muscles used during dorsiflexion of the foot.
Inversion of the foot occurs when the medial aspect of the foot is elevated and the lateral aspect is depressed (see Figs. 1-62 and 1-65) [40,54]. The motion occurs in the subtalar joint and also in the calcaneocuboid and talonavicular joints (predominantly the talocalcaneonavicular) [13,24,54].
Muscles involved in inversion of the foot include the tibialis posterior, the flexor digitorum longus, and the flexor hallucis longus (see Fig. 1-65). The tibialis anterior and the extensor hallucis longus are involved to a lesser degree [13,24,54].
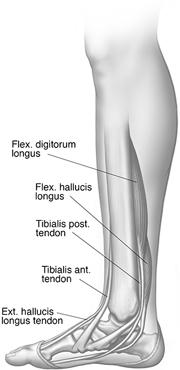
FIGURE 1-65 Illustration of the muscles used during inversion.
Eversion of the foot occurs when the medial plantar surface is depressed and the lateral surface is elevated (Figs. 1-62 and 1-66) [40,54]. Muscles involved in eversion include the peroneus longus, the peroneus brevis, the peroneus tertius, and the extensor digitorum longus [8,40]. The degree of motion that can be achieved with inversion exceeds that of eversion. This is largely because of the increased motion of the subtalar and talonavicular joints medially compared with the calcaneocuboid and tibiofibular articulations laterally [40,41,76]. Adduction indicates medial and abduction lateral motion of the forefoot [24,40,54]. Eversion generally accompanies significant abduction movements and inversion is associated with adduction of the foot. Ankle motion is also generally associated, so that plantar flexion accompanies inversion-adduction and dorsiflexion accompanies eversion-abduction movements [40]. Tables 1-1 and 1-2 summarize muscles involved in abduction and adduction.
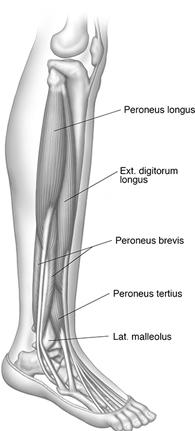
FIGURE 1-66 Illustration of the muscles used during eversion.
As noted above, the terms supination and pronation are generally applied to the wrist and forearm (see the foregoing definitions). During supination, the radius rotates around the ulna so that the palm of the hand faces superiorly. In pronation, the hand and forearm are rotated so that the palm of the hand is directed inferiorly. Lauge-Hansen [45,46] applied these terms to the foot as well. Supination is combined adduction of the hindfoot and inversion of the forefoot. Pronation was defined as abduction of the hindfoot and eversion of the forefoot [40,45,46]. Kelikian and Kelikian [40] stated that active pronation is difficult unless the forefoot is abducted and the ankle dorsiflexed. This is because of the lateral articulations of the calcaneus and midfoot, which do not permit intercalary motion. Limited supination of the foot is more easily accomplished owing to the rotatory motion possible in the medial articulations. This motion is similar to inversion. Thus, supination and pronation are combined motions that, although strictly incorrect, are most similar, and these terms are often interchangeably used with inversion and eversion, respectively [40].
A complete discussion of the phases of gait is beyond the scope of this chapter. These data are available in other sources [13,34,40,54,88,90,99,100]. The normal gait evolves rapidly with heel strike and reciprocal upper extremity swing by 18 months of age [99,100]. The adult gait is achieved as early as 3 years of age [40].
The basic gait cycle and forces on the foot and ankle are walking, running, and sprinting, with the phases of the cycle having different lengths. With normal gait, the walking cycle begins with the calcaneus or heel striking the ground and reaches completion when the same heel strikes the ground a second time [13,54]. The cycle has stance and swing phases with double limb support during the initial 10% of the stance phase and single limb support for approximately 50%. The swing phase makes up 40% of the gait cycle [54,98]. Stability during gait is provided by the subtalar joint, the transverse tarsal joint, the talonavicular joint, the plantar aponeurosis, and the foot muscles (see Table 1-2).
The subtalar joint acts as a link between the foot and the lower extremity. When abnormalities such as tarsal coalition are present, the normal motion of the subtalar joint is restricted, increasing the stresses on the foot and ankle [41]. Similar stresses occur in patients with pes planus and pes cavus deformities [54].
The transverse tarsal joint consists of the talonavicular and calcaneocuboid articulations. Its function also depends on normal subtalar motion [54,98]. Stability of these joints is important in allowing one to maintain the toe-to-ground relationship with the toes dorsiflexed during gait [54].
The talus is engaged in the navicular during the liftoff phase of motion when the ball of the foot is in contact with the ground. The plantar aponeurosis that extends from the calcaneus to the proximal phalanges also plays an important stabilizing function during this portion of the gait cycle. The muscles of the foot assist in stabilization during both phases of the cycle, playing a complementary role with the aponeurosis in elevating the longitudinal arch [13,54,98].
REFERENCES
- Arey LB. Developmental Anatomy. Philadelphia, PA: W.B. Saunders; 1974.
- Agur AMR, Dalley AF. Grant’s Atlas of Anatomy. 12th ed. Philadelphia, PA: Lippincott Williams & Wilkins; 2008.
- Anwar R, Anjum SN, Nicholl JE. Sesamoids of the foot. Curr Orthop. 2005;19:40–48.
- Bancroft LW, Morrison WB. Ankle/Foot. In: Bancroft LW, Bridges MD, eds. MRI: Normal Variants and Pitfalls. Philadelphia, PA: Lippincott Williams & Wilkins; 2008:551–578.
- Bencardino JT, Rosenberg ZS. MR imaging and CT in the assessment of osseous abnormalities of the foot and ankle. MRI Clin North Am. 2001;9:567–578.
- Benjji FJ, Jahss MH. Le Double’s study of muscle variations of the human body. Part II: muscle variations of the foot. Foot Ankle. 1986;6:157–176.
- Bernaerts A, Vanhoenacker FM, Van de Perre S, et al. Accessory navicular bone: not such a normal variant. JBR-BTR. 2004;87:250–252.
- Berquist TH, Morrey BF, Cass JR. Foot and ankle. In: Berquist TH, ed. Imaging of Orthopedic Trauma. 2nd ed. New York: Raven Press; 1992:453–578.
- Boyd N, Brock H, Meier A, et al. Extensor hallucis capsularis: frequency and identification on MRI. Foot Ankle Int. 2006;27:181–184.
- Burman MS, Lapidus PW. The functional disturbances caused by inconstant bones and sesamoids of the foot. Arch Surg. 1931;22:936–975.
- Cheung YY, Rosenberg ZS, Ramsinghavi R, et al. Peroneus quadratus muscle. MR imaging features. Radiology. 1997; 202:745–750.
- Coughlin MJ, Mann RA, Saltzman CL. Surgery of the Foot and Ankle. Philadelphia, PA: Elsevier/Saunders; 2007.
- Czerniecki JM. Foot and ankle biomechanics in walking and running. J Phys Med Rehabil. 1988;67:246–252.
- Davies MB, Abdlslam K, Gibson RJ. Interphalangeal sesamoid bones of the great toe: an anatomic variant demanding careful scrutiny of radiographs. Clin Anat. 2003;16:520–521.
- Davies MB, Dalal S. Gross anatomy of the interphalangeal joint of the great toe: implications for excision of the plantar capsule accessory ossicles. Clin Anat. 2005;18:239–244.
- Dokter G, Linclau LA. The accessory soleus muscle. Symptomatic soft tissue tumor or accidental finding. Neth J Surg. 1981;33(3):146–149.
- Dunn AW. Anamolous muscles simulating soft tissue tumors in the lower extremities. J Bone Joint Surg Am. 1965;47: 1397–1400.
- Ebraheim NA, Taser F, Shafiq Q, et al. Anatomical evaluation and clinical importance of the tibiofibular syndesmosis ligaments. Surg Radiol Anat. 2006;28:142–149.
- Edeiken J, Dalinka MK, Karasick D. Roentgen Diagnosis of Diseases of Bone. 4th ed. Baltimore, MD: Williams & Wilkins; 1990.
- Edwards ME. The relation of the peroneal tendons to the fibula, calcaneus, cuboideum. Am J Anat. 1928;42:213–253.
- Erickson SJ, Quinn SF, Kneeland JB, et al. MR imaging of the tarsal tunnel and related spaces. Normal and abnormal findings with anatomic correlation. Am J Roentgenol. 1990;155: 323–328.
- Erickson SJ, Rosengarten JL. MR imaging of the forefoot. Normal anatomic findings. Am J Roentgenol. 1993;160: 565–571.
- Fernandes R, Aguiar R, Trudell D, et al. Tendons in the plantar aspect of the foot. MR imaging and anatomic correlation with cadavers. Skeletal Radiol. 2007;36:115–122.
- Fetto JF. Anatomy and physical examination of the foot and ankle. In: Nicholas JA, Hershman EB, eds. The Lower Extremity and Spine in Sports Medicine. Vol. I. St. Louis: C.V. Mosby; 1986:371–395.
- Goergen TG, Danzig LA, Resnick D, et al. Roentgen evaluation of the tibiotalar joint. J Bone Joint Surg. 1977;59A: 874–877.
- Goodwin DW, Salonen DC, Yu JS, et al. Plantar compartments of the foot. MR appearance in cadavers and diabetic patients. Radiology. 1995;196:623–630.
- Govsa F, Bilge O, Ozer MA. Variations in the origin of the medial and inferior calcaneal nerves. Arch Orthop Trauma Surg. 2006;126:6–14.
- Govsa F, Bilge O, Ozer MA. Anatomical study of the communicating branches between the medial and lateral plantar nerves. Surg Radiol Anat. 2005;27:377–381.
- Gray H, Williams PL, eds. Anatomy of the Human Body. 38th ed. New York: Churchill-Livingstone; 1995.
- Hamilton WC. Traumatic Disorders of the Ankle. New York: Springer-Verlag; 1984.
- Harper MC. The lateral ligamentous support of the subtalar joint. Foot Ankle. 1991;11:354–358.
- Hecker P. Study on the peroneus of the tarsus. Anat Rec. 1923;26:79–82.
- Inkster RQ. Inversion and eversion of the foot and the transverse tarsal arch. J Anat. 1938;72:612–613.
- Jahss MH. Disorders of the Foot. Philadelphia: W.B. Saunders; 1982.
- Jenning P. Radiologic studies of variation in ossification of the foot. III. Cone-shaped epiphyses of the proximal phalanges. Am J Phys Anthropol. 1961;19:131–136.
- Jones RL. The human foot. The role of its muscles and ligaments in the support of the arch. Am J Anat. 1941;68:1–40.
- Jonsson K, Fredin HO, Cederlund CG, et al. Width of the normal ankle joint. Acta Radiol. 1984;25:147–149.
- Karasick D, Schweitzer ME. The os trigonum syndrome: imaging features. Am J Roentgenol. 1996;166:125–129.
- Keats TE, Anderson MW. Atlas of Normal Roentgen Variants that May Simulate Disease. 8th ed. St. Louis: C.V. Mosby; 2006.
- Kelikian H, Kelikian AS. Disorders of the Ankle. Philadelphia, PA: W.B. Saunders; 1985.
- Kitaoka HB, Lundberg A, Luo ZP, et al. Kinematics of the normal arch of the foot and ankle under physiologic loading. Foot Ankle. 1995;16:492–499.
- Klein MA, Spreitzer AM. MR imaging of the tarsal sinus and canal. Normal anatomy, pathologic findings and features of sinus tarsi syndrome. Radiology. 1993;186:233–240.
- Koulouris G, Morrison WB. Foot and ankle disorders: radiographic signs. Semin Roentgenol. 2005;40:358–379.
- Krause JO, Rouse AM. Accessory calcaneus. A case report and review of the literature. Foot Ankle. 1995;16:646–650.
- Lauge-Hansen N. Fractures of the ankle. II. Combined experimental—surgical and experimental—roentgenological investigation. Arch Surg. 1950;60:959–985.
- Lauge-Hansen N. Fractures of the ankle. Analytical historical survey as basis of new experimental, roentgenologic and clinical investigation. Arch Surg. 1948;56:259–317.
- Lawson JP. Symptomatic radiographic variants in the extremities. Radiology. 1985;157:625–631.
- Leung RC, Wong WL. The vessels of the 1st metatarsal web space. An operative and radiographic study. J Bone Joint Surg. 1983;65A:235–238.
- Lewis OJ. The joints of the evolving foot. I. The ankle joint. J Anat. 1980;13:527–543.
- Link SC, Erickson SJ, Timins ME. MR imaging of the ankle and foot. Normal structures and anatomic variants that may simulate disease. Am J Roentgenol. 1993;161:607–612.
- Loeffler RD, Ballard A. Plantar fascial spaces of the foot and a proposed surgical approach. Foot Ankle. 1980;1:11–14.
- Lohman M, Kivisaari A, Vehmas T, et al. MRI assessment of growth arrest. Pediatr Radiol. 2002;32:41–45.
- Lohman M, Kivisaari A, Kallio P, et al. Acute pediatric ankle trauma: MRI versus plain radiography. Skeletal Radiol. 2001;30:504–511.
- Mann RA. Biomechanics of running. In: Nicholas JA, Hershman EB, eds. The Lower Extremity and Spine in Sports Medicine. Vol. I. St. Louis: C.V. Mosby; 1986:396–411.
- McDougall A. The os trigonium. J Bone Joint Surg. 1955;37B: 256–265.
- Melao L, Canella C, Weber M, et al. Ligaments of the transverse tarsal joint complex: MRI-anatomic correlation in cadavers. Am J Roentgenol. 2009;193:662–671.
- Mellado JM, Rosenberg ZS, Beltran J. Low incorporation of soleus tendon. A potential diagnostic pitfall on MR imaging. Skeletal Radiol. 1998;27:222–224.
- Mellado JM, Rosenberg ZS, Beltran J, et al. The peroneocalcaneus internus muscle. MR imaging features. Am J Roentgenol. 1997;169:585–588.
- Mellado JM, Ramos A, Salvad’o E, et al. Acessory ossicles and sesamoid bones of the ankle and foot: imaging findings, clinical significance and differential diagnosis. Eur Radiol. 2003;13:L164–L177.
- Miller TT, Bucchieri JS, Joshi A, et al. Pseudodefect of the talar dome. An anatomic pitfall of ankle MR imaging. Radiology. 1997;203:857–858.
- Miller TT, Staron RB, Feldman F, et al. The symptomatic accessory navicular bone: assessment with MR imaging. Radiology. 1995;195:849–853.
- Msamati BC, Igbigbi PS. Radiographic appearance of sesamoid bones in the hands and feet of Malawian subjects. Clin Anat. 2001;14:248–253.
- Muhle C, Frank LR, Rand T, et al. Collateral ligaments of the ankle: high-resolution MR imaging with local gradient coil and anatomic correlation in cadavers. RadioGraphics. 1999; 19:673–683.
- Mukherjee SK, Pringle RM, Baxter AD. Fracture of the lateral process of the talus. J Bone Joint Surg Br. 1974;56:263–273.
- Noto AM, Cheung Y, Rosenberg ZS, et al. MR imaging of the ankle: normal variants. Radiology. 1989;170:121–124.
- Oh C-S, Won H-S, Hur M-S, et al. Anatomic variations and MRI of the intermalleolar ligament. Am J Roentgenol. 2006;186:943–947.
- O’Rahilly R. A survey of tarsal and carpal anomalies. J Bone Joint Surg Am. 1953;35:626–641.
- O’Rahilly R. The pseudocystic triangle in the normal os calcis. Acta Radiol. 1953;36:516–520.
- O’Sullivan E, Carare-Nnadi R, Greenslade J, et al. Clinical significance of variations in the interconnections between the flexor digitorum longus and flexor hallucis longus in the region of the Knot of Henry. Clin Anat. 2005;18:121–125.
- Ozer MA, Govsa F, Bilge O. Anatomic study of the deep plantar arch. Clin Anat. 2005;18:434–442.
- Ozonoff MB. Pediatric Orthopedic Radiology. 2nd ed. Philadelphia, PA: W.B. Saunders; 1992.
- Pal CR, Tasker AD, Ostlere SJ, et al. Heterogeneous signal in bone marrow on MRI of children’s feet: a normal finding? Skeletal Radiol. 1999;28:274–278.
- Pastore D, Cervi GG, Haghighi P, et al. Ligaments of the posterior and lateral talar process: MRI and MR arthrography of the ankle and posterior subtalar joint with anatomic and histologic correlation. Am J Roentgenol. 2009;192:967–973.
- Perrich KD, Goddwin DW, Hecht PJ, et al. Ankle ligaments on MRI: appearance of normal and abnormal injured ligaments. Am J Roentgenol. 2009;193:687–695.
- Powell HDW. Extra center of ossification for the medial malleolus in children. Incidence and significance. J Bone Joint Surg. 1961;43B:107–113.
- Preidler KW, Wang Y, Brossman J, et al. Tarsometatarsal joint. Anatomic details on MR images. Radiology. 1996;199:733–736.
- Resnick D. Talar ridges, osteophytes and beaks. A radiologic commentary. Radiology. 1984;151:329–332.
- Resnick D. Radiology of the talocalcaneal articulations. Radiology. 1974;111:581–586.
- Resnick D. Articular anatomy and histology. In: Resnick D, ed. Diagnosis of Bone and Joint Disorders. 4rd ed. Philadelphia, PA: W.B. Saunders; 2002:652–672.
- Rhea JT, Salvatore DA, Sheahan J. Radiographic anatomy of the tarsal bones. Med Radiogr Photogr. 1983;59(1):28.
- Romanus B, Lindahl S, Stener B. Accessory soleus muscle. A clinical and radiographic presentation of 11 cases. J Bone Joint Surg. 1986;68A:731–734.
- Rosenberg ZS, Cheung YY, Beltran J, et al. Posterior intermalleolar ligament of the ankle. Normal anatomy and MR imaging features. Am J Roentgenol. 1995;165: 387–390.
- Rosse C, Rosse PG. Hollinshead’s Textbook of Anatomy. Philadelphia, PA: Lippincott-Raven; 1997.
- Rule J, Yas L, Seeger LL. Spring ligament of the ankle. Normal MR anatomy. Am J Roentgenol. 1993;161:1241–1244.
- Sarrafian SK(ed.). Osteology. In: Anatomy of the Foot and Ankle. 2nd ed. Philadelphia, PA: J.B. Lippincott; 1993: 89–112.
- Saupe N, Mengiardi B, Pfirrmann CWA, et al. Anatomic variations associated with peroneal tendon disorders: MR imaging findings in volunteers and asymptomatic ankles. Radiology. 2007;242:509–517.
- Schmidt H, Freyschmidt J. Köhler/Zimmer’s Borderlines of Normal and Early Pathology in Skeletal Radiology. 4th ed. New York: Thieme Medical Publishers; 1993.
- Scranton PE, McMaster JH, Kelly E. Dynamic fibular function. A new concept. Clin Orthop. 1976;118:76–81.
- Shabshin N, Schweitzer ME, Morrison WB, et al. High-signal T2 changes in the bone marrow of the foot and ankle in children: red marrow or traumatic changes. Pediatr Radiol. 2006;36:670–676.
- Shereff MJ, Bejjani FJ, Kummer FJ. Kinematics of the first metatarsophalangeal joint. J Bone Joint Surg. 1986;68A: 392–398.
- Shereff MJ, DiGiovanni L, Bejjani FJ, et al. A comparison of nonweight-bearing and weight-bearing radiographs of the foot. Foot Ankle. 1990;10:306–311.
- Silverman FN, Kuhn JP, eds. Caffey’s Pediatric X-ray Diagnoses. 9th ed. St. Louis: C.V. Mosby; 1993.
- Sirry A. The pseudocystic triangle in the normal os calcis. Acta Radiol. 1951;36:516–520.
- Sledge CB. Structure, development, and function of joints. Orthop Clin North Am. 1975;6:619–628.
- Sledge CB. Biochemical events in the epiphyseal plate and their physiologic control. Clin Orthop. 1968;61:37–47.
- Smith JW. The ligamentous structures in the canalis and sinus tarsi. J Anat. 1958;92:616–620.
- Steel M, Johnson KA, Pewitz MA. Radiographic measurements of the normal adult foot. Foot Ankle. 1980;1:151–158.
- Stiehl JB. Inman’s The Joints of the Ankle. Baltimore, MD: Williams & Wilkins; 1991.
- Sutherland DH, Cooper L, Daniel D. The role of plantar flexors in normal walking. J Bone Joint Surg. 1980;62A: 354–363.
- Sutherland DH, Olshen R, Cooper L, et al. The development of mature gait. J Bone Joint Surg. 1980;62A:336–353.
- Taser F, Shafiq Q, Ebraheim NA. Anatomy of lateral ankle ligaments and their relationship to bony landmarks. Surg Radiol Anat. 2006;28:391–397.
- Taser F, Shafiq Q, Ebraheim NA. Three-dimensional volume rendering of tibiofibular joint space and quantitative analysis of change in volume due to tibiofibular syndesmosis diastasis. Skeletal Radiol. 2006;35:935–941.
- Venning P. Radiologic studies of variation in ossification of the foot. III. Cone shaped epiphyses of the proximal phalanges. Am J Phys Anthropol. 1961;19:131–136.
- Wakeley CT, Johnson DP, Watt I. The value of MR imaging in diagnoses of the os trigonum syndrome. Skeletal Radiol. 1996;25:133–136.
- Wang X-T, Rosenberg ZS, Mechlin MB, et al. Normal variants and diseases of the peroneal tendons and superior retinaculum: MR imaging features. RadioGraphics. 2005;25:587–602.
- Weissman SD. Radiology of the Foot. Baltimore, MD: Williams & Wilkins; 1989.
- Wood Jones F. Structure and Function as Seen in the Foot. Baltimore, MD: Williams & Wilkins; 1944.
- Zanetti M, Strehle JK, Zollinger H, et al. Morton neuroma and fluid in the intermetatarsal bursae on MR images of 70 asymptomatic volunteers. Radiology. 1997;203:516–520.
CHAPTER 2
Diagnostic Techniques
Thomas H. Berquist
- Introduction
- Radiographs and Computed/Direct Radiography
- Ultrasound
- Radionuclide Scans/Positron Emission Tomography
- Computed Tomography
- Magnetic Resonance Imaging
- Interventional Orthopaedic Techniques
- Ankle Arthrography
- Normal Arthrographic Anatomy
- Arthrography of the Subtalar and Other Joints
- Tenography
- Diagnostic and Therapeutic Injection, Aspirations, and Biopsy
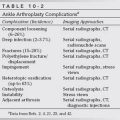
- Complications
- Ankle Arthrography
- Vascular Techniques
- Arterial Interventions
- Venous Interventions
- Complications of Diagnostic and Interventional Vascular Procedures
- Arterial Interventions
- References
INTRODUCTION
Proper application of imaging procedures is essential to obtain needed information for diagnosis and management of patients with suspected foot and ankle disorders. Appropriate selection and utilization of imaging techniques are especially important in today’s cost-conscious environment. Multiple imaging modalities are frequently required for complete evaluation of the foot and ankle. Radiographs remain the primary screening tool whether using conventional screen-film cassettes or computed radiography (CR) or direct digital imaging systems. Today, special radiographic views are less frequently used due to fluoroscopic positioning, coronal and sagittal reformatted CT images, ultrasound, and MR imaging. This chapter provides the basic background data for imaging techniques. These basic discussions include applications and limitations and serve as a reference source for subsequent chapters in which various imaging procedures are discussed as they apply to specific foot and ankle conditions.
RADIOGRAPHS AND COMPUTED/DIRECT RADIOGRAPHY
The structure and function of the foot and ankle are not only confusing and complicated, but are also poorly understood by most radiologists. Overlapping structures, multiplicity of normal variants and accessory ossicles (see Chapter 1), and variability of patient positioning add to the difficulty in interpretation of radiographs [6,7,21,47,52,57].
Radiographs remain the primary screening examination for evaluating foot and ankle disorders. Standard views readily demonstrate the major areas of interest (bony architecture, soft tissues, fat planes) of the foot and ankle. If radiographs are inconclusive, additional studies may be warranted [6,7]. Despite the increased utilization of CT, MR imaging, and ultrasound for this purpose, it is important that ordering physicians and radiologists remain familiar with special views that may be requested by the orthopaedic surgeons [11,23,56].
Radiographic Techniques for the Foot and Ankle
Film-screen imaging technique differs from the foot to the ankle. A high-definition imaging system is required for the foot because of the bony detail needed. This is obtained by using high-definition film-screen combinations. The ankle requires an imaging system with less detail; thus, a double-screen medium-speed film-screen combination is used that still provides adequate detail but with reduced patient exposure to ionizing radiation. Today, CR or direct digital systems (DR) have largely replaced conventional screen-film techniques, at least in larger imaging centers.
CR uses a photostimulable storage phosphor image receptor or plate. The image data forms a latent image. Today’s systems stimulate the stored data with a low-energy laser that releases the stored information. Information is transmitted to an image display system which can digitally store the image or in some cases be converted to laser printed films. Advantages of CR compared to film-screen systems include, but are not limited to the following:
- Other than the image receptor, the system works similar to screen-film for technologists.
- Images are more quickly obtained.
- There is more latitude for exposures and window-level changes on image monitors.
- Changes that can be made in images on monitors reducing the number of retake examinations.
- There is no need for processors, chemicals, and large hard copy image storage areas.
- Image receptors (phosphor plates) are reusable.
Digital radiography differs from screen-film and CR as the image receptor is typically configured using selenium which is excellent for X-ray detection and it has very high spatial resolution. Image receptors are typically built into the radiographic table or a wall bucky reducing the need for handling cassettes. Image data are electronically processed for appropriate display on work stations. At our institution, we typically use CR for most foot and ankle work with the exception of standing imaging where DR is more often used [48].
Ankle
Ankle radiographs are commonly requested, especially in the emergency room setting. Up to 10% of patients present to emergency centers with a history of ankle sprain [5–7]. O’Mary et al. [44] found that diagnosis and treatment were changed in about 37% of patients based on radiographic findings. Other large series evaluating radiographs and ankle injuries have demonstrated that over 89% of patients get ankle radiographs though fractures are demonstrated in only 17% [5]. Vargish [65] found that less than 25% of patients underwent an adequate clinical examination and yet radiographs were obtained in 99% of patients. Should radiographs be obtained? If so, which views are necessary? Ankle radiographs result in costs of about $500,000 per year to our health systems. Therefore, the debate over when to request radiographs and which views are necessary is not surprising. In the early 1990s, Stiell et al. [59–62], developed and tested the Ottawa Ankle Rules which can be used to determine if radiographs are indicated. These clinical rules are listed below:
Ottawa Ankle Rules
- Bone tenderness along the distal 6 cm of the posterior edge of the tibia or tip of the medial malleolus.
- Bone tenderness along the distal 6 cm of the posterior edge of the fibula or the tip of the lateral malleolus.
- Bone tenderness at the base of the fifth metatarsal (for foot injury).
- Bone tenderness at the navicular bone (for foot injury).
- An inability to bear weight both immediately and in the emergency department while walking four steps.
Using these rules (specifically 1, 2, and 5) for the clinical examination reduces the number of radiographs required. Data reports demonstrate 100% sensitivity and reduction in the need for radiographs by 35% [2,59–62]. Similar data have been provided in other studies using the Ottawa rules [3,39].
Most radiologists consider the anteroposterior (AP), mortise, and lateral views essential [1,6,7,21]. Some authors suggest that lateral and mortise views are adequate for fracture diagnosis in 95% of cases [64]. Our standard trauma series includes both oblique views [6,7]. This discussion is not intended to solve the controversy regarding when to obtain radiographs or which views are needed. Instead, we emphasize proper technique and utility of radiographs that are commonly requested by orthopaedic surgeons, podiatrists, and other clinicians.
Routine evaluation of the ankle includes the AP, lateral, and mortise (15 degree to 20 degree internal oblique) views. The external oblique view is added in our trauma series [6,7,16,21,37,43].
Anteroposterior (AP) View. The patient is supine, with the foot placed vertically and centered on a single or one-half of a divided 24 × 30 cm cassette or CR image receptor (Fig. 2-1A). To ensure the true AP position, it may be necessary to slightly dorsiflex the ankle and pronate the foot. The central beam is perpendicular to the cassette and is centered to tibiotalar joint (1 to 2 cm proximal to the malleolar eminences, which should be palpable) [6,7,21]. The radiograph (Fig. 2-1B) demonstrates the normal tibiotalar joint and the medial mortise. Neither the lateral mortise nor the inferior tibiofibular articulation is well demonstrated because the fibula overlaps the tibia and talus on the AP radiograph [6,37]. However, the osseous anatomy in the tibiofibular syndesmotic region can still provide valuable information regarding integrity of the ligaments [25,46].
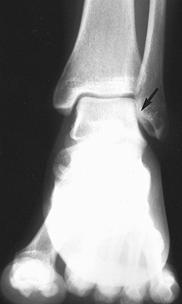
FIGURE 2-1 A) Illustration of a patient positioned for the AP view with slight dorsiflexion of the ankle and pronation of the foot. B) AP radiograph demonstrates overlap of the fibula, tibia and fibula and talus (black arrowhead).
Figure 2-2 demonstrates the relationships of the distal tibia and fibula on the AP radiograph. Measurements are made 1 cm above the tibial plafond (Fig. 2-2B) [46]. Normally, the tibia and fibula should overlap more and be greater than 2.1 mm in adult females and 5.7 mm in males when the distal ligaments are intact [25,46].
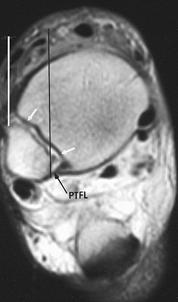
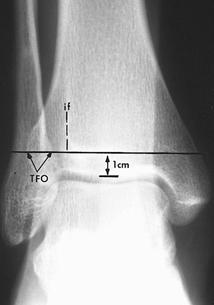
FIGURE 2-2 Tibiofibular syndesmotic relationship on the AP view of the ankle. A) Axial MR image, with vertical lines indicating overlap at the level of the incisura fibularis tibiae (arrows). PTFL, posterior tibiofibular ligament. B) AP radiograph demonstrating measurements made 1 cm above the tibial plafond. The vertical broken line marks the incisura fibularis on the tibia. The tibiofibular overlap (TFO) noted by the black arrows is normally greater than 2.1 mm in women and greater than 5.7 mm in men. The left arrow indicates the lateral tibial margin, and the right arrow, the medial fibular margin. The overlap is diminished with ligament injuries, and the distance from the incisura fibularis to the medial tibia is increased [26,46].
Lateral (Mediolateral) View. With the patient on the affected side, the ankle is placed on the other half of the 24 × 30 cm cassette. The central beam is perpendicular to the cassette and is centered 1 to 2 cm proximal to the medial malleolar tip (Fig. 2-3A). To ensure a true lateral view, it may be necessary to place a support under the knee to keep the patella perpendicular to the horizontal plane. Slight dorsiflexion of the foot may also be necessary [7,21].
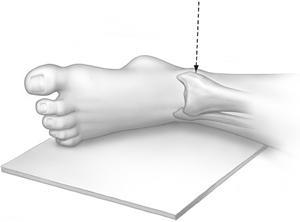
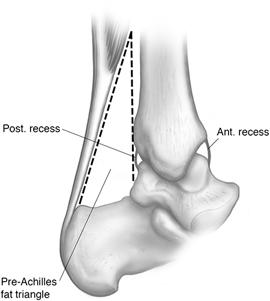
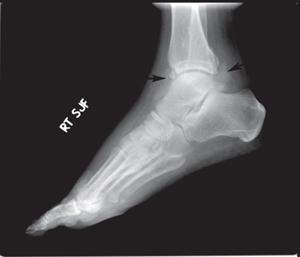
FIGURE 2-3 A) Illustration of a patient positioned for the lateral view of the ankle. The central ray is perpendicular and is centered 1 to 2 cm above the malleolar tip. B) Lateral illustrations demonstrating the pre-Achilles fat pad, marked with broken lines, and fluid distended anterior and posterior recesses (solid lines). C) Inflammatory synovitis with a large joint effusion (arrows).
Alternate views include the cross-table lateral and reverse lateral (lateromedial) with the medial malleolus next to the cassette [4,21]. The latter view is obtained with the tibiotalar joint closer to the image receptor and thus resulting in improved detail. In addition, improved consistency in exact positioning of the ankle is obtained by placing the lower extremity on its relatively flat medial surface. This view is more difficult to obtain in the injured patient.
Structures identified on the lateral view (Fig. 2-3B) include the AP dimensions of the tibiotalar joint, the lower third of the tibia and fibula, the posterior subtalar joint, and the posterior malleolus. The base of the fifth metatarsal should also be included on the image [6,7,21]. An inversion injury can result in fracture of the base of the fifth metatarsal. Clinical history and the location of ankle swelling may mimic an ankle sprain [6,7].
Careful observation of the soft tissue structures on the lateral view can assist in detecting subtle injuries. The pre-Achilles fat pad is a large, triangular collection of fat anterior to the large tendon (Fig. 2-3B). Hemorrhage in this area can occur with Achilles injury. Distortion of this fat pad can also be seen following ankle or calcaneal fractures [24,25,28]. Ankle effusion is demonstrated as a teardrop-shaped soft tissue mass anterior to the tibiotalar joint (Fig. 2-3C) [14,25,63]. Similar, but less obvious changes can be demonstrated posteriorly (Fig. 2-3C). The presence of an effusion suggests intact capsule and ligaments in the immediate postinjury period. Small capsular or ligamentous tears can seal after 48 hours, thus reducing the reliability of this sign [6,7,41].
Using the AP or lateral views, the average normal joint space (talar dome to tibial weight-bearing surface) in men is 3.4 mm and 2.9 mm in women. The medial aspect of the joint space may be slightly wider on the AP view (see Fig. 2-1B) [28,31].
Mortise View (Internal Oblique). To evaluate the entire joint space and distal talofibular articulation, the ankle (leg) must be internally rotated 15 degree to 20 degree with the central beam perpendicular to the ankle joint (Fig. 2-4A) [6,7,21]. Dorsiflexion of the foot may be necessary to prevent superimposition of the posterior calcaneus and the lateral malleolus. This view demonstrates the talar dome. The posterior portion of the lateral talar facet is also seen tangentially (see Fig. 2-4B) [6,7,21,43].
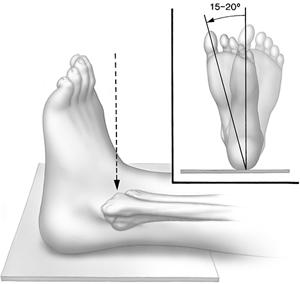
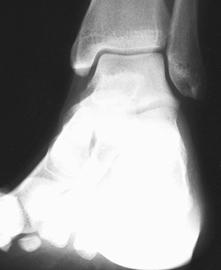
FIGURE 2-4 A) Illustration of a patient positioned for the mortise view with the leg and ankle (internally) rotated 15 degree to 20 degree. B) Mortise view demonstrating the symmetric position of the talus and tibial and fibular articulations.
Oblique Views. Standard oblique views of the ankle are obtained by rotating the ankle 45 degree externally and internally [6,21]. The entire extended lower extremity is also rotated in the same direction for ease of radiographic examination. The beam is directed perpendicular to the image receptor and is centered on the ankle joint. These projections better demonstrate the medial malleolus (external oblique) (Fig. 2-5) and the distal fibula (internal oblique) (Fig. 2-6). Additional anatomy of the hindfoot can also be obtained on the oblique views. In our trauma ankle series, the mortise view (15 degree to 20 degree internal rotation) replaces the standard internal oblique view [7,16].
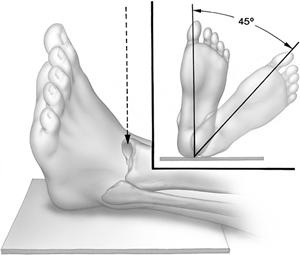
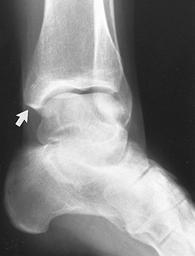
FIGURE 2-5 A) Illustration of a patient positioned for the external oblique view. The ankle is rotated 45 degree, and the beam is centered on the ankle joint. B) External oblique view provides better visualization of the medial malleolus (arrow).
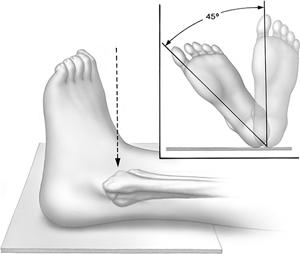
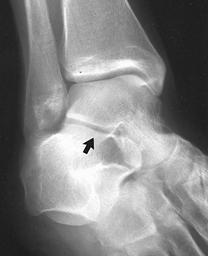
FIGURE 2-6 A) Illustration of a patient positioned for the internal oblique view. The ankle is rotated 45 degree internally, and the beam is centered on the ankle joint. B) Internal oblique view demonstrates the lateral malleolus, lateral and posterior talus, and subtalar joint (arrow).
Stress Views. Assessment of ligamentous injury following ankle trauma can be obtained with carefully performed stress views. The presence of malleolar fractures often indicates the degree of soft tissue injury [7,17,29,36,38,40]. Stress views may be indicated if clinical findings suggest ligament injury when osseous structures are normal [7,9,30]. Focal soft tissue swelling is readily detected on properly exposed radiographs [7,10].
In the acute postinjury period, stress views are often difficult to obtain because of pain and swelling. Injecting the ankle joint with local anesthetic prior to obtaining the stress images improves the accuracy of the examination. Stress studies should be obtained of both ankles for comparison purposes. An experienced physician should apply the stress to the injured ankle. Some centers use mechanical stressing devices to ensure consistency and to allow the degree of stress applied to be more accurately assessed [28,30].
Varus and Valgus Stress Views. Varus and valgus stress views evaluate the medial and lateral stability of the ankle joint (Fig. 2-7). With the lower leg stabilized, the foot is examined in neutral and plantar-flexed positions to assist in separating anterior talofibular and calcaneofibular ligament injuries. The patient is supine, and the beam centered on the ankle joint. Optimal positioning is facilitated by using fluoroscopic guidance with spot images. Comparison testing of both ankles is mandatory. Olson [45] described a normal talar tilt up to 25 degree in the asymptomatic hypermobile ankle.
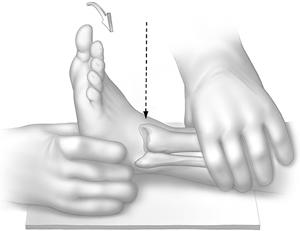
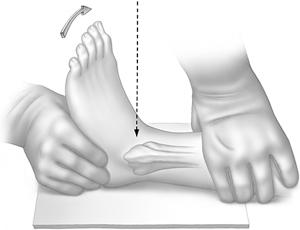
FIGURE 2-7 Illustrations of a patient positioned for valgus (A) and varus (B) stress views. The image is centered on the ankle joint (arrow). Fluoroscopic positioning is optimal.
In varus stress (Fig. 2-8), the distance from the most lateral aspect of the talar dome to the lateral tibial articular surface is measured. The respective distance between the medial articular surfaces is measured with valgus stress (Fig. 2-9). The orthopaedic literature provides a variety of criteria for instability. A 3mm difference between the injured side and the normal side indicates ligament injury [22,30,45]. Using the angle measurement technique, a 5 degree difference of the talar tilt angle between injured and uninjured ankles suggests injury. If the difference between the normal side and the involved side is 10 degree or more, a ligamentous injury is usually present (Fig. 2-9) [9,30].
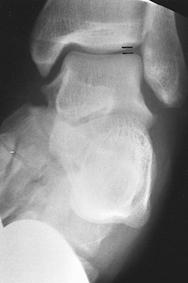
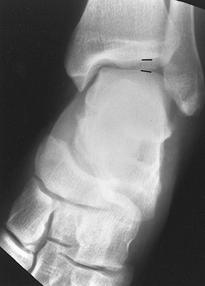
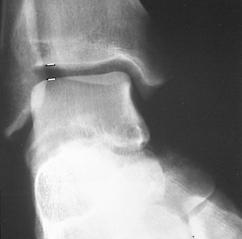
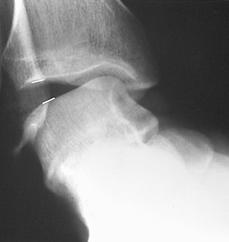
FIGURE 2-8 Stress views of the ankle. A) AP view of the normal ankle positioned for varus stress with the foot plantar flexed. Note the lateral joint space (lines). B) AP varus stress view demonstrates slight lateral joint space widening (lines). C) Stress view with the foot in neutral shows slight widening (lines) on the injured side. D) Varus stress view with the foot plantar flexed shows more obvious widening, greater than 3 mm different from the normal side (see Fig. 2-7), indicating anterior talofibular ligament injury.
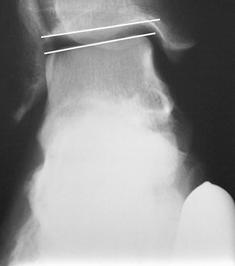
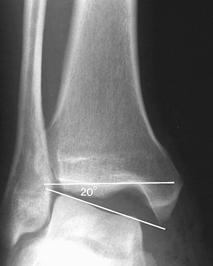
FIGURE 2-9 Valgus stress views. A) Normal valgus stress view with lines along the tibial and talar surfaces. There is no opening of the medial joint. B) Medial ligament tear. Valgus stress view shows medial opening with a 20 degree angle formed by the tibial and talar articular lines.
AP stability of the ankle can be evaluated using the lateral double-exposure technique (Fig. 2-10) or two separate exposures (Fig. 2-11). The patient is supine, with the lower leg placed on separate supports so that the knee and ankle are parallel to the tabletop (see Fig. 2-10). The cassette is positioned perpendicular to the table using a cross-table technique. The foot is held in neutral position to prevent inadvertent motion. Radiographs are obtained before and after applying stress to the distal tibia. The double-exposure technique (both exposures on the same plate with change in mA and kVp) allows easy comparison measurement [7,31]. Both injured and uninjured ankles are measured. A difference of 2 mm or more between the uninvolved side and the involved side indicates anterior talofibular ligament injury (positive drawer sign) [7,50]. Stress views are discussed in more detail in the soft tissue injury section of Chapter 3.