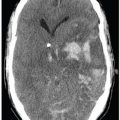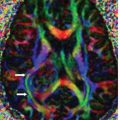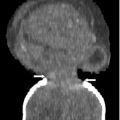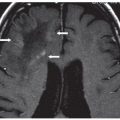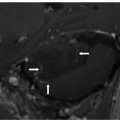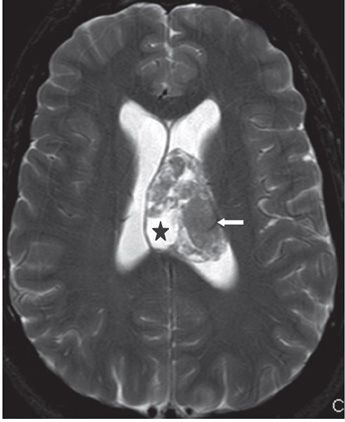
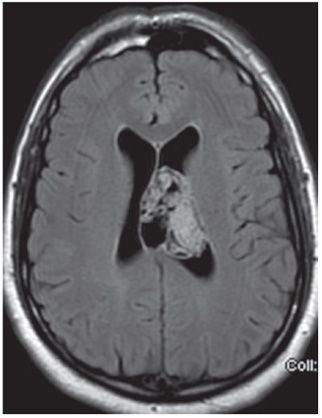
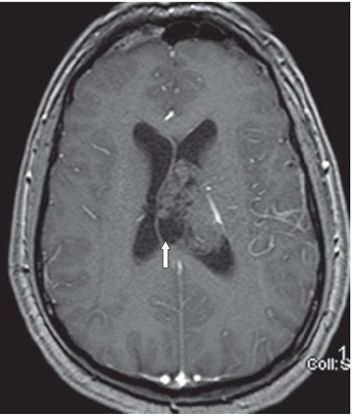
FINDINGS Figure 200-1. Axial DWI through the lateral ventricles. There is a 4.7 cm × 3.3 cm ovoid cystic solid mass in the left lateral ventricle with local mass effect on the lateral ventricular walls. The solid component is hyperintense (arrow). The corresponding ADC map (not shown) shows hypointense solid component consistent with restricted or reduced diffusion. There is mild ventricular dilatation. Figure 200-2. T2WI through the lateral ventricles. The solid components (arrow) are isointense with cortical gray matter (GM) somewhat slightly higher than white matter (WM) intensity. The cystic portion has cerebrospinal fluid (CSF) intensity (star). Figure 200-3. Axial FLAIR. The solid areas are mildly hyperintense. Figure 200-4. Axial post-contrast T1WI. There is no contrast enhancement. Mass has isointense solid areas with hypointense (or CSF intensity) cystic components (arrow).
DIFFERENTIAL DIAGNOSIS Oligodendroglioma, pilocytic astrocytoma, giant cell astrocytoma, ependymoma, central neurocytoma.
DIAGNOSIS Central liponeurocytoma.
DISCUSSION
Stay updated, free articles. Join our Telegram channel

Full access? Get Clinical Tree


