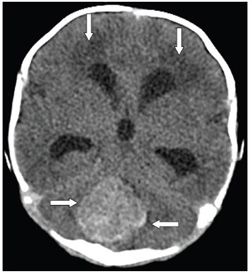
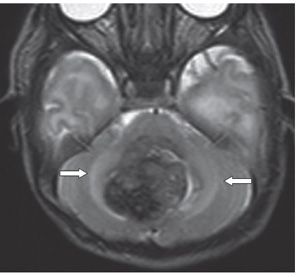
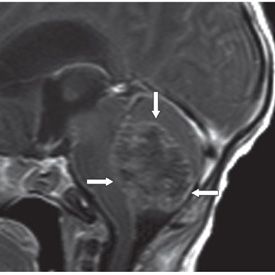
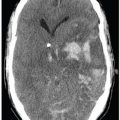
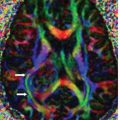
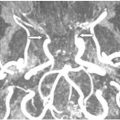
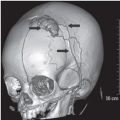
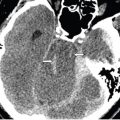
FINDINGS Figure 208-1. The initial imaging study was a head sonogram. This shows a large hyperechoic mass in the posterior fossa (arrows). Figure 208-2. Axial NCCT through the posterior fossa. The mass is hyperdense and well circumscribed (arrows). There is hydrocephalus with transependymal cerebrospinal fluid (CSF) flow (vertical arrows). Figure 208-3. Axial T2WI through the posterior fossa. The mass is heterogeneously hypointense with mild surrounding hyperintensity—edema (arrows). Figure 208-4. Sagittal post-contrast T1WI. The mass shows mild patchy enhancement (arrows). There is compression of the brainstem.
DIFFERENTIAL DIAGNOSIS

Stay updated, free articles. Join our Telegram channel

Full access? Get Clinical Tree


