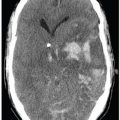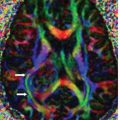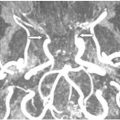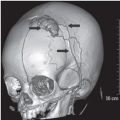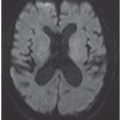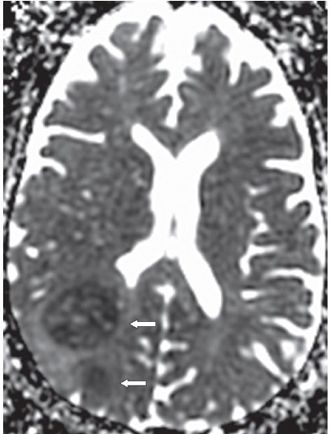
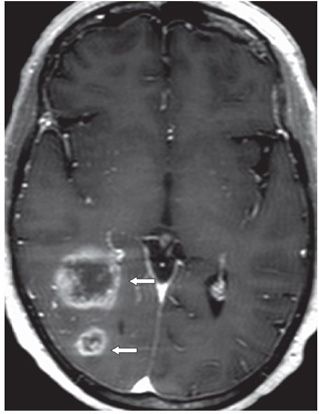
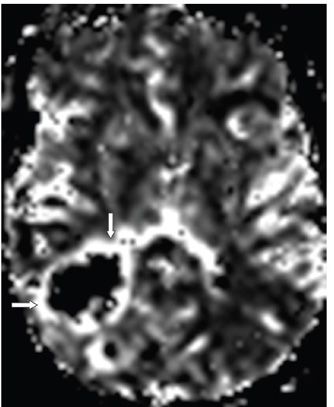
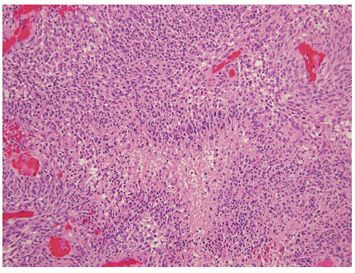
FINDINGS Figure 224-1. Axial FLAIR through the trigones. There are two masses (vertical arrows) with heterogeneous intensity in the right parietal occipital lobes with surrounding edema and mass effect on the right trigone (transverse arrow). Figure 224-2. Axial ADC map through the masses. There is low ADC in the masses (arrows). Figure 224-3. Axial post-contrast T1WI. There is a thick irregular ring contrast enhancement with a hypointense core in each of the lesions (arrows). Figure 224-4. Axial perfusion relative Cerebral Blood Volume (rCBV) map. There is peripheral increased blood volume in the masses (arrows). Figure 224-5. Low-power photomicrograph shows markedly cellular tumor with pseudopalisaded necrosis and vascular endothelial proliferation (H&E stain).
DIFFERENTIAL DIAGNOSIS Glioblastoma (GB), abscess, metastasis, tumefactive demyelination, lymphoma.
DIAGNOSIS Glioblastoma (GB).
DISCUSSION
Stay updated, free articles. Join our Telegram channel

Full access? Get Clinical Tree


