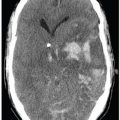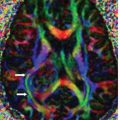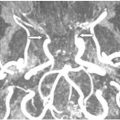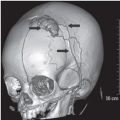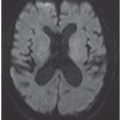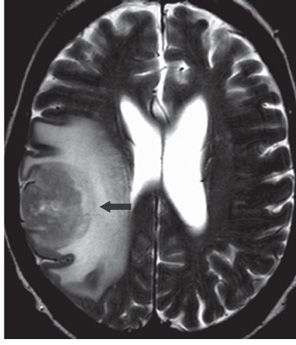
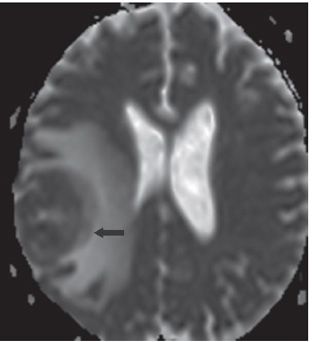
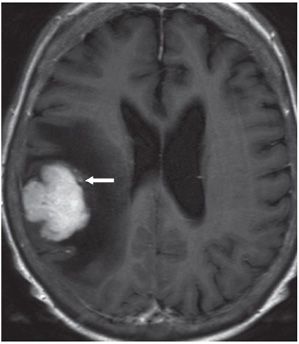
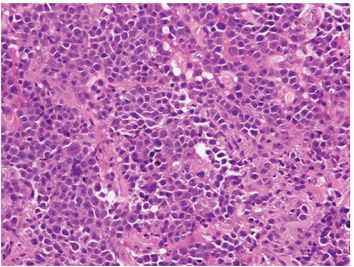
FINDINGS Figure 259-1. Axial NCCT through the lateral ventricles. There is a mildly hyperdense mass in the right frontoparietal lobe with extensive surrounding hypodensity consistent with vasogenic edema. There is local mass effect but no midline shift. There is a crescentic medial component that is less hyperdense (arrow) suggesting infiltration of surrounding edema. Figure 259-2. Axial T2WI through the mass. There is a heterogeneous minimally hyperintense mass in the right frontoparietal junction with surrounding marked hyperintensity consistent with vasogenic edema. The medial crescent is of intermediate hyperintensity (arrow). There is mild mass effect on the right lateral ventricle with effacement of overlying sulci. Figure 259-3. ADC map through the mass. There is low ADC within the mass (arrow) consistent with restricted diffusion. Figure 259-4. The mass demonstrates marked homogeneous enhancement. Abutment of the cortex is clearly identified. Anteriorly and medially there is mild infiltration seen into the adjacent brain (arrow). Figure 259-5. Photomicrograph shows discohesive population of large lymphoid cells with atypical hyperchromatic nuclei; some with one or more nucleoli (H&E stain).
DIFFERENTIAL DIAGNOSIS Lymphoma, hypercellular metastatic disease, hypercellular glioma.
DIAGNOSIS
Stay updated, free articles. Join our Telegram channel

Full access? Get Clinical Tree


