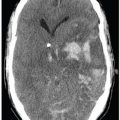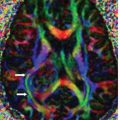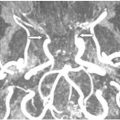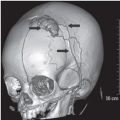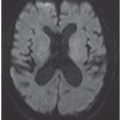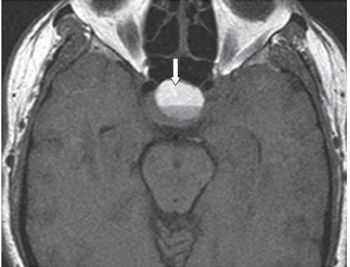
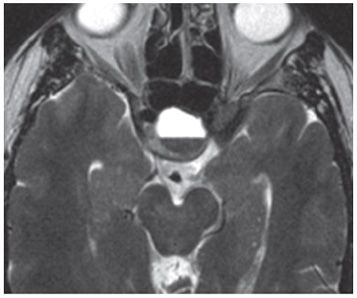
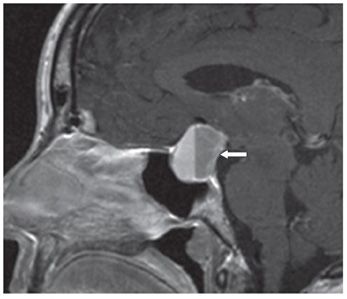
FINDINGS Figures 261-1 and 261-2. Mid-sagittal and axial non-contrast T1WI, respectively, through the sella turcica. There is a mass in the sella that contains a blood level (arrows). The sella is expanded, implying the presence of a previous mass. Both levels are bright, suggesting methemoglobin. Figure 261-3. Axial T2WI through the sella. The dependent portion of the blood is dark suggesting intracellular methemoglobin, whereas the supernatant remains hyperintense suggesting extracellular methemoglobin. Figure 261-4. Post-contrast sagittal T1WI shows no changes in the contents of the lesion and only posterior enhancement (arrow), where the residual tumor tissue is located.
DIFFERENTIAL DIAGNOSIS Pituitary apoplexy, Rathke cleft cyst, dermoid cyst, craniopharyngioma.
DIAGNOSIS Pituitary hemorrhage.
DISCUSSION
Stay updated, free articles. Join our Telegram channel

Full access? Get Clinical Tree


