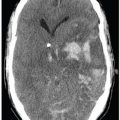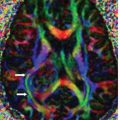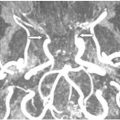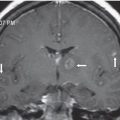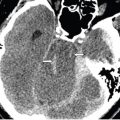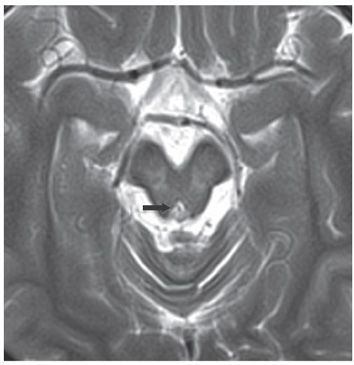
FINDINGS Figure 265-1. Axial FLAIR through the basal ganglia. There is bilateral symmetrical hyperintensity in the basal ganglia (especially the lateral aspect of the putamen), thalamus, and claustrum (arrows). Figure 265-2. Axial T2WI through the midbrain. There is periaqueductal and cerebral peduncle hyperintensity (arrow).
DIFFERENTIAL DIAGNOSIS Mitochondrial disorders (such as Leigh syndrome), methylmalonic academia, toxins (CO, methanol, cyanide), hypoxic ischemic encephalopathy (HIE), Wilson disease (WD).
DIAGNOSIS Wilson disease (WD).
DISCUSSION NCCT may be normal or show only mild generalized atrophy. Areas of hypodensity within the basal ganglia and thalami are occasionally demonstrated. MRI usually shows areas of focal signal abnormalities, hypointense on T1WI, and hyperintense on FLAIR and T2WI in the putamen and the ventrolateral aspect of the thalamus. The globus pallidus, caudate nuclei, white matter (WM), dentate nuclei, mesencephalon (Panda face sign), and the pons may also be involved. Diffusion restriction may be seen early in the course of the disease especially in the claustrum and/or lateral putamen. Usually there is no contrast enhancement. MRS usually demonstrates decrease in N
Stay updated, free articles. Join our Telegram channel

Full access? Get Clinical Tree


