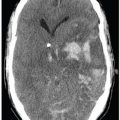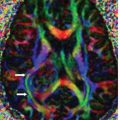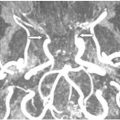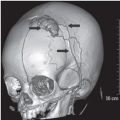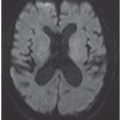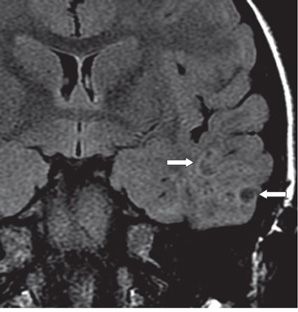
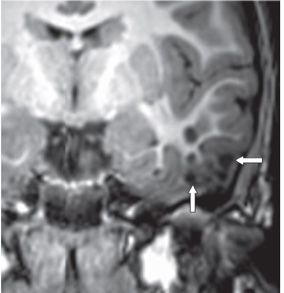
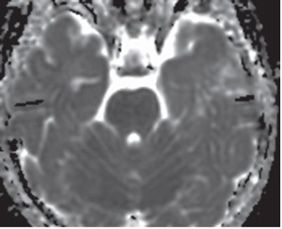
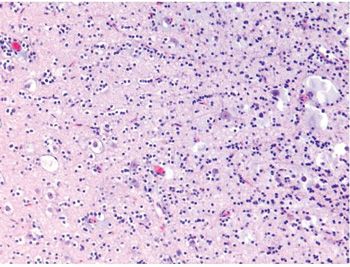
FINDINGS Figure 269-1. Coronal T2WI through the temporal lobes. There is a collection of hyperintense foci (cysts) (arrows) scattered inferolaterally in the left temporal lobe. Figure 269-2. Coronal T2-FLAIR through same region. The hyperintense foci (cysts) show cerebrospinal fluid (CSF) hypointensity with surrounding hyperintense rims within a poorly defined area of low-level hyperintensity (arrows) that is not adequately appreciated on the coronal T2WI. Figure 269-3. Coronal T1WI. The cysts are markedly hypointense (arrow). No enhancement was present with gadolinium. Figure 269-4. ADC map demonstrates high values throughout the region. No evidence of calcification or hemorrhage on the MRI. Figure 269-5. Photomicrograph shows characteristic mucinous pools containing ganglion cells (floating neurons). The other component is composed of monomorphic cells with round nuclei and pericellular clearing artifact (H&E stain).
DIFFERENTIAL DIAGNOSIS Dysembryoplastic neuroepithelial tumor (DNET), astrocytoma or other glioma, neurocysticercosis, hydatid cysts, enlarged perivascular spaces, dysplastic brain, multiple bacterial abscesses, herpes encephalitis, ganglioglioma (GG), pilocytic astrocytoma (PA), pleomorphic xanthoastrocytoma (PXA).
DIAGNOSIS
Stay updated, free articles. Join our Telegram channel

Full access? Get Clinical Tree


