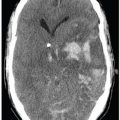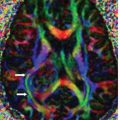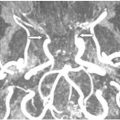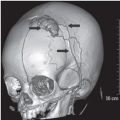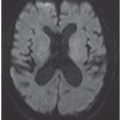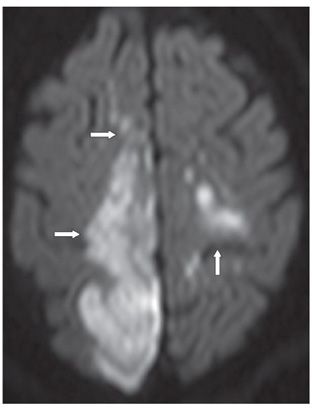
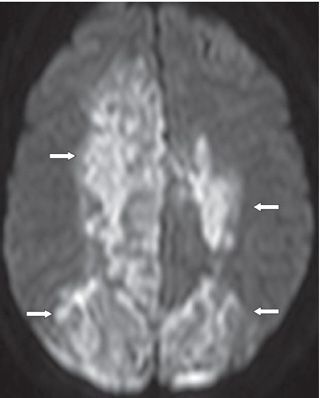
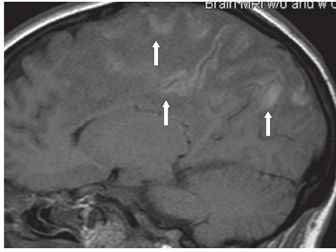
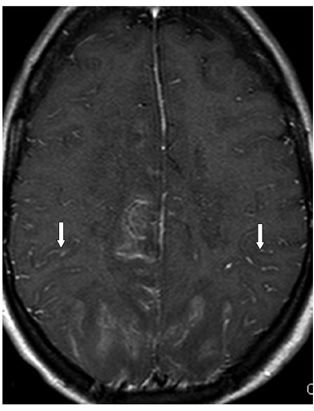
FINDINGS Figures 290-1 and 290-2. Axial DWI through the levels of the lateral ventricles and the vertex, respectively. Multifocal bilateral areas of restricted diffusion in multiple vascular territories, bilateral posterior cerebral artery (PCA) (figure 1 arrows), right anterior cerebral artery (ACA) (figure 290-2 transverse arrows), and left watershed region (figure 290-2 vertical arrow). Figure 290-3. Axial DWI follow-up through the vertex. There is progression of bilateral cerebral areas of restricted diffusion (arrows). Similar progression of T2 hyperintensities was present on FLAIR/T2WI (not shown) in bilateral ACA and PCA territories. Figure 290-4. Right parasagittal non-contrast T1WI on follow-up. There is gyriform hyperintensity in the right frontoparietal lobes (arrows) consistent with hemorrhagic infarcts. Figure 290-5. Axial post-contrast T1WI through the level of the centrum semiovale. There is bilateral leptomeningeal enhancement (arrows) superimposed on the underlying gyriform hyperintensity of subacute hemorrhage in bilateral frontoparietal lobes.
DIFFERENTIAL DIAGNOSIS
Stay updated, free articles. Join our Telegram channel

Full access? Get Clinical Tree


