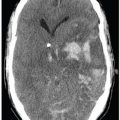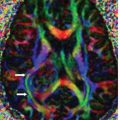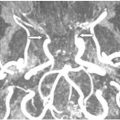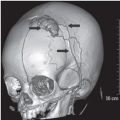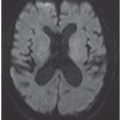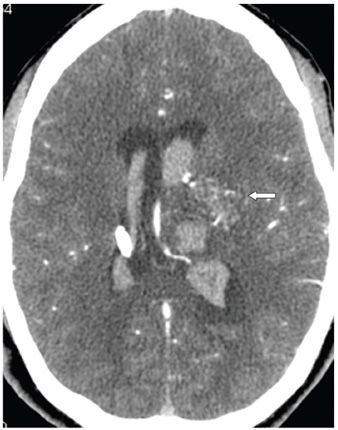
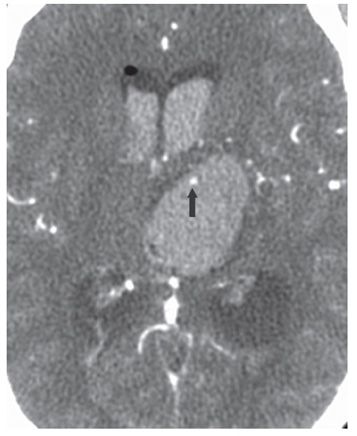
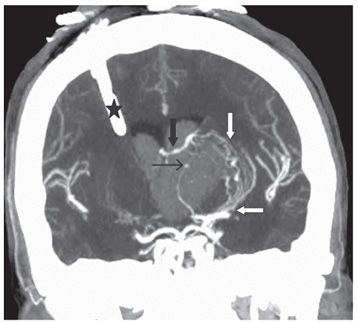
FINDINGS Figure 299-1. Axial NCCT through the thalami. There is a large left thalamic well-defined homogeneous hyperdensity consistent with acute hematoma with surrounding hypodense halo (black arrow)—edema. There is similar hyperdensity within the dilated bilateral frontal horns of the lateral ventricles (line arrows) consistent with intraventricular hemorrhage. Bilateral trigones are dilated (stars) consistent with hydrocephalus. There is effacement of all convexity subarachnoid spaces due to increased intracranial pressure. Figure 299-2. Axial head CTA source image through the lateral ventricles. There is irregular contrast enhancement (arrow) in the left basal ganglia just lateral to the superior aspect of the left thalamic hematoma. The lateral ventricles are dilated with intraventricular hemorrhage. Figure 299-3. Axial CTA source image through the hematoma showing a focal peripheral contrast enhancement (arrow)—the so-called spot sign. Figure 299-4
Stay updated, free articles. Join our Telegram channel

Full access? Get Clinical Tree


