Technique
Radiographs (routine and stress views) and any additional imaging studies should be evaluated before performing the arthrogram [208,221]. Pertinent clinical information concerning the type of trauma and other indications for the arthrogram are important. Arthrographic technique varies according to clinical indications (see Table 2-3). MR imaging or CT may be combined with conventional arthrography [239]. Also, the type (iodinated contrast, anesthetic, or steroid) and amount of material injected (distention arthrography) will depend upon the clinical indication. Patient size and weight or the presence of certain metallic or electrical devices may also dictate the type of imaging that can be performed with the study.
Regardless of the eventual imaging modality (CT, MR, or fluoroscopy with spot images) we use fluoroscopic guidance for injection of the ankle [207,208,239]. The patient is positioned supine on the fluoroscopic table. The ankle should be examined fluoroscopically to determine whether there is any abnormality (i.e., instability, opaque foreign bodies, or osseous bodies) before injection [221]. Before selecting the injection site, the dorsalis pedis pulse is palpated. The extensor tendons are usually easily located. In most situations, the joint is entered anteriorly and medial to the dorsalis pedis artery and easily palpated extensor tendons (Fig. 2-53) [207,208,232,239,243,248]. The entry site is marked and the anterior aspect of the ankle is prepared with sterile technique (povidone-iodine [Betadine] scrub). The skin and superficial soft tissues are anesthetized with 1% lidocaine (Xylocaine) mixed with 8.4% bicarbonate buffer to reduce discomfort. A 25-gauge ½-in. needle is used for this injection. A 25-gauge 1½-in. needle is used to perform the arthrogram. Once the needle has penetrated the skin, the ankle can be rotated into the lateral position. This allows one to judge the depth of needle penetration and avoid the anterior tibial lib (Fig. 2-53). The joint is entered just inferior to the anterior tibial margin. The needle should be directed slightly inferiorly, to avoid the tibial lip [207,239].
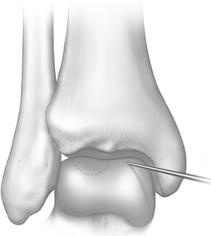
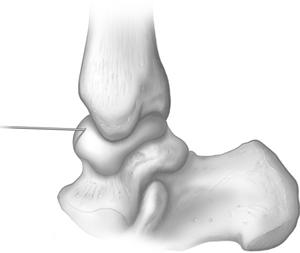
FIGURE 2-53 Frontal (A) and lateral (B) illustrations of needle position for ankle arthrography.
Needle position can be confirmed by injection of a small amount of iodinated contrast. Contrast should flow freely away form the needle tip. If a small focal blush occurs about the needle tip, it is not properly positioned in the joint. One can rotate the needle or move it slightly prior to retesting. When the needle is within the capsule, any fluid or blood should be aspirated. Appropriate laboratory studies should be obtained in patients with suspected infection or other arthritidies. Contrast-material injection depends on the clinical setting (see Table 2-3). For conventional arthrography, we use a 12 cc syringe and connecting tubing containing 4 to 6 mL of contrast material (Reno-60 or Omnipaque 300) is injected. Mixing 2 to 4 mL of lidocaine with the contrast material in the syringe provides anesthetic effect in the joint. This is important to facilitate stress views [207,208,220,233].
Different mixtures may used in the setting of CT, MR, or combined diagnostic and therapeutic purposes. For CT arthrography, we combine 5 mL of iodinate contrast with 4 mL of long acting anesthetic (0.5% ropivacaine hydrochloride). The addition steroids will be discussed in the later section on therapeutic injections. The mixture for MR arthrography includes 5 mL of iodinated contrast, 4 mL of ropivacaine hydrochloride, and 0.1 to 0.2 mL of gadopentetate dimeglumine [208,239].
Occasionally, 0.1 to 0.2 mL of 1:1000 epinephrine is injected with the contrast material. Epinephrine reduces absorption and dilution of contrast material in the joint. This is helpful if delays in imaging might occur. Delays are most likely to occur when CT, or MR imaging are used in conjunction with the arthrogram [208,232,248].
After the injection, the ankle is stressed and observed fluoroscopically. Images are obtained in the AP, lateral, and oblique projections. If a ligament injury is suspected, stress views are also obtained [208,220]. Vuust and Niedermann [250,251] suggested adding an oblique axial view to improve detection of calcaneofibular ligament tears.
Normal Arthrographic Anatomy
The anatomy of the ankle is discussed in Chapter 1. Arthrographically, certain anatomic features are easily assessed. The anterior capsule extends from the neck of the talus to a point 5 mm superior to the distal tibial margin. This anterior recess is best seen on the lateral view (Fig. 2-54). Posteriorly, a second recess is also evident. This recess is more irregular and its size more variable compared with the anterior recess (Fig. 2-55). Medially and laterally, the capsule extends to the tips of the malleoli. The margins should be smooth [206,208,214,216,224,239]. Superiorly, the capsule extends between the distal tibia and fibula (Fig. 2-54), forming a syndesmotic recess. Normally, this is smooth and does not extend more than 2.5 cm above the joint space [208,214,217].
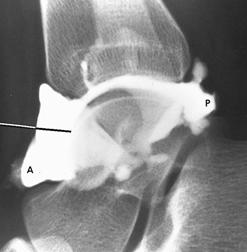
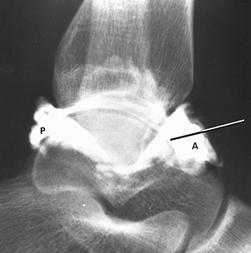
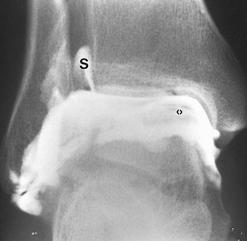
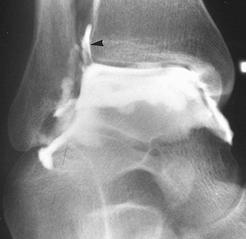
FIGURE 2-54 Normal ankle arthrogram. A,B) Normal lateral views demonstrating the anterior (A) and posterior (P) recesses. Black and white lines indicate the needle entry site and angle. C) Anteroposterior view from an ankle arthrogram demonstrating the syndesmotic recess (S) and needle entry site (>). D) Mortise view after contrast injection demonstrates articular cartilage thickness and the syndesmotic recess (arrowhead).
In approximately 10% of patients, the tibiotalar joint communicates with the posterior subtalar joint (Fig. 2-55). Communication with the flexor tendons (posterior tibial and flexor digitorum longus) along the medial aspect of the ankle is noted in approximately 20% of patients (Fig. 2-56) [206,212,214].
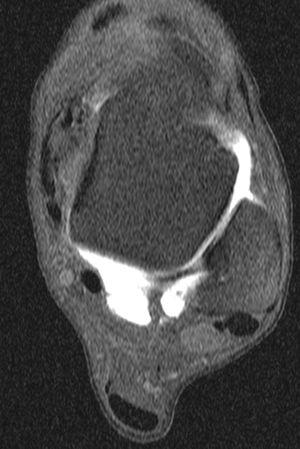
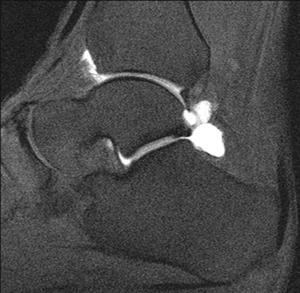
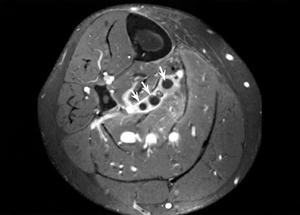
FIGURE 2-55 Normal MR arthrogram. Axial (A) and sagittal (B) MR arthrogram images demonstrating the large posterior recess and contrast in the posterior subtalar A joint which is noted in 10% of patients.
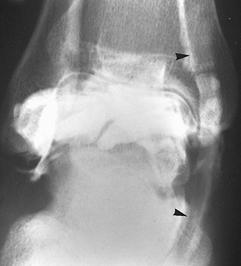
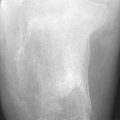
FIGURE 2-56 Anteroposterior radiograph from an ankle arthrogram demonstrates normal filling of the medial tendon sheaths (arrowheads).
Clinical Applications
Considerable controversy exists concerning management of acute ankle ligament injuries [208,213,247,248]. Both open and closed treatment methods have been advocated. In young, active persons or in professional athletes, surgical reduction is more commonly performed when both the anterior talofibular and calcaneofibular ligaments are disrupted. Certainly, inadequate management can lead to recurrent injury and instability [208,212].
Arthrography can provide valuable information regarding the extent of ligament injuries [206,212,214,237]. In the acute postinjury period, arthrography is easily performed and is more accurate than stress views alone [208,220,240]. Accuracy in assessing ligament injury decreases if the arthrogram is performed more than 72 hours after the injury. Ideally, the test should be performed within 48 hours [208,238,240].
The ligaments of the ankle are not directly visible using conventional arthrographic techniques. When additional injuries are suspected, MR or CT arthrography is preferred to better evaluate the articular cartilage and other soft tissues about the ankle [209,218,239,243].
The medial complex (deltoid ligament) is broad and triangular. The fibers pass from the medial malleolus to insert on the talus and calcaneus (Fig. 2-57) [206,212,214,237]. Laterally, there are three major ligaments. The anterior talofibular ligament extends from the lateral malleolus to the talus and blends with the anterior capsule. The calcaneofibular ligament is not intimately associated with the capsule. The posterior talofibular ligament extends posteriorly from the fibula to the talus (Fig. 2-57) [205,227,239].
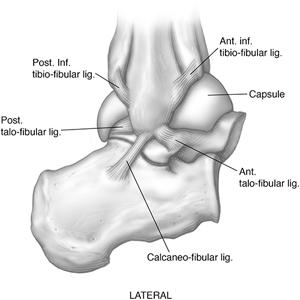
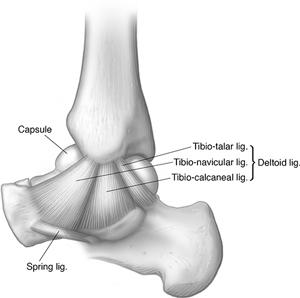
FIGURE 2-57 Illustrations of the lateral (A) and medial (B) ligament complexes of the ankle.
The anterior talofibular ligament is most frequently disrupted. This is usually the result of an inversion injury. The capsule is also torn, allowing contrast material to extravasate laterally and anterior to the distal fibula [208,243]. The abnormality is best localized on the external oblique view. The contrast material is projected lateral to the fibula if extravasation has occurred anteriorly. The lateral view is also useful (Fig. 2-58). Contrast medium may reach the tip of the lateral malleolus and may extend superiorly. Anterior talofibular ligament tears may seal within 48 hours. Thus, arthrograms performed more than 2 days after injury may appear negative if they are not properly performed by an experienced examiner [206,212].
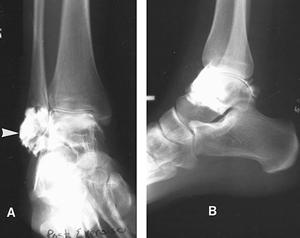
FIGURE 2-58 Anteroposterior (A) and lateral (B) views of an ankle arthrogram demonstrating an anterior talofibular ligament tear with contrast extravasation (arrowhead) but no filling of the peroneal tendon sheaths.
More significant ankle injuries may involve both the anterior talofibular and calcaneofibular ligaments. This injury classically results in filling of the peroneal tendon sheaths as well as capsular extravasation (Fig. 2-59).
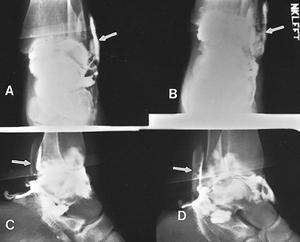
FIGURE 2-59 Anteroposterior (A,B), lateral (C), and oblique (D) radiographs of an ankle arthrogram demonstrating peroneal tendon sheath filling (arrows) due to calcaneofibular and anterior talofibular ligament disruptions.
Diagnosis of calcaneofibular ligament tears may be difficult. Spiegel and Staples [246] reported 8 false-negative arthrograms in 26 patients with surgically proven calcaneofibular ligament tears. Difficulty in diagnosis of calcaneofibular tears may be caused by decompression of the capsule by the associated anterior talofibular ligament and capsular tear. The contrast material takes the path of least resistance [208,246]. Prearthrographic injection of the joint with lidocaine, followed by exercise and stress, or repeated exercise views after the arthrogram may be helpful in more accurate assessment of the calcaneofibular ligament [207,208].
Extravasation of contrast material posterior and lateral to the malleolus may also indicate a tear, even though the peroneal tendon sheaths are not filled. This finding is best seen on the internal oblique or axial oblique view [250,251]. Direct injection of the peroneal tendon sheath probably provides the most accurate method of diagnosing calcaneofibular ligament tears [212,215]. Contrast from the peroneal tendon sheath should not enter the ankle joint unless a calcaneofibular ligament tear is present. Occasionally, incomplete, old, or partially healed tears are noted. These injuries present with subtle irregularity of the capsule or ulcer-like projections [207].
Tears of the posterior talofibular ligament are unusual and do not occur as isolated injuries. In this setting, gross instability is usually evident clinically, obviating the need for arthrography [208,214].
Medial ligament injuries are less common and usually involve both the deltoid ligament and distal tibiofibular syndesmosis. The arthrogram demonstrates extravasation around the tip of the medial malleolus and extension, disruption, or irregularity of the syndesmotic recess [208,214,216]. The lateral view demonstrates loss of the normal lucent zone anterior to the distal tibia. (Isolated complete tears of the anterior tibiofibular ligament are uncommon.)
Arthrography with or without MR or CT is useful for evaluating patients with persistent pain or instability following treatment. Persistent instability, adhesive capsulitis, and other complications are clearly demonstrated [208].
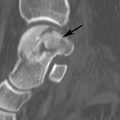
Magnetic resonance and CT arthrography are useful to evaluate subtle articular or synovial changes. This is particularly useful in evaluating osteochondral defects such as talar dome fractures and osteochondritis dissecans (Fig. 2-60) [208,239]. More subtle changes in articular cartilage can be detected with MR arthrography. Active synovitis may be more easily evaluated with indirect MR arthrography using a dynamic bolus injection technique.
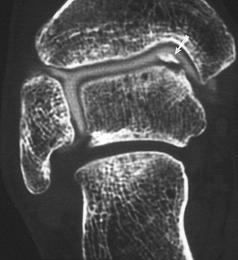
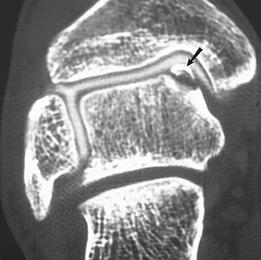
FIGURE 2-60 Patient with ankle pain after inversion injury. Coronal CT images obtained after contrast with bone (A) and soft tissue (B) settings demonstrate a displaced medial talar dome fracture (arrow).
After trauma, persistent pain and decreased range of motion may indicate adhesive capsulitis. In this clinical setting, distention arthrography with anesthetic and steroids may provide significant relief of symptoms and break up adhesions. The joint injection may be more difficult because of the constricted capsule [208].
Arthrography of the Subtalar and Other Joints
Isolated arthrograms of the tarsal joints and articulations of the foot are infrequently performed. Instead, diagnostic and therapeutic injections are more commonly performed to localize the source of pain [207,228,232,237,239,242,247]. Contrast injection serves mainly to confirm proper needle position. We use fluoroscopic guidance and monitoring, but ultrasound, CT, and MR guidance have also been advocated [208,239,242,247]. Regardless of the joint being studied the patient is placed supine on the fluoroscopic table with appropriate rotation of the patient and foot to allow direct vertical access to the joint. Sterile technique described for ankle arthrography is also used for injections of the tarsal and forefoot articulations. Twenty-five guage ½-in. and 1.5-in. needles are usually adequate regardless of the joint studied. A mixture of 4 mL of iodinated contrast and 4 mL of anesthetic (lidocaine or ropivacaine) is drawn up in a 10 cc syringe. One milliliter of steroid can be added depending upon the clinical question. This combination can be used for any of the articulations in the foot. Only 1 to 3 mL is injected depending upon the joint studied [208,239].
The subtalar joint can be easily entered medially or laterally, depending on the anatomy and on whether any joint or posttraumatic deformity exists [207,228,239]. The patient should be on his or her side and the posterior talocalcaneal facet positioned fluoroscopically. Fluoroscopic guidance allows a straight vertical approach into the joint. Fluoroscopic spot images are useful, but CT are often used to improve anatomic detail after the injection of 1 to 3 mL of the mixture described above (Fig. 2-61) [207,239].
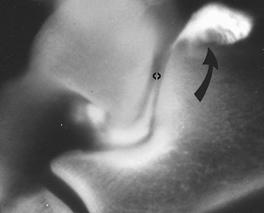
FIGURE 2-61 Subtalar arthrogram showing the injection site (>), normal articular cartilage, and slight synovial irregularity posteriorly (curved arrow).
The normal subtalar joint should be clearly outlined, with equal thickness of the articular surfaces and a smooth synovial lining [207,239]. If the articular cartilage is abnormal, one will see irregularity, hazy enhancement (degenerative changes), or thinning. Subtle articular abnormalities are most easily assessed with reformatted CT or MR imaging. Synovitis (Fig. 2-61) causes irregularity of the synovial lining with small filling defects [207,239].
Injection of other tarsal articulations, metatarsophalangeal, and interphalangeal joints can be accomplished easily with a fluoroscopically guided dorsal approach (Fig. 2-62). AP, lateral, and oblique images are taken. In certain situations, CT may provide additional information [207,228].
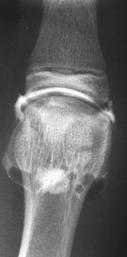
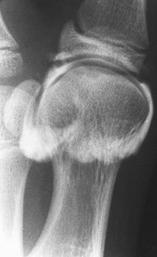
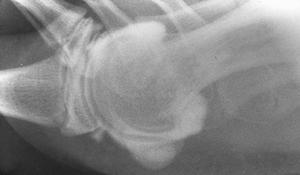
FIGURE 2-62 Anteroposterior (A), oblique (B), and lateral (C) single-contrast arthrogram of the first metatarsophalangeal joint demonstrating the normal capsule and articular cartilage.
Indications for these arthrograms are more limited. Tarsal coalition and clubfoot deformities (especially in children with unossified osseous structures), needle position for diagnostic or therapeutic injections or biopsy, and determination of articular or capsular abnormalities are the primary indications [207,228,232,237].
Tenography
Tendon sheath injections are most frequently used to diagnose and manage inflammatory or posttraumatic conditions [206,211,213,223,233,239,243,247]. The technique can be slightly more difficult than arthrography. Studies may be performed on the lateral group (peroneus longus and brevis), medial tendons (tibialis posterior, flexor digitorum longus, and flexor hallucis longus), or the anterior tendons (tibialis anterior, extensor hallucis longus, extensor digitorum longus). The Achilles tendon does not have a tendon sheath [205,206,213].
Technique and Normal Anatomy
The clinical history and all pertinent imaging studies should be reviewed. Fluoroscopic examination of the foot and ankle should be performed before the injection. This technique allows palpation and localization of the tendons to be injected, evaluation of range of motion, detection of tendon snapping, and detection of osseous abnormalities. The skin is prepared using the same sterile technique described earlier for arthrography. Before injection, the vascular structures should be localized and the foot dorsiflexed and plantar flexed to localize the tendon (see Figs. 2-53 and 2-63).
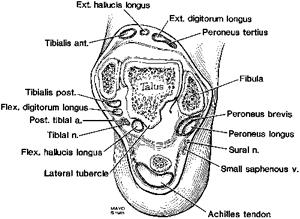
FIGURE 2-63 Axial illustration of the ankle demonstrating the tendons and neurovascular structures.
Lateral Tendons. The peroneal tendon sheaths are injected by entering the sheaths posterior and just cephalad to the lateral malleolus (Fig. 2-64). The injection site may vary slightly, depending on the site of suspected injury (i.e., slightly higher for suspected peroneal tendon subluxation). After sterile preparation, the skin is anesthetized with 1% lidocaine using a 25-gauge ½-in. needle. In certain cases, this needle is adequate for the study, but generally a 25-gauge 1½-in. needle is required. This needle is directed from above and enters the tendon sheath obliquely so the bevel will be entirely within the sheath. When the needle enters the tendon, a slight resistance is felt. The needle is then withdrawn slightly, and a small test injection is made using fluoroscopic observation. If the needle is properly positioned, the contrast will outline the tendon and will flow away from the needle tip. The injection is monitored fluoroscopically to ensure that the proper amount of contrast is used, to prevent over distension and to detect sites of obstruction, extravasation, or filling of the ankle joint. In general, 10 to 12 mL of contrast (Reno-60 or Omnipaque 300) is required to distend and completely evaluate the entire tendon sheath [205,206,215,239,249].
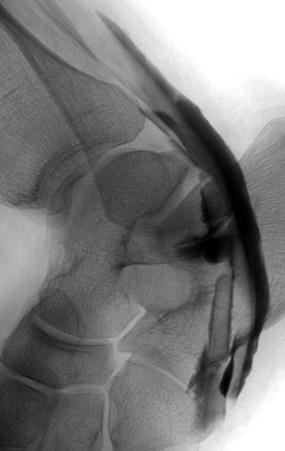
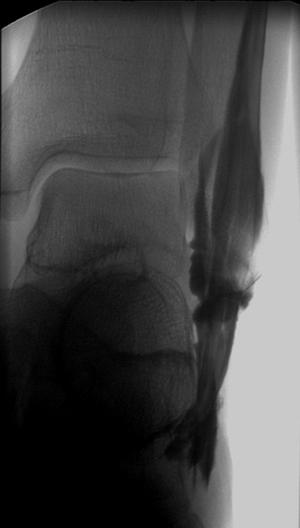
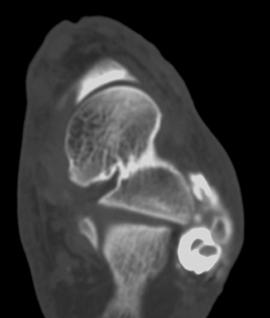
FIGURE 2-64 Peroneal tenogram. Lateral (A) and AP (B) tenogram images demonstrating filling of the peroneal tendon sheaths. The long arrow in (A) demonstrates the needle entry point and the small arrow anterior extravasation. CT image (C) also demonstrates the anterior extravasation with intact tendons.
The peroneus longus and brevis tendons share a common tendon sheath to the distal third of the calcaneus [215,245]. The sheath divides at this point, and the peroneus brevis inserts in the base of the fifth metatarsal. The peroneus longus takes an oblique course via the sole of the foot to insert in the inferior aspects of the medial cuneiform and first metatarsal base [215,249]. After the injection, the foot is exercised during fluoroscopic monitoring to be certain that the sheaths are completely filled and to allow spot films of any abnormal findings. Additional imaging with CT can be performed to more clearly define tendon abnormalities and adjacent structures (Fig. 2-64).
Medial Tendons. The same preparation and examination technique described for the peroneal tendons is used for the medial tendons. The main difference is the injection sites. The tibialis posterior tendon is the most anterior and is entered just posterior to the metaphysis of the medial malleolus (Fig. 2-63). The flexor digitorum longus and flexor hallucis longus are more posterior (Fig. 2-63) [207,208,239,249]. The posterior tibial tendon sheath begins 3 to 4 cm above the tibiotalar joint space and extends to the level of the navicular. Here the tendon spreads with expanded insertions on the navicular, cuneiforms, and metatarsal (second through fourth) bases [215].
The flexor digitorum longus and flexor hallucis longus lie posterior to the tibialis posterior (Fig. 2-63). In upto 25% of patients, these tendons share a common sheath [215]. The flexor digitorum longus can be injected initially because it is more easily located. These tendon sheaths also begin 3 to 4 cm above the tibiotalar joint and extend distally crossing inferior to the talonavicular junction. The flexor digitorum longus divides and inserts in the bases of the distal phalanges of the lateral four toes. The flexor hallucis longus inserts in the base of the distal phalanx of the great toe [215].
Anterior Tendons. The anterior tendons (tibialis anterior, extensor hallucis longus, and extensor digitorum longus) are less often studied than the medial and lateral groups. These tendons can be entered 2 to 3 cm above the tibiotalar joint or can be injected inferiorly using the dorsalis pedis artery as a landmark. The injection is made in the proximal dorsal foot. The tibialis anterior is most medial, the extensor hallucis longus just medial to the dorsalis pedis artery, and the extensor digitorum longus is lateral to the artery [215,249].
The tibialis anterior tendon sheath begins approximately 5 cm above the tibiotalar joint and extends to the level of the first cuneiform [215]. The extensor hallucis longus tendon lies just lateral to the tibialis anterior and begins about the same level, extending a variable distance, usually to the distal shaft of the first metatarsal. The combined tendon sheaths of the extensor digitorum longus begin just above the tibiotalar joint and end at the level of the tarsometatarsal joints [215,249].
Clinical Indications
Tenography is most commonly used to evaluate posttraumatic or overuse syndromes. The lateral tendons are most commonly studied. As noted above, tenography may be more accurate than arthrography for detection of calcaneofibular ligament tears [207,208]. If a ligament tear has occurred, injection of the tendon sheath will result in communication with the ankle joint. This does not occur normally. Extravasation can be normal and does not indicate a ligament tear (Fig. 2-65). Other conditions such as subluxation, dislocation, or stenosis of the tendon sheath after calcaneal fractures can also be evaluated with tenography [208,215,239,245].
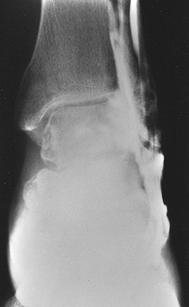
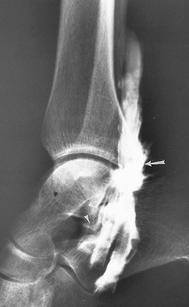
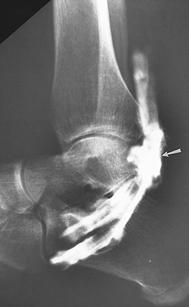
FIGURE 2-65 AP (A) and lateral (B) radiographs after peroneal tendon sheath injection. There is extravasation at the injection site (arrow). Lateral images were obtained in plantar flexion (B) and dorsiflexion (C). Note filling of the subtalar joint with the foot plantar flexed (small arrowhead in B).
MR imaging provides excellent image detail of the tendon and fluid in the tendon sheath. This technique is more commonly used today than tenography. However, tenography offers the advantage of including an anesthetic agent to confirm the site of symptoms [207,239].
Diagnostic and Therapeutic Injections, Aspirations, and Biopsy
Diagnostic and therapeutic injections can be accomplished in any of the articulations and tendons sheaths described above. Injections are usually combined with arthrography or tenography to confirm needle position and evaluate any abnormalities in the joints or tendon sheaths. Injections of the plantar fascia and tarsal canal and sinus can also be accomplished [208,239]. Synovial, soft tissue, and osseous biopsy may also be required in depending upon the expected pathology. Aspiration often accompanies these procedures, especially when infection or crystal arthopathies are suspected clinically [207,208].
Diagnostic and therapeutic injections are commonly performed in the foot and ankle. Injections of anesthetic can confirm the source of pain for planning of surgical procedures such as arthrodesis. Combined steroid and anesthetic injections are used for therapeutic purposes [207,228,232,247]. Fluoroscopy, CT, MRI, and ultrasound can all be used for image guidance of these procedures [205,208,232,234,242,247]. In most cases, fluoroscopy is adequate and readily available at most centers [207,208,239]. Joints of the foot and ankle are approached using the same technique as arthrograms described above. The smaller joints of the mid and forefoot can be positioned for the most direct point of entry [207,239].
Injections of the tarsal canal and sinus and plantar fascia can also be accomplished [239]. The tarsal canal is a cone shaped structure, wider laterally and angled at 45 degree to the axis of the calcaneus posteromedial to anterolaterally [229]. The contents of the canal include fat, ligaments, and neurovascular structures. Patient with sinsus tarsi syndrome present with local pain and point tenderness laterally. Most patients present with a history of inversion injuries and up to 79% have associated lateral ligament tears [228]. Injection of the sinus tarsi can be accomplished using a direct vertical lateral approach (Fig. 2-66) [207,228,239].
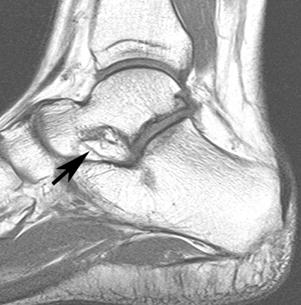
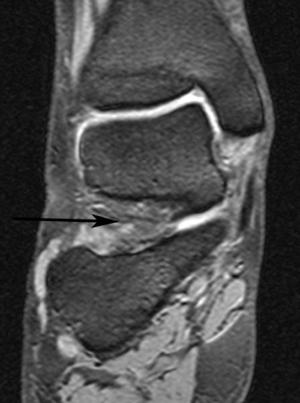
FIGURE 2-66 Tarsal canal and sinus. A) Sagittal T1-weighted image of the tarsal canal demonstrating fat content and one of the five ligaments (arrow). B) Coronal DESS image with low signal intensity fat and a long arrow indicating the direct lateral approach for sinus tarsi injections.
Plantar fasciitis is a painful chronic condition that may also respond to injection. Injection of the plantar fascia can be accomplished with the patient prone or supine using fluoroscopic or ultrasound guidance. The latter may be preferred as the injection is in the surrounding tissues and not into the fascia itself (Fig. 2-67). Injection into the fascia can lead to fascia disruption and loss of the longitudinal arch [244].
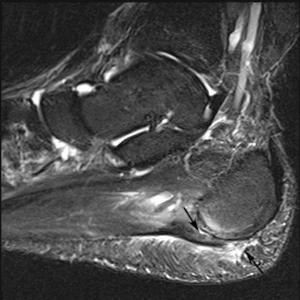
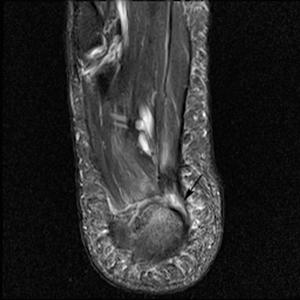
FIGURE 2-67 Plantar fasciitis. Fat suppressed fast spin-echo T2-weighted sagittal (A) and axial (B) images demonstrating thickening of the plantar fascia with high signal intensity above and below the fascia (arrows) and more focal involvement medially (arrow) in (B). The injection should be in the area of inflammation and not directly into the fascia.
As described above, for diagnostic injections we use a mixture of 50% iodinated contrast (arthrogram, tenogram, or needle tip confirmation) and 50% anesthetic (1% lidocaine hydrochloride or 0.5% ropivacaine hydrochloride depending upon the desired length of anesthetic effect). In cases where therapeutic effect is requested, we add 1 mL of steroid to the mixture. The amount injected varies with each site. Usually 1 to 2 mL is adequate except for the ankle or tenograms where 6 to 10 mL may be required [207,226,231,239].
We do not inject steroid if infection is in question or when there are joint replacements in place. Also, if surgery is contemplated in the next day or two, injection of anesthetic alone should be performed to avoid the need for steroid preps preoperatively. Diagnostic anesthetic injections are commonly used along with CT to plan joint fusions in the foot [207,222,226].
Soft tissue and osseous biopsy may also be required to confirm infection, or to obtain histology in the case of soft tissue or bone lesions. These procedures can be performed using 1% lidocaine hydrochloride local anesthetic and the usual sterile preparation. Though fluoroscopy is adequate in most cases, ultrasound is commonly used for soft tissue biopsy guidance [241]. There are multiple biopsy needles. The needle selected will depend upon whether bone or soft tissue is involved and the depth of the lesion. For example, short Temno (Bauer Medical, Clearwater, FL) needles may be used for soft tissue lesions. Bonopty (RADI Medical Systems, Uppsala, Sweden) or Ostycut (C.R. Bard, Covington, GA) needles can be used for bone biopsy. The reader is referred to Ref. 239 for more detailed information on bone and soft tissue biopsies.
In patients with open wounds or sinus tracts, it may be useful to inject these tracts with contrast material to determine the extent of bone or soft tissue involvement [208,217]. This can be easily accomplished using fluoroscopy, small pediatric feeding tubes to cannulate the sinus tract, and the same contrast medium used for arthrography. The extent of the sinus tract can be clearly defined and documented with spot films [217].
Complications
Complications associated with arthrograms, tenograms, diagnostic/therapeutic injections, and biopsies are uncommon. Obviously, the extent of each specific procedure is a factor. When complications do occur they are usually related to contrast agents or drug allergies. [210] Significant hemorrhage and infection are rare.
Complications secondary to arthrography, tenography, and other diagnostic injections using contrast medium are rare. The largest series reported using intravenous contrast media compared high-osmolar ionic to low-osmolar nonionic agents. The Katayama [226] study included 337,647 cases. Ionic contrast agents were used in 169,284 cases with an overall incidence of contrast reactions occurring in 12.66% of cases. Severe reactions occurred in 0.22% of patients. Nonionic agents were used in 168,363 patients with an overall reaction rate of only 3.13% and a severe reaction rate of 0.04%. Today, we use low-osmolar nonionic agents almost exclusively.
Newberg et al. [236] collected data on over 126,000 arthrograms in 1985. There were no deaths. The most common complication was sterile chemical synovits. Six patients had vasovagal reactions and urticaria developed in 61 patients. There were only six severe reactions (hypotensive episodes, vasomotor collapse with laryngeal edema, and one air embolism. The total number of complications was 150 in 126,000 cases or 0.1%. Similar results have been reported by others authors [213,216].
More recently, Hugo et al. [222] reviewed 262,000 cases including 13,300 MR arthrograms. Reactions occurred in 3.6% of patients. However, only 0.2% of contrast reactions were considered severe. Transient chemical synovitis, vasovagal reactions, and urticaria were considered minor reactions. Major reactions (0.3%) included septic arthritis, cellulitis, anaphylactoid reactions, and vascular injuries. We have not experienced any reactions using intra-articular gadolinium [208,252].
Recently, concern has been raised regarding potential adverse effects of anesthetic injections upon articular cartilage. Recent reports have shown that 0.5% or even 0.25% bupivacaine may cause chondrocyte death during in vitro studies. Some institutions have considered using different anesthetic agents though more research is required regarding this issue [224,225,239]. We currently use ropivacaine in place of bupivacaine.
We have not observed any significant complications associated with the injection techniques described earlier. Neural injury may potentially occur if the injection site is improperly selected. The only neurologic problem we have noted is transient deficit resulting from the anesthetic injection that may affect an adjacent nerve. This clears as the local anesthetic loses its effect [208].
Several additional uncommon complications may occur with bone and soft tissue biopsy. These include local bleeding, infection, nerve injury, and dissemination of tumor along the biopsy tract. As with injection techniques described above, these complications are uncommon [235,239].
VASCULAR TECHNIQUES
Until recently, arterial and venous invasive techniques were relied on heavily both for the diagnosis of vascular disease entities and anomalies and for the performance of any subsequent therapeutic vascular interventions. However, the emergence of vastly improved noninvasive diagnostic imaging techniques, such as magnetic resonance angiography, CTA, and ultrasound, has greatly reduced reliance on these invasive techniques simply for vascular diagnosis. [284] Increasingly, invasive vascular procedures are being reserved for the performance of specific therapeutic interventions on entities identified noninvasively or to confirm a diagnosis when noninvasive techniques are not possible or are not definitive. Venograms of the lower leg are generally reserved for instances in which ultrasound is inconclusive or when venous malformations are suspected. Lymphangiography is seldom of much value for diagnosis of entities below the knee [256,260,265–267,269,287,288,292,303].
Although these techniques are used sparingly in the foot and ankle, the appropriate use of invasive vascular procedures demands careful attention to technique. Also, a thorough knowledge of the relevant indications for each examination is required for accurate diagnosis and patient management.
In the past, arterial invasive procedures of the foot and ankle were most often performed utilizing a percutaneous transfemoral approach, a technique first described by Seldinger [256].
Diagnostic approaches include evaluation of the abdominal aorta with peripheral run-off images of the lower extremities (Fig. 2-68) and digital subtraction angiography (Fig. 2-69). The latter has become the reference standard for other imaging approaches such as magnetic resonance angiography and CT angiographic techniques [293,302,303]. Conventional diagnostic angiograms are most commonly performed following retrograde positioning a 4-5 F pigtail catheter in the abdominal aorta at the T12-L1 level. Nonionic contrast volume is 80 mL with and injection rate of 8 mL/sec. The aorto-iliac region is evaluated initially. In some cases, oblique views are required to fully evaluate the iliac branches. The lower extremity vessels are imaged using a step table technique. Digital subtraction images of the lower leg, foot, and ankle are obtained on the side of interest. Bilateral evaluation is commonly required in the setting of peripheral vascular disease [256,288,293].
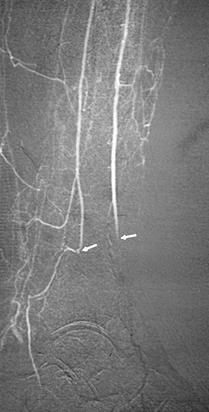
FIGURE 2-68 Arteriogram after a distal tibial fracture demonstrates occlusion of the anterior tibial and peroneal arteries (arrows).
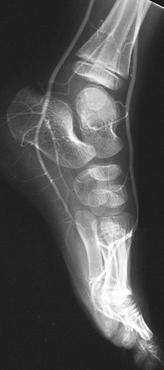
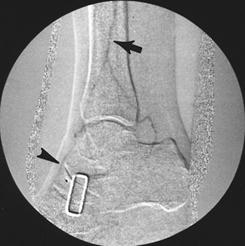
FIGURE 2-69 A) Lateral view of a normal arteriogram of the left foot in a child. B) Digital subtraction angiogram performed with venous injection demonstrates peroneal (upper arrow) and refilled anterior tibial artery (lower arrowhead) in an elderly patient with atherosclerotic disease.
Digital subtraction angiography for the foot and ankle has become the reference standard. Magnification views of selected anatomic regions are also easily obtained using digital subtraction angiography (DSA). Additionally, DSA is sensitive to low concentrations of contrast materials. For below the knee imaging, 12 mL of nonionic contrast is injected at 5 mL/sec [256,282]. For each step, table position images are obtained at four or more frames per second. Use of alternative contrast materials such as carbon dioxide and gadopentatate is also possible with DSA [271,276,279].
Digital subtraction angiography is costly, invasive, and can cause patient discomfort. However, high quality images and the ability to perform therapeutic interventions during the examination are distinct advantages compared to noninvasive MRA and CTA [280,282,303].
CT is now more commonly used for diagnosis of vascular disease with the advent of multichannel, multidetector CT [253,275,283,286,293,303]. New CT approaches provide an accurate, minimally, or noninvasive alternative to digital subtraction or conventional angiography [283,303]. Multiple studies have demonstrated sensitivities of 90% to 95% and specificities of 97% to 100% for vascular occlusive disease and trauma [286,303].
Protocols vary with the institution and specific equipment used. However, commonly used approaches include 120 effective kV, 140 mAs with dose modulation, rotation times of 0.5 seconds and table feeds of 40 mm/sec. Section thicknesses are typically 1 to 2 mm. Low-osmolar nonionic contrast is injected through a 20-guage Intracath placed in a vein in the antecubital fossa, forearm, or hand. The amount of contrast injected varies with the extent of the study. However, for limited foot and ankle imaging about 15 mL of contrast is injected at 4 mL/sec. Initiation of imaging varies depending upon the area of interest. There are software systems available that initiate imaging at a preselected time when the threshold attenuation reaches 250H [253]. Image reconstructions are obtained using MIP and 3D-reformatting [253,275,283,293,303].
Magnetic resonance angiographic techniques have also improved significantly in recent years [265,280–282,288,302]. Image quality with noncontrast techniques was not sufficient to evaluate the small vessels of the foot and ankle. The two most commonly used noncontrast techniques are phase contrast and time-of-flight MRA. Phase contrast MR angiography is useful to quantify flow [302]. This technique employs two sequences, one a flow sensitive sequence and the second a flow compensation acquisition. Signal intensity varies with flow direction and the flow encoding direction selected. Processing results in two image types. The initial acquisition (magnitude) demonstrates high signal intensity in flowing blood. The phase contrast (second sequence) presents velocity information such that flowing blood in the direction of the flow encoding gradient appears bright and flow in the opposite direction of the gradient appears dark. Phase encoding for MRA is not commonly used today due to artifacts created by flow turbulence and variations in flow velocity [302].
Similarly, time-of-flight techniques have been largely replaced by contrast-enhanced MR angiographic techniques. Disadvantages again are related to flow and turbulence issues and their related artifacts (Fig. 2-70).
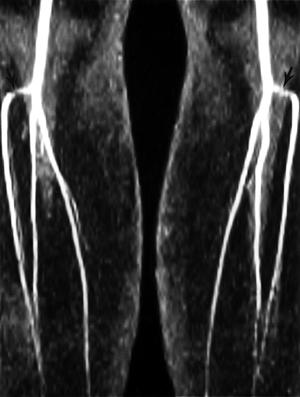
FIGURE 2-70 Time-of-flight lower extremity angiogram with signal reduction and irregularity of the proximal anterior tibial arteries (arrow) due to in plane flow saturation. (From Berquist TH. MRI of the Musculoskeletal System. 5th ed. Philadelphia: Lippincott Williams & Wilkins; 2006, with permission).
Today, there are multiple lower extremity MRA protocols. Most use contrast-enhanced approaches. In some institutions, both time-of-flight and dynamic contrast enhanced imaging are used. The protocols vary significantly due to equipment and coil availability [258,263,265,282,288]. There are also field strength variables. Conventional (1.5 Tesla) magnets have been optimized for angiographic studies. Though there are advantages to the newer 3.0 Tesla systems, technical issues still exist for MRA at this field strength.
Today, most diagnostic MR protocols include either a single dynamic contrast-enhanced approach or a hybrid approaches. In addition, focused examination of the foot and ankle can be accomplished using intravenous or intra-arterial contrast enhancement [265]. Dynamic contrast-enhanced 3D images with phase array coils and rapid table movement allows the bolus injection to be followed do the small distal arteries of the foot. Multiple injections at three different levels (pelvis, thigh, and calf) can also be accomplished if table motion techniques are not available [288,302].
Hybrid methods could include pre- and postcontrast techniques or multiple contrast injection techniques [263,280,286,300]. For example, one can perform a post contrast examination of the calf and foot followed by a second injection to include the aortoiliac region with runoffs using a bolus chase technique [263]. This approach typically uses about 20 mL of gadolinium for the first injection and 40 mL for the second scan sequence (Fig. 2-71). Readers are referred to Tatli et al. [300] and Ersoy and Rybicki [263] for more complete protocol information.
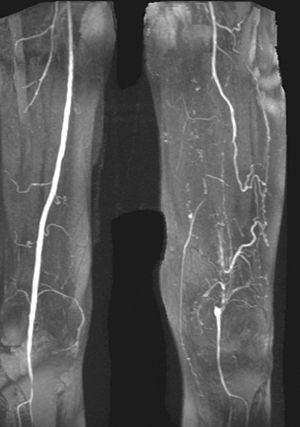
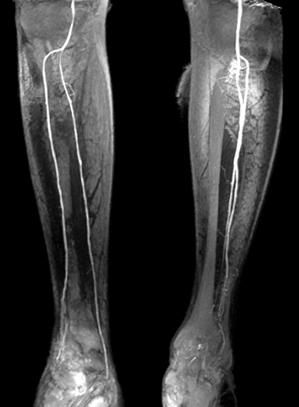
FIGURE 2-71 Vascular occlusive disease demonstrated using contrast-enhanced 3D-time-of-flight MR angiography. Coronal images of the thigh (A) and calf (B) demonstrate complete occlusion of the superficial femoral artery on the left with refilling distally via collaterals. The peroneal artery is occluded below the trifurcation on the right and the posterior tibial artery on the left is occluded.
Comparisons of contrast-enhanced MRA with digital subtraction techniques demonstrate that hybrid techniques have specificities of 98% for occlusive disease. In diabetics, hybrid MRA demonstrated a sensitivity of 95% and specificity of 90% to 95% [282].
Arterial Interventions
There are numerous indications for diagnostic and therapeutic arterial interventions of the foot and ankle. They include occlusive arterial disease, trauma, tumors, vascular malformations, vasculitis, and the preoperative delineation of arterial vascular anatomy [270,272,273,294–296]. The relative frequency of these indications varies depending on regional practice differences; however, occlusive arterial disease is generally the most common indication for vascular intervention. Occlusive arterial disease may be the result of atherosclerosis, thrombosis, embolism, or a combination thereof. Atherosclerotic narrowing of arteries is most common and primarily affects older patients, particularly men older than 50 years and postmenopausal women. Various predisposing factors include smoking, hypertension, hyperlipidemia, hypercholesterolemia, obesity, family history, diabetes, and genetic factors. Diabetes is particularly implicated in the accelerated narrowing of the small arteries of the foot and ankle [256,282,291,301,302]. Most patients with arterial insufficiency of the lower extremities present with intermittent claudication; few cases are initially heralded by a threatened limb [256,282]. Intermittent claudication is characterized by muscle pain that is induced by exercise and relieved with rest. The level of exercise necessary to induce claudication is typically constant. The pain usually develops in the muscles of the calf in patients harboring disease in the superficial femoral arteries and in the thigh and buttocks in patients with involvement in the aortoiliac artery segments. Whereas claudication implicates arterial insufficiency in the thigh, buttocks, and calf regions, it is an unusual indicator of foot and ankle vascular disease, although foot claudication can be a presenting feature in Buerger disease [256].
Ischemic rest pain, ulceration, and gangrene are common indicators of severe lower extremity vascular insufficiency, and they typically occur in the region of the foot and ankle [256,301]. In these patients with critical limb ischemia, multilevel vascular disease is common. Advanced atherosclerotic disease tends to involve the pelvic, infrainguinal, and infrageniculate arteries concurrently, with a predisposition to the more proximal vessels. Diabetes, on the other hand, disproportionately affects the infrageniculate and submalleolar vessels to a greater degree than the proximal vessels [282,301].
Treatment of arterial insufficiency in the foot and ankle may be a complex undertaking. Because atherosclerosis tends to be a diffuse disease, the potential exists for multiple sequential sites of vascular constriction proximal to the foot and ankle that need to be addressed to optimize therapeutic outcome [256]. In addition, the status of the coronary arteries must be assessed because of the increased risk of myocardial infarction during surgical intervention. Currently, various percutaneous endoluminal interventions are available as treatment options below the knee. These are discussed in more detail in Chapter 8. Briefly, these percutaneous interventions include angioplasty and thrombolysis using chemical infusion or mechanical techniques [256,273,295,296].
Trauma represents the second most common reason for arteriography of the foot and ankle (see Fig. 2-68). There is divergent opinion in the literature about the use of arteriography in blunt or penetrating trauma of the lower extremity, much depending on the nature of the individual practices. Generally, patients with definite clinical findings, such as absent pulses, pulsatile hemorrhage, large expanding hematoma, and distal ischemia, proceed directly to emergency surgery [272,301]. Although emergency arteriography may be employed in these patients if the area of injury is not readily amenable to exploration, this technique is frequently reserved for patients with softer clinical findings such as neurologic deficit, stable hematoma, or a history of arterial bleeding [270]. Elective conventional, CT or MRA is indicated when the likelihood of finding significant occult arterial injury is low and the patient has no pulse deficit [257,270,299]. This topic is addressed more thoroughly in Chapter 8.
Venous Interventions
Ultrasound techniques have largely replaced lower extremity venograms in the evaluation of potential deep venous thrombosis. B-mode compression combined with color duplex flow imaging of the lower extremity deep veins is accurate in excluding or including the diagnosis of deep vein thrombosis. MRI can also be useful for evaluation of venous structures and the adjacent soft tissues. Inflammatory changes and muscle or tendon tears can mimic deep venous thrombosis (Fig. 2-72). However, venography remains a low-risk, albeit invasive, technique that is highly available and quite useful for the evaluation of the lower extremity deep veins when ultrasound studies are indeterminate or when clinical suspicion persists in the face of negative venous ultrasound or MR studies (Fig. 2-73) [252,256,269].