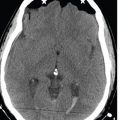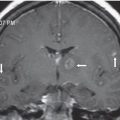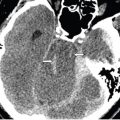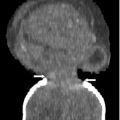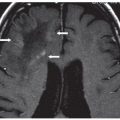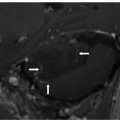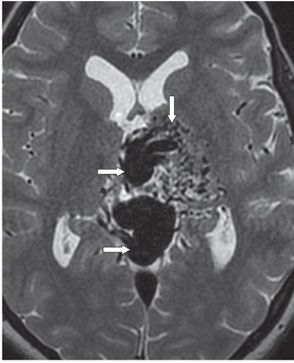
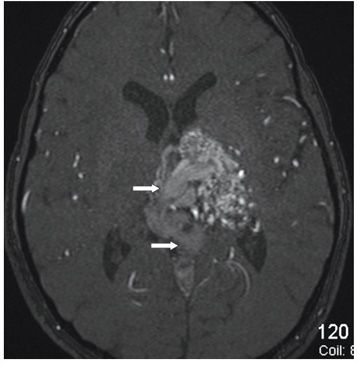
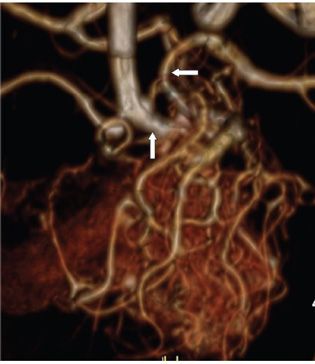
FINDINGS Figure 35-1. NCCT through the thalamus. There is a heterogeneous mass in the left thalamus (vertical arrow) with tubular hyperdensities extending into a large tortuous midline hyperdense tubular structure—enlarged internal cerebral vein (transverse arrow). There is local mass effect. Figure 35-2. Axial T2WI through the thalamus. There is a collection of tubular signal voids in the left thalamus (vertical arrow) extending into a large tortuous signal void in the midline consistent with a large internal cerebral vein and great vein of Galen (transverse arrows). Areas of hyperintensity are seen surrounding the tubular signal voids in the left thalamus. These areas possibly represent gliosis. Figure 35-3. Axial 3D TOF MRA source image through the thalamus. There is a collection of serpentine tubular structures in the left thalamus. Large tortuous internal cerebral vein and vein of Galen are visualized (arrows). Figure 35-4. Volume-rendered 3D TOF MRA best projection. There is a left thalamic tangle of vessels (the nidus) with many large feeding arteries from the enlarged left P-Com artery and the left posterior cerebral artery (PCA) (arrows).
DIFFERENTIAL DIAGNOSIS
Stay updated, free articles. Join our Telegram channel

Full access? Get Clinical Tree


