Fig. 8.1
Two-dimensional depiction of 12-core TRUS biopsy of the prostate, accounting for apex, mid-gland, base with medially directed and laterally directed cores for each lobe of the prostate
Despite the increase in diagnosis of PCa, TRUS biopsy is widely recognized to fail to diagnose up to 30% of patients. We also know that TRUS biopsies have not improved spatial determination of PCa [23]. In a cohort of 2,299 men who underwent biopsy in a community setting using the standard 12-core biopsy method, the cancer detection rate was only 44%, based on cancer suspicion from PSA and DRE findings [24]. This figure not only reflects the sensitivity and specificity of PSA and DRE, but also showcases the inherent difficulties of these tests with respect to medical counseling in those with negative TRUS biopsy results but continued clinical suspicion for cancer. Patients with negative biopsies despite rising PSA often harbor PCa. Careful consideration with a low threshold to re-biopsy offers reasonable chance of detecting clinically significant cancer [25].
While 12-core TRUS-guided biopsies have increased cancer detection, they do not serve to adequately identify candidates for TFT. Specifically, routine transrectal biopsies that identify a single positive core do not necessarily exclude the presence of bilateral disease. Barber et al. looked at 129 men with a single positive core, and 46(36%) subsequently proceeded to RP. Eighty percent of these patients had contralateral disease and 22% had a component of high-grade disease in the previously undiagnosed contralateral lobe [26]. Additionally, the majority of cancer occurs in the peripheral zone. At the apex, the peripheral zone tissue extends anterior to the urethra, and RP specimen studies show that tumor frequencies are highest in the mid gland (85.5%) and the apex (82.3%) where DRE is less likely to detect cancer [27–29]. A study evaluating the location of unique PCa noted that the most common site of isolated disease is the anterior apex, where, according to their results, 17% of cancers would be missed if this area were not biopsied [30]. In fact, tumor located within the anterior region of the prostate requires a greater number of biopsy sessions to identify these lesions than those located in other areas of the gland [31]. Jones et al. examined the utility of adding extreme anterior apical biopsies for the initial detection of PCa. This method increased the initial detection to 47.5%, while all apical cores have the highest rate (73.6%) of cancer detection among patients with positive biopsy findings [32]. Karakiewciz showed that sextant biopsy yield decreases as prostate size increases [33]. Additionally, increasing the number of biopsy cores improves the concordance of biopsy Gleason score to prostatectomy Gleason score [34, 35]. These studies stress the need for optimal location and number of prostate biopsies. While recognition of the pitfalls of TRUS biopsy is necessary in order to improve diagnostic yield in patients harboring clinically significant PCa, TRUS biopsy is not inherently reproducible owing to sampling bias.
Despite optimization of TRUS needle biopsy techniques, the standard extended 12-core TRUS biopsy does not perform an adequate job in characterizing the location, size, laterality, or focality of specific lesions within the prostate. Clinicians find positive biopsies difficult to interpret in many instances to ascertain whether that cancer diagnosis represents significant disease or potentially worse disease. As discussed earlier, many cancers are incorrectly staged and graded when compared with radical prostatectomy specimens, leading to non-matched treatments [8, 9]. These unknowingly aberrant results can, in some cases, lead to more uncertainty, further complicating the management algorithm [36]. For example, patients with strong clinical suspicion of PCa may undergo multiple negative TRUS biopsies, increasing patient anxiety and potentially delaying treatment. Patients with high-grade disease at TRUS biopsy should likely proceed to definitive therapy. Those with apparent low-grade disease may benefit from an intermediate staging step like 3DMB. As mentioned, staging allows for better matching of treatment, potentially allaying anxiety and decreasing overall morbidity from PCa-related care. 3DMB is a necessary requisite based on the shortcoming of TRUS biopsy to fully characterize disease status, remove those patients unsuitable for TFT (with worse, aggressive, larger volume disease), and treat those amenable cancers with TFT. As an example, 3DMB may identify larger volume, less-differentiated disease unsuitable for TFT or AS, or this staging procedure can serve to rule-in potential candidates for less-aggressive therapies.
AS is not frequently chosen as a management option in the USA, and studies examining quality of life and it is not clear how many are offered as by their cardiologist to PCa diagnosis and treatment remain mixed. Currently, only 6.8% of men choose active surveillance (although we cannot know how many are offered active surveillance by their urologist) and 10–50% of those ultimately abandon it in lieu of other treatments [37]. Understaging with TRUS biopsy likely remains one of the main reasons patients abandon AS. Men with worse disease missed at TRUS biopsy and entered into AS protocols will fail sooner and ultimately seek definitive therapy. 3DMB could potentially aid in the staging of these men to decrease AS failure rates by excluding men deemed unsuitable for AS by properly identifying and excluding larger volume, higher Gleason score disease prior to initiation of treatment. Interestingly, other countries have significantly higher rates of patients enrolling and remaining in AS [38]. Controversy exists as to changes in quality of life between various options for managing and treating PCa. Some studies indicate that patients in active surveillance programs may have a decreased quality of life due in part to the psychological stress of living with untreated cancer [39]. Another study by Litwin et al. demonstrated that all men experience some decline in mental health status and quality of life due to a cancer diagnosis, regardless of the type of treatment. This group indicated that limitations from the disease were most prevalent in younger and sicker men. Additionally, the study authors noted slightly worse outcomes in men in AS compared to men undergoing RP and XRT [40]. Ultimately, men with PCa may experience certain levels of anxiety regardless of treatment choice. With additional information regarding disease severity using 3DMB, better patient education and cognitive reframing may increase the use of AS and decrease overtreatment for low risk PCa [41].
TFT presents urologists and patients with a new middle ground between the extremes of whole-gland therapy and AS. Ahmed described the role that the index lesion, or the largest tumor focus, within the prostate plays in the natural history of the disease [42]. Increasing evidence suggests that, despite the multifocality of PCa, it evolves and metastasizes from a single focus, and arguably, a single cell located in the index lesion. By targeting and destroying this tumor focus, urologists may be able to maximize clinical outcomes while minimizing treatment-associated morbidities. Whole-mount RP studies show that 20–25% of men have a single index tumor and an additional 40–60% have a single index tumor with other small lesions (<0.5 cm3), which are not clinically significant [43–45]. With the size and multifocality of tumor index decreasing due to earlier detection, TFT has emerged with promising results. It achieves good local control and minimal morbidity compared to whole-gland treatment. As stated, however, a precise, three-dimensional map of tumor foci within the prostate is needed for successful TFT [13, 15, 17, 22, 46, 47]. Ahmed and Emberton wrote a review specifically recommending more randomized clinical trials evaluating the efficacy of TFT using 3DMB as a staging technique [48].
Other options for three-dimensional imaging and mapping of the prostate are promising. Specifically, contrast enhanced ultrasound, Histoscanning™, elastography, and various functional MRI techniques show promising results. Despite promising advances in imaging, they are still not adequate for optimal lesion localization [15, 49]. The sensitivity (66–86%) and specificity (77–94%) of these imaging techniques vary considerably [50, 51]. Until further studies prove that they are beneficial and cost-effective, traditional diagnostic methods such as biopsy will continue to be used in their place.
Indications for 3DMB include patients with apparent low volume, low-grade disease (Gleason ≤ 7, PSA ≤ 10) who are considering AS or TFT who need further staging of disease. As well, patients with one or more negative TRUS biopsies despite high clinical suspicion of PCa (abnormal DRE, high PSA, rapid PSA doubling times) should be considered candidates for 3DMB [17, 22, 46, 52, 53].
In summary, 3DMB serves two accurately functions:
1.
3DMB is needed to accurately localize cancer within the gland. Other preoperative staging techniques—imaging modalities and TRUS biopsy—are not accurate and do not reflect RP specimen pathology to the fidelity required to target and treat individual cancer foci [7, 8, 47]. Other staging techniques (MRI, ultrasound, TRUS biopsies, and transrectal saturation biopsies) do not adequately or reproducibly localize cancer foci.
2.
3DMB determines suitability for TFT and active surveillance by virtue of identifying those men with larger volume, bilateral, higher grade disease which necessitates radical treatment [52].
DMB Techniques
Transperineal biopsy was first performed in 1972 by Peck, but then it fell out of favor with the emergence of the transrectal method with antibiotic prophylaxis [23, 54]. The modern template-guided transperineal method using real-time ultrasound guidance was first described by Igel et al. in 2001 [55]. The technique was then adopted, modified, and further described in 2003 by Barzell and Whitmore [56]. Barzell reported his series of patients in 2007. All accepted methods are similar, performed under real-time TRUS guidance, and rely on a five-mm core spacing with the rational that lesions less than 0.5 cm3 are not clinically significant [45]. Five millimeter spacing provides the most effective method for detecting and mapping PCa [41, 51, 57].
In 2005, Crawford et al. performed a study to evaluate the efficacy of template-guided transperineal staging or mapping biopsy to serve as a guide for TFT. In this study, three-dimensional computer models using 86 autopsy prostate specimens and 20 stage T1c radical prostatectomy specimens were created. Transperineal biopsies were simulated for grid sizes of 5 mm and 10 mm with an 18-gauge, 23-mm-long biopsy needle. They found that with the 5-mm method, the sensitivity and NPV were both 95%. The specificity of this method is lower (30%) because 3DMB detects nearly all cancer foci, regardless of significance (i.e., small-volume, Gleason 6, insignificant cancer). The 10-mm grid spacing did not perform an adequate job in detecting clinically significant cancer, providing evidence that 5-mm biopsy spacing is optimal for this purpose [57].
DMB Procedure and Technique
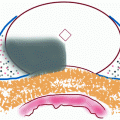
With the patient in the dorsal lithotomy position, a transrectal ultrasound probe mounted on a stepper is attached to a standard 5-mm brachytherapy template grid secured against the perineum. Figure 8.2 demonstrates this setup. A Foley catheter may be placed in the urethra to aid in identifying the urethra and assess for hematuria before completing the procedure. Biopsies are obtained at 5 mm intervals from the apex to the base, laterally to medially, and anterior to posterior until the entire gland has been sampled using a standard 18-guage automated biopsy gun [17]. Midline biopsies are obtained posterior to the urethra to avoid urethra perforation. Deeper (base) versus shallow (apex) passes at the same grid position are performed to ensure complete gland coverage. Each biopsy is labeled with x-y-z coordinates and placed in separate jars [41]. Using this method, the number of biopsies is based on prostate size and configuration, and a near-constant biopsy per volume is obtained, standardizing specimen number between patients. If the prostate is too large or inaccessible due to pelvic anatomy, a trial of 5-alpha reductase can be given to shrink prostate for accessibility [41]. Some clinicians also use 5-alpha reductase inhibitors to reduce intraoperative bleeding [47]. Prostate gland mobility and dynamic movement with respiration within the pelvis during the procedure may adversely affect the accuracy. Artificial marking with mock beads (gold fiduciary markers), which are used extensively in brachytherapy protocols, can be used to overcome this difficulty [13]. Although the procedure is usually performed under monitored anesthesia, it has also been carried out in office under a periprostatic block and local anesthesia [17].
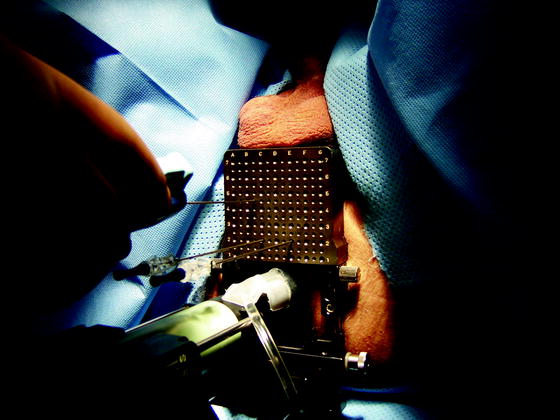
Fig. 8.2
Demonstration of transrectal ultrasound transducer placement in relation to perineal 5-mm biopsy grid
Post-biopsy Processing of the Biopsy Cores
Independent from the biopsy mode (transrectal oder transperineal), processing of the biopsy cores may have an important impact on the information gained. Putting all biopsy cores into one jar or using one jar filled with formalin for left and one for right side biopsies, as usually performed by some urologists, only gives information on how many percent of the cores are infiltrated with cancer, but provides no information on the exact localization of cancer foci. Using a separate jar for every location results in better information on localization of cancer. However, there are still few information on the relationship of the cancer to the prostatic capsule which may be important for therapy planning. In order to get the maximum information out of the biopsy cores, Stock et al. described the self-embedding procedure [58]. It was originally used for transrectal biopsies but could also be adopted for 3DMB. Every core is placed on a small, saline-tinctured piece of tissue, marking the proximal (apical) and distal (basal) end immediately after bringing it out of the biopsy needle (Fig. 8.3). If the core is fragmented, the pieces are arranged in the right order. After having completed the biopsy procedure, each core is colored with hemalaun solution. Then they are covered with a second piece of saline-tinctured tissue and separately fixed in metal clamps in order to avoid shifting. The closed metal clips are put together in a formalin-filled container and sent to the pathologist.
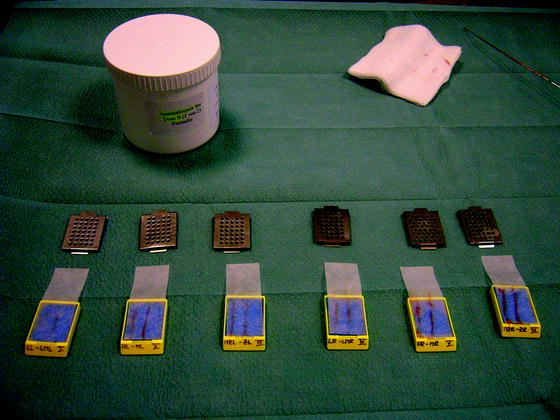
Fig. 8.3
Every biopsy core is placed on a small, saline-tinctured piece of tissue marking the proximal (apical) and distal (basal) end immediately after bringing it out of the biopsy needle, aiding in future localization and orientation for purposes of 3D registration of pathology results
Two limitations, however, are still present: The whole procedure depends on the accuracy of the urologist performing the biopsy: If he labels a core as “right apex,” but did not place the biopsy needle correctly, the information that cancer foci are present or absent in the right apex may be incorrect. The second limitation is that we have a lot of written information after histopathological examination of the biopsy cores, but no adequate illustration showing the cancer foci detected within an image of the prostate.
To fill the gap, we suggest the use of a capsule model as a reference frame for 3D rigid image registration.
To model the capsule, several approaches are possible:
1.
Like in computer-aided design (CAD), one tessellates the object’s surface using triangular facets. Each facet is characterized by three vertices and an outward normal. While this provides sufficient flexibility to tessellate any surface, this approach requires a large number of vertices to be entered manually. Note that the number of vertices grows quickly when a fine grained surface is required.
2.
Another approach consists of placing an inflatable bubble (active contour, snake) inside the prostate’s volume [59]. The bubble is then inflated until it is firmly attracted by the capsule. The method is attractive since it requires almost no user interaction. However apertures in the capsule cause the algorithm to diverge. We did not observe convergence in datasets sampled from everyday clinical practice [60].
3.
A third approach is to take a few capsule points as knots for spline interpolation. 3D splines are well understood and are highly deformable [61]. They can resemble the capsule accurately depending on the number of knots taken. We have used this approach to model open surfaces, i.e., capsules which were insufficiently represented using the ultrasound cone.
4.
Since the capsule is closed, we suggest an intermediate approach based on expert knowledge. An urologist takes a sufficient number of capsule points from a 3D dataset. These points are then used as reference points for a series expansion using spherical harmonics. In other words, spherical harmonics serve as interpolation functions between capsule points.
With respect to spherical harmonics, we refer to the nomenclature presented in [62–65]. An introduction to series expansion is given in [66]. Since we are dealing with two angular variables, we suggest an equal number of quadrature rules. This is in contrast to [66] where only one rule has been applied.
The aim of our work is to use the surface model as a reference frame. Since each biopsy core is located in its own frame, particular capsules have to be modeled. Each model is then translated and rotated until it overlaps the reference model. The different biopsy cores are thus displayed within a single reference frame using coordinate transformation.
We have shown that no external fiducial markers have to be used to overlap particular dataset. The datasets are taken during prostate biopsy at no extra cost or extra time.
To actually calculate a series expansion using spherical harmonics, we need to construct these functions. It is convenient to write spherical harmonics as a product of two angular functions  and
and  . We first study the basic properties of these functions before we turn to the series expansion. Finally we give a worked example.
and . We first study the basic properties of these functions before we turn to the series expansion. Finally we give a worked example.Basic Principles of 3D Reconstruction
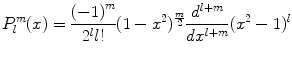
Consider the associated Legendre functions  which are a generalization of the Legendre polynomials
  . While the Legendre polynomials describe problems with azimuthal symmetry, the associated Legendre functions provide azimuthal variability. One has
which are a generalization of the Legendre polynomials . While the Legendre polynomials describe problems with azimuthal symmetry, the associated Legendre functions provide azimuthal variability. One has(1.1)
Or, using Rodrigues’ formula
which holds for both positive and negative m. One can show that
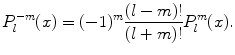
(1.2)
(1.3)
For fixed m, the functions  form an orthogonal set with respect to l. The orthogonality relation is
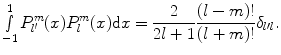
form an orthogonal set with respect to l. The orthogonality relation is(1.4)
To model a surface in 3D, we need a second set of functions with polar variability. Here, the functions 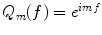 form a complete set of orthonormal functions with respect to m,
 ![$$ f\in \left[0;2p\right]$$](/wp-content/uploads/2016/04/A214191_1_En_8_Chapter_IEq00087.gif) . Consequently the product
. Consequently the product  forms a complete set of functions on the unit sphere with respect to l and m. Normalizing
  yields
form a complete set of orthonormal functions with respect to m, . Consequently the product forms a complete set of functions on the unit sphere with respect to l and m. Normalizing yields(1.5)
The  are denoted as spherical harmonics. For negative m, we obtain an expression similar to (1.3):
  , where


are denoted as spherical harmonics. For negative m, we obtain an expression similar to (1.3): , where
Related posts:

Stay updated, free articles. Join our Telegram channel
Full access? Get Clinical Tree
