Arthritis
Thomas H. Berquist and Laura W. Bancroft
- Introduction
- Osteoarthritis/Degenerative Joint Disease
- Rheumatoid Arthritis
- Juvenile Idiopathic Arthritis
- Seronegative Arthropathies
- Neuropathic Arthropathy
- Metabolic Arthritides
- Gouty Arthritis
- Calcium Pyrophosphate Dihydrate Deposition Disease (CPPD)
- Hydroxyapatite Deposition Disease (HADD)
- Hemochromatosis
- Gouty Arthritis
- Collagen Vascular Disease
- References
INTRODUCTION
Evaluating arthropathies involving the foot and ankle requires a systematic approach [14,26]. The imaging features are often mixed with degenerative or osteoarthritis superimposed upon or seen in conjunction with other arthropathies. This chapter will review the image findings of common arthritic disorders focusing on radiographic features. Radiographs remain the primary screening technique for detection and follow-up of arthritic disease. Additional modalities, including ultrasound and MR imaging will be included when appropriate. Treatment approaches, specifically operative intervention, will be discussed in Chapter 10.
OSTEOARTHRITIS/DEGENERATIVE JOINT DISEASE
Osteoarthritis, also termed degenerative joint disease or osteoarthrosis, is the most common arthritic condition [6]. This arthropathy increases with aging. Up to 40% of the population over 70 years of age have osteoarthritis. This condition results in yearly medical costs greater than $100 billion dollars in the United States [93].
The etiology is complex. The concept of overuse and aging has been present for years. Hyaline cartilage was the focus of research for years [93]. However, the complexity of the condition is still not completely understood. As with many arthropathies, there are multiple factors that result in the clinical symptoms and image findings [6,44,69,87,93]. Genetics or familial etiologies, and obesity are also linked to the development of osteoarthritis [69]. Primary osteoarthritis occurs in the absence of any obvious underlying abnormalities, whereas secondary osteoarthritis is the result of alterations from a preexisting disorder, such as other arthropathies or prior trauma [69]. The joints of the foot and ankle are affected differently. For example, primary osteoarthritis of the ankle is uncommon. Prior trauma and altered biomechanics are the most common causes of degenerative joint disease in the ankle (Fig. 5-1) [20,87]. As discussed in Chapter 3, anterior ankle impingement may be related to degenerative bone changes related to repetitive dorsiflexion loading at the anterior ankle (Fig. 5-2). These forces are most commonly seen in football and baseball catchers [44]. Scranton and McDermott [80] classified the osseous stages for anterior osteophyte formation associated with impingement. Stage I lesions demonstrate anterior tibial osteophytes measuring less than 3 mm. Stage II lesions demonstrate anterior tibial osteophytes greater than 3 mm in length. Stage III lesions have both anterior tibial and talar osteophytes (Fig. 5-2) and Stage IV lesions demonstrate global ankle arthrosis [80].
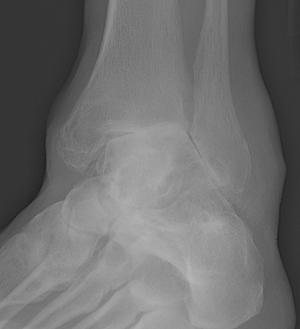
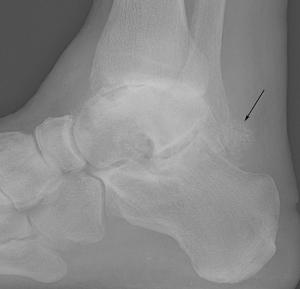
FIGURE 5-1 Post-traumatic ankle secondary osteoarthritis. Mortise (A) and lateral (B) images of the ankle demonstrating marked asymmetric narrowing of the ankle joint and lateral mortise with subchondral sclerosis. There is a large osseous loose body in the posterior recess (arrow).
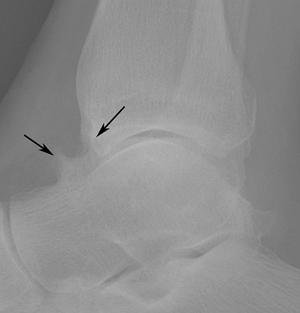
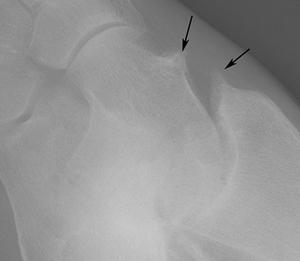
FIGURE 5-2 Anterior ankle impingement. Stage III anterior ankle impingement. Lateral (A) and oblique (B) radiographs demonstrating talar and anterior tibial osteophytes (arrows).
In the foot, osteoarthritis can affect any joint. The first metatarsophalangeal (MTP) joint is commonly involved. When advanced there may be restricted motion termed hallux rigidus (Fig. 5-3) [41,82]. Hallux rigidus along with the classification and management will be discussed in Chapter 10 with other reconstructive procedures.
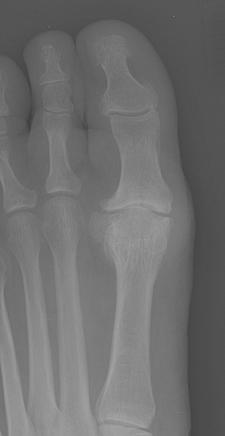
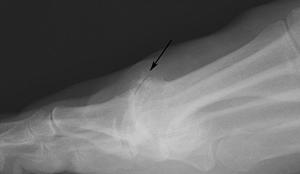
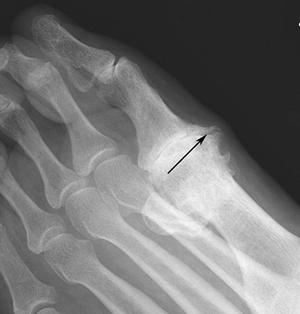
FIGURE 5-3 Hallux rigidus. AP (A), lateral (B), and oblique (C) focal images of the first metatarsophalangeal joint demonstrating marked joint space narrowing with no hallux valgus and dorsal osteophyte formation (arrow).
The radiologic hallmarks of osteoarthritis (degenerative) arthritis include: (i) normal bone density, (ii) joint incongruency, (iii) subchondral sclerosis, (iv) osteophyte formation, (v) subchondral cysts, (vi) bilateral, but asymmetric distribution [14,26,69]. Osteoarthritis is the degenerative change of fibrous, cartilaginous, and synovial articulations. One of the earliest radiographic signs is the formation of new bone at the margins of the articular surface. The osteophytes are composed of both cancellous and cortical bone, which blends imperceptibly with the normal adjacent bone (Fig. 5-4) [69]. This is an extremely important radiographic sign, because bone production is rare in rheumatoid arthritis. Because the protective cushion of cartilage is lost, trauma to the articular bone surface stimulates osteoblastic activity, resulting in eburnation or subchondral sclerosis (Fig. 5-5). These changes are most prominent at the points of maximal weight bearing. Nonuniform joint space narrowing may occur either early or late during the course of the disease. In contrast to that seen in rheumatoid arthritis, thinning of the joint space in this condition is almost invariably nonuniform or asymmetric (Fig. 5-6) [26,69]. Subchondral cysts may form but alone, they are of little diagnostic value (Fig. 5-7). Osteocartilaginous loose bodies commonly form within the joint (see Fig. 5-5).
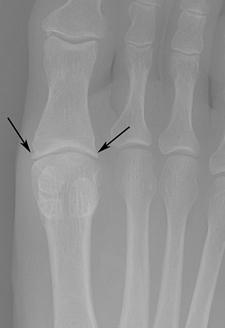
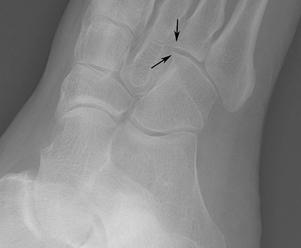
FIGURE 5-4 Marginal osteophytes. AP radiograph of the first metatarsophalangeal joint (A) and oblique image of the cuboid-fourth metatarsal base (B) demonstrating early marginal osteophytes (arrows). There is asymmetric joint space narrowing in (A).
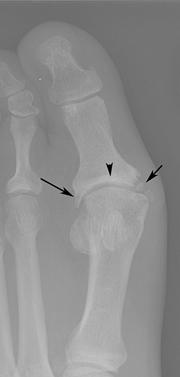
FIGURE 5-5 Standing AP radiograph demonstrating a prominent osteophyte (long arrow), medial loose bodies (short arrow), and subchondral sclerosis (arrowhead). There is also rotation of the lateral sesamoid with reactive new bone formation.
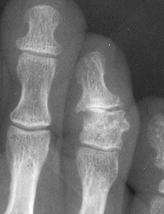
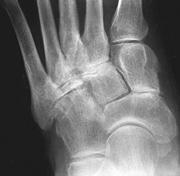
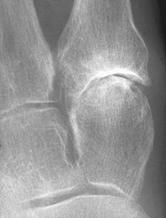
FIGURE 5-6 Osteoarthritis involving less common locations in the foot. A) Moderate osteoarthritic changes in the third DIP joint.B) Asymmetric joint space loss and subchondral sclerosis of the naviculomedial cuneiform joint and the second through fourth TMT joints.C) Asymmetric joint space loss and subchondral sclerosis of the first TMT joint, with a small subchondral cyst and marginal osteophyte laterally.
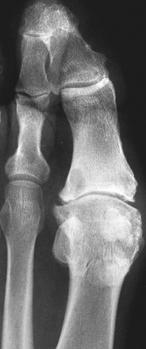
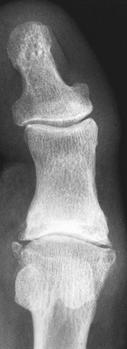
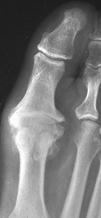
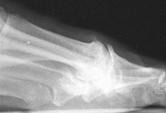
FIGURE 5-7 Osteoarthritis involving the first MTP joint, the most common location in the foot. A,B) AP radiographs of the first MTP joint demonstrate asymmetric joint space loss, osteophyte formation, and subchondral sclerosis. Also note the loose body lateral to the joint in (B) and the subchondral cysts in the lateral aspects of the proximal phalanx and metatarsal head in (A) and in the medial metatarsal head in (B). C,D) AP and lateral radiographs A B of the first ray demonstrate hallux rigidus.
Probably the most common site of degenerative joint disease of the foot and ankle is the first MTP joint (Figs. 5-3 and 5-7). The usual changes consist of asymmetric joint space narrowing, osteophyte formation, and subchondral sclerosis. The osteophytes are largest dorsally and laterally. They frequently cause painful limitation of dorsiflexion of the great toe, referred to as hallux rigidus (see Figs. 5-3 and 5-7C,D). Flattening and deformity of the metatarsal head, subchondral cysts, and loose bodies also may be seen. Osteoarthritis of the second through fifth MTP joints is unusual, but it can be seen in any MTP joint that becomes the primary weight-bearing joint [14,69]. Interphalangeal (IP) degenerative joint disease usually involves the first digit. Involvement of other digits is unusual and it is usually asymptomatic (see Fig. 5-6A) [26]. Digital involvement can result in claw toe, hammer toe, mallet toe (flexion of the distal IP [DIP] joint), and curly toe (flexion of the proximal IP [PIP] and DIP joints) (see Chapter 10) [69]. Degenerative joint disease also occurs throughout the tarsometatarsal (TMT) and intertarsal joints (see Fig. 5-4). The changes in the TMT joints are more common medially, especially at the first TMT joint (see Fig. 5-6C). In this location, joint space narrowing and sclerosis may simulate gout [69]. When the degenerative changes are generalized, they may be superimposed on an inflammatory condition. Degenerative changes of the midfoot may also be secondary to previous trauma or abnormal motion related to tarsal coalition or surgical fusion. The talonavicular portion of the anterior talocalcaneonavicular joint is the most common hindfoot joint affected by osteoarthritis, resulting from previous trauma or, rarely, occurring spontaneously. Early neurotrophic arthropathy may also be confused with degenerative joint disease of the midfoot [26,69].
Plantar and posterior calcaneal enthesophytes at the attachment of the Achilles tendon, plantar aponeurosis, and long plantar ligament are commonly seen and are often clinically silent (Fig. 5-8) [69]. The enthesophytes are almost always well defined and reflect ligamentous or tendinous traction.
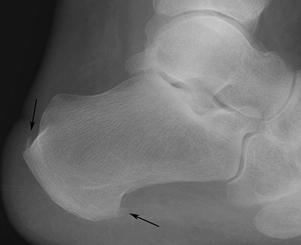
FIGURE 5-8 Lateral radiograph of the calcaneus demonstrating plantar and Achilles enthesophytes (arrow).
Primary degenerative joint disease of the ankle is unusual (Fig. 5-2) [20,44,81]. Findings include joint space narrowing, subchondral sclerosis, and talar beaking resulting from capsular traction. These changes can be distinguished from those of tarsal coalition because the osteoarthritic dorsal talar spur is posterior to the talonavicular joint, osteophytes can involve the anterior tibia, and joint space loss is usually noted (see Fig. 5-1) [26]. Secondary osteoarthritis is much more common and usually related to prior trauma [20,81].
Radiographs are usually adequate for detection of osteoarthritic changes. However, CT and MR imaging are useful for more accurate evaluation of the extent of bone loss and associated soft tissue changes. CT is particularly useful for operative planning when artroplasty or arthrodesis are indicated (Fig. 5-9) [75].
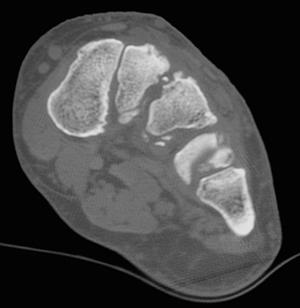
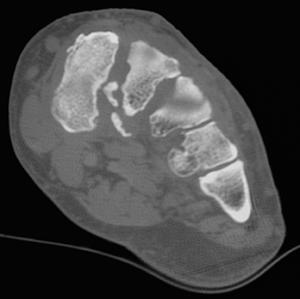
FIGURE 5-9 Preoperative CT of the midfoot. Coronal images (A,B) prior to arthrodesis.
MR imaging is not commonly performed for osteoarthritis compared to inflammatory and erosive arthropathies such a rheumatoid arthritis. However, imaging features seen on radiographs are also apparent on MR images. Synovial inflammation, early erosions, cyst, and soft tissue abnormalities are apparent on MR images (Fig. 5-10). In addition, the presence of marrow edema has been correlated with pain, the progression of osteoarthritis [6,24,40,73,94]. T1-weighted spin-echo and T2-weighted fast spin-echo sequences with fat suppression are performed in the axial, sagittal, and coronal planes. These sequences demonstrate osseous changes including marrow edema and associated capsular and periarticular soft tissue changes. Small field of view dual echo steady state sequences (DESS) are useful for evaluation of articular cartilage. Contrast-enhanced images provide effective evaluation of the synovitis. MR arthrography is rarely indicated for osteoarthritis of the foot.
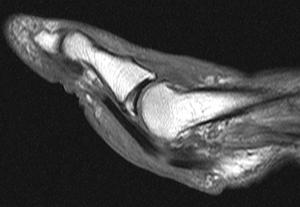
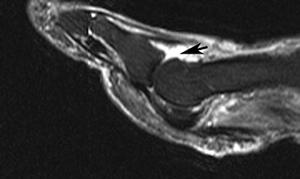
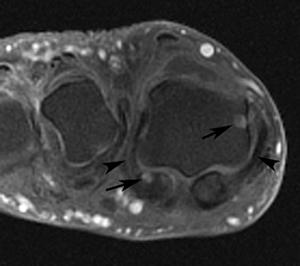
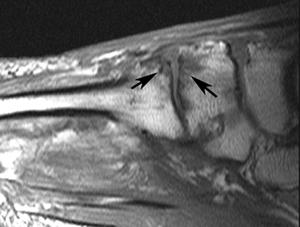
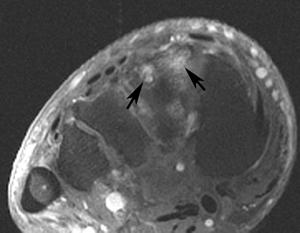
FIGURE 5-10 Osteoarthritis. Sagittal T1-weighted (A) and fat-suppressed fast spin-echo T2-weighted (B) images of the first metatarsophalangeal joint demonstrate early osteophyte formation and a joint effusion (arrow).C) Axial fat-suppressed postcontrast T1-weighted image demonstrates cystic changes in the metatarsal head and lateral sesamoid (arrows) with capsular thickening (arrowheads). Sagittal T1-weighted (D) and axial T2-weighted (E) images of the midfoot demonstrate subchondral marrow edema and cystic changes (arrows).
RHEUMATOID ARTHRITIS
Rheumatoid arthritis is a systemic inflammatory arthropathy with a symmetric appendicular distribution. This autoimmune disorder is chronic and usually progressive in nature [90]. Rheumatoid arthritis affects 3% of females and 1% of males in the general population. The most common age groups affected are the fourth and fifth decades. Except for the cervical spine, the axial skeleton is less commonly involved [14,69]. The foot is commonly involved with active disease occurring at some point during the course of disease in 90% of patients [13]. The MTP joints are involved in up to 90% of patients. The forefoot is the first site of involvement in up to 15% of patients [37]. The midfoot articulations are involved in 40% to 60% and the ankle and subtalar joints 30% to 60% of patients with rheumatoid arthritis [90].
Rheumatoid factor is usually positive. However, this test may be negative in up to 15% of patients (seronegative) [69]. A new more specific serological study is anticitrullinate protein antibodies (ACPAs). This test is only positive in 67% of patients with rheumatoid arthritis, but it is rarely positive in patients that do not have the disease. The specificity of ACPA is 95% [58].
The clinical diagnosis is confirmed based on criteria of the American Rheumatism Association [5]. There are seven criteria and at least four have to be present to make the diagnosis of rheumatoid arthritis.
- Morning stiffness greater than 1 hour most mornings for 6 weeks
- Arthritis and soft tissue swelling of greater than 3 of 14 joint groups, present for at least 6 weeks
- Arthritis in the hand joints present for at least 6 weeks
- Symmetric arthritis present for at least 6 weeks
- Subcutaneous nodules in specific places
- Rheumatoid factor at a level above the 95 percentile
- Radiologic changes suggestive of joint erosion
Imaging of rheumatoid arthritis begins with screening radiographs. Standing views of the foot and ankle in the AP and lateral planes and nonstanding oblique images are obtained. Other imaging techniques, specifically MR imaging and ultrasound are also used for diagnosis and evaluation of progression or remission during the follow-up of patients with rheumatoid arthritis [6,12,39,73,79,94,96].
The radiographic changes in the soft tissues, cartilage, and bone are a result of inflammation of the synovia, bursae, and tendon sheaths. Perivascular synovitis leads to synovial hypertrophy, joint effusion, and edema of adjacent soft tissues. These changes combine to result in periarticular swelling and increased soft tissue density, which are early and important radiographic findings in rheumatoid arthritis [14,69].
The radiologic hallmarks of rheumatoid arthritis are joint effusions, periarticular soft tissue swelling, juxta-articular osteopenia, lack of new bone formation, symmetric joint space narrowing, marginal osseous erosions, synovial cysts, and subluxations. Changes are classically symmetrical with a similar distribution in both feet and ankles (Fig. 5-11) [26,69].
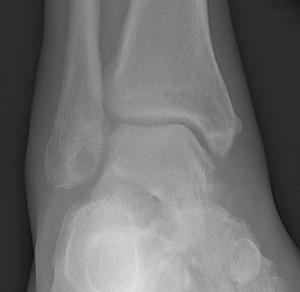
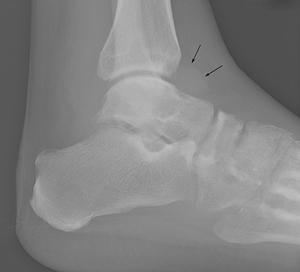
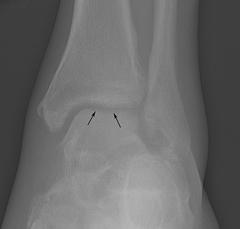
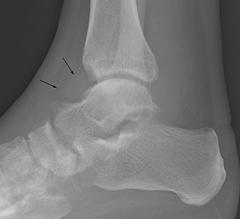
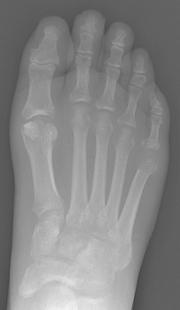
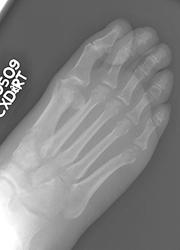
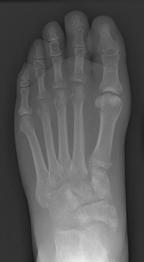
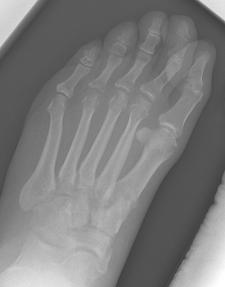
FIGURE 5-11 Early rheumatoid arthritis in the feet and ankles. AP (A) and lateral (B) radiographs of the right and left (C,D) ankles demonstrate soft tissue swelling in both ankles with joint effusions on the lateral images (arrows). There is subchondral osteopenia on the AP radiographs due to hyperemia (arrows in C). There is also osteopenia in the midfoot tarsal bones. AP (E) and oblique (F) radiographs of the right foot and left foot (G,H) demonstrate juxta-articular osteopenia in the mid- and forefoot articulations. There are no erosions, specifically in the fifth metatarsal heads.
The earliest changes are joint effusion and juxta-articular osteopenia (Fig. 5-11) [14.69].
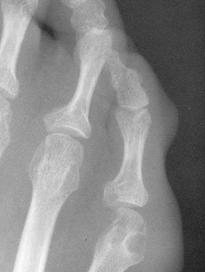
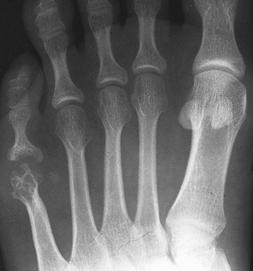
FIGURE 5-12 Isolated rheumatoid involvement of fifth MTP joint. A) Cortical erosions of the fifth MTP joint, with soft tissue swelling lateral to the MTP and PIP joints.B) Advanced destruction of the fifth MTP joint, associated with lateral soft tissue swelling.
The fifth MTP joint is often the earliest joint affected (Fig. 5-12), more so than the other MTP joints. The IP joint of the great toe is also a commonly affected joint (Fig. 5-13C), whereas the IP joints of the remaining toes are frequently spared. The midfoot is often involved in rheumatoid arthritis, but soft tissue changes are difficult to appreciate. Swelling, increased density of the soft tissues, and bursitis also may be seen at the insertion of the Achilles tendon and near the insertion of the plantar aponeurosis onto the calcaneus.
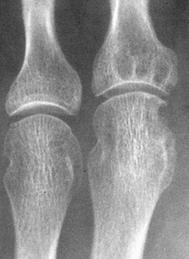
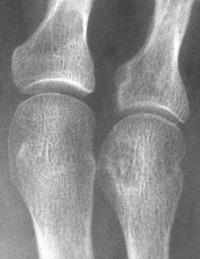
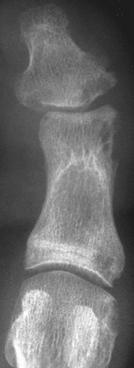
FIGURE 5-13 Rheumatoid arthritis of the forefoot. A) Mild symmetric joint space loss, marginal erosions and multiple subchondral cysts involving the second MTP joint.B) Subtle periarticular osteopenia and erosive changes of the metatarsal head and base of the third proximal phalanx.C) Minimal joint space narrowing and marginal erosions of the first MTP and IP joints.
Osteopenia occurs early and is nearly always present in rheumatoid arthritis, although the exact cause is not well understood (see Fig. 5-11). The radiographic detection of osteoporosis is difficult and possible only when the demineralization is advanced (see Fig. 5-11). The radiodensity of bone is so variable that it alone is of little diagnostic value. Cortical thinning, however, is a reliable indicator of bone loss, as is the accentuation of the cortical bone and remaining trabecular, which results from the preferential resorption of transverse trabecular.
Articular cartilage is destroyed in a uniform manner in rheumatoid arthritis, resulting in uniform symmetric joint space narrowing [14,69]. Symmetric joint space loss occurs earliest and most frequently at the MTP joints (Fig. 5-13), although the IP joint of the great toe is also frequently affected. The other IP joints sometimes may be affected, with the proximal joints being more commonly involved. Rheumatoid arthritis frequently involves the midfoot (Fig. 5-14), and uniform joint space narrowing is characteristic. The entire midfoot is diffusely affected. When involvement is more localized, the most frequently affected articulations are the talonavicular (see Fig. 5-14), TMT, subtalar, and cuneonavicular joints. Ankle involvement usually results in symmetric narrowing of the tibiotalar joint (Fig. 5-15).
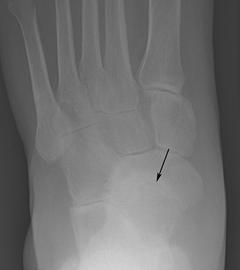
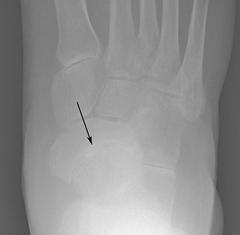
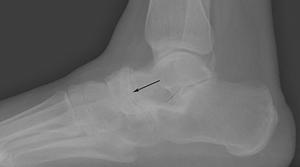
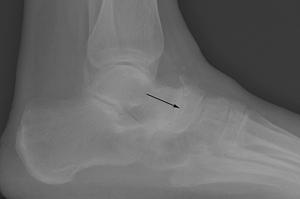
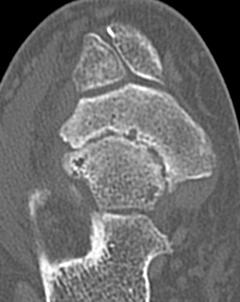
FIGURE 5-14 Midfoot rheumatoid arthritis. AP radiographs of the left (A) and right (B) foot and lateral images of the left (C) and right foot (D) demonstrate joint space narrowing in the midfoot most evident in the talonavicular joints (arrow). CT image (E) demonstrates cartilage loss and erosions without increased bone density.
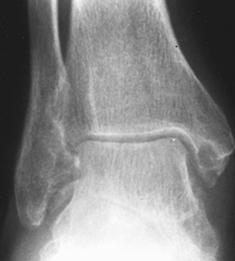
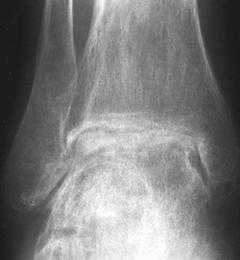
FIGURE 5-15Rheumatoid arthritis of the ankle. A) Uniform loss of articular cartilage resulting in symmetric joint space narrowing and subchondral cyst in the medial malleolus.B) Advanced rheumatoid changes of severe joint space loss, irregularity, and sclerosis of the articular bone.
Hypertrophied synovium or pannus can result in cortical erosions, typically located at the joint margin between the articular cartilage and the synovium. Pannus formation occurs early and is difficult to detect using radiographs [12]. When evident radiographically, the erosions have poorly defined margins, and although varied in size, they are usually small. Like the other manifestations, rheumatoid erosions arise most frequently at the MTP joints (Fig. 5-16A) and the IP joint of the great toe (see Fig. 5-16B). They predominate along the medial aspect of the metatarsal heads and the head of the proximal phalanx of the great toe. The lateral aspect of the fifth metatarsal head is frequently affected in rheumatoid arthritis before other sites (see Fig. 5-16C), and involvement may occur early when findings elsewhere may be lacking and the diagnosis is in question. Synovial inflammation at the junction of the first metatarsal and its sesamoid can result in sesamoid erosion. Erosions are less common in the second through fifth PIP and are unusual in the second through fifth DIP joints. Cortical erosions in the midfoot are either lacking or are small, despite an advanced loss of cartilage (see Fig. 5-14E). Calcaneal erosions adjacent to the Achilles tendon (Fig. 5-17) can be associated with retrocalcaneal bursitis and inflammatory changes of the Achilles tendon. Erosions and enthesophytes at the plantar surface of the calcaneus can be associated with plantar fasciitis. After uniform cartilage loss occurs in the ankle, small erosions may be present, but they are usually not a prominent finding in this joint (see Fig. 5-15) [14,69].
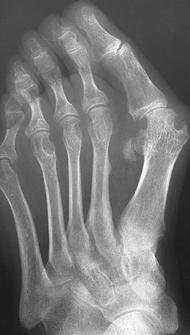
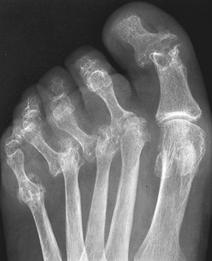
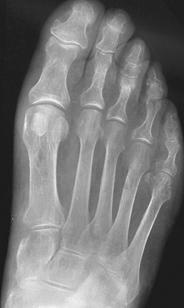
FIGURE 5-16 Common locations of rheumatoid erosions. A) Erosive changes of multiple MTP joints, most pronounced at the first MTP joint. Also note the hallux valgus deformity and probable old fracture deformity of the second metatarsal shaft. B) Marked destructive changes of the first IP joint and the second through fifth MTP joints, with dislocation and fibular deviation of multiple MTP joints. C) Isolated erosive changes of the lateral head of the fifth metatarsal.
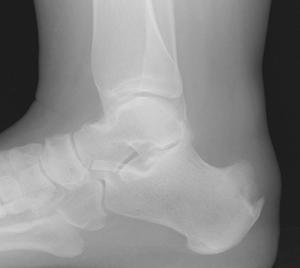
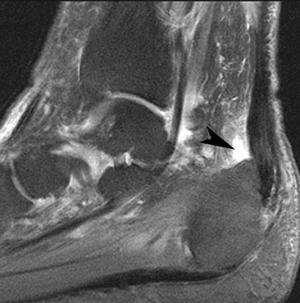
FIGURE 5-17 Achilles tendon and bursal involvement with rheumatoid arthritis. A) Lateral radiograph demonstrating erosion of the posterior calcaneus and thickening at the Achilles tendon attachment. Sagittal fat-suppressed fast spin-echo T2-weighted image (B) of the hindfoot demonstrate pre-Achilles bursitis (arrowhead in B) with thickening and increased signal intensity in the Achilles tendon.


Stay updated, free articles. Join our Telegram channel

Full access? Get Clinical Tree


