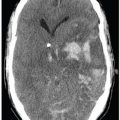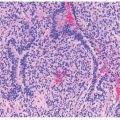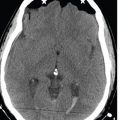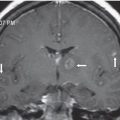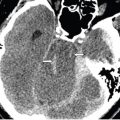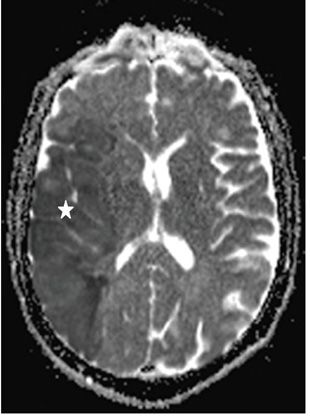
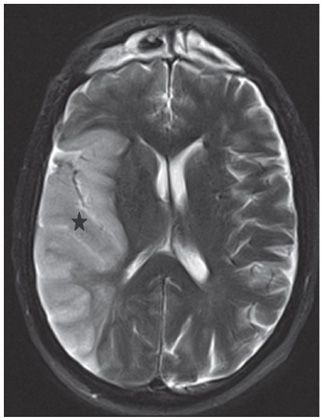
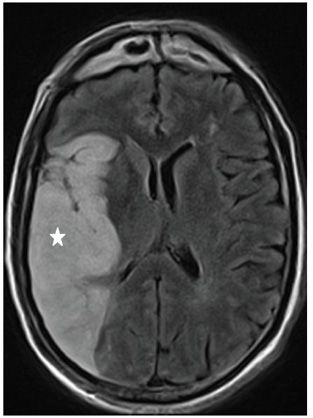
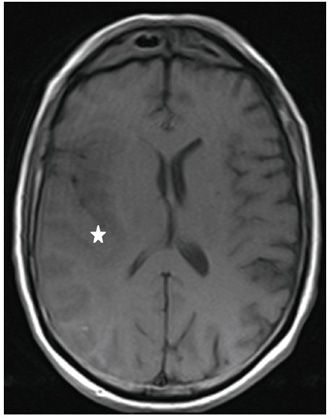
FINDINGS Figures 53-1 and 53-2. Axial DWI with corresponding ADC map through the level of the basal ganglia. There is diffuse cortical and subcortical hyperintensity on the DWI with matching hypointensity on the ADC map (stars) in the right temporoparietal lobes with involvement of the right operculum and subinsula region. There is effacement of the sulci in the region involved consistent with mass effect. Figures 53-3 to 53-5. Axial T2WI, FLAIR, and T1WI, respectively, through the area. There is confluent hyperintensity involving the gray matter (GM) and white matter (WM) of the region on the FLAIR and T2WI with corresponding hypointensity on T1WI (stars). Mass effect is manifested by effacement of the sulci and mild compression of the right lateral ventricle with subtle midline shift.
DIFFERENTIAL DIAGNOSIS Vasogenic edema, cytotoxic edema.
DIAGNOSIS Cytotoxic edema secondary to right middle cerebral artery territory acute infarction.
DISCUSSION
Stay updated, free articles. Join our Telegram channel

Full access? Get Clinical Tree


