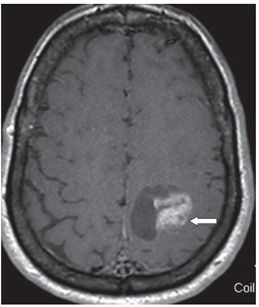
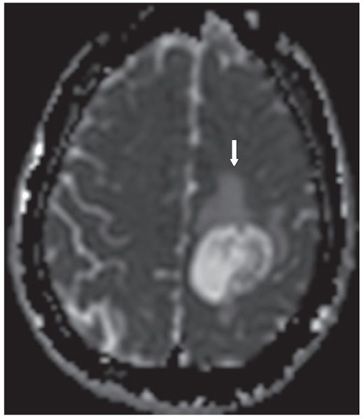
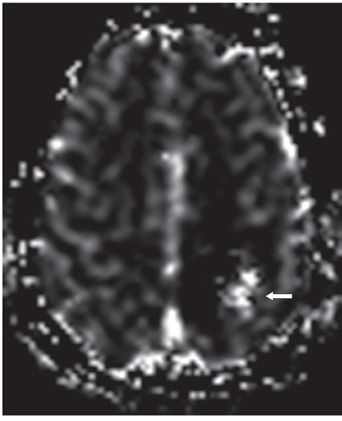
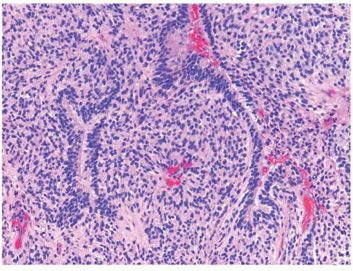
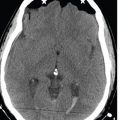
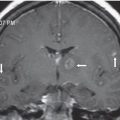
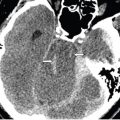
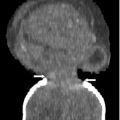
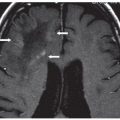
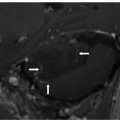
FINDINGS Figure 69-1. Left parasagittal non-contrast 3D T1WI. There is a well-defined posterior left frontal hypointense mass with mild vasogenic edema anteriorly (arrow). There is area of irregular isointensity within the lesion. Figure 69-2. Axial post-contrast T1WI through the mass. There is an avid contrast-enhancing portion laterally (arrow) with the rest showing a cystic appearance. Figure 69-3. Axial ADC map through lesion. There is an irregular, mild, low ADC within the solid component with the rest showing high ADC values. There is edema anteriorly to the mass (arrow). Figure 69-4. Axial relative Cerebral Blood Volume (rCBV) map through the mass. There is elevated rCBV in the lateral component of the mass (arrow). Figure 69-5. Photomicrograph shows tumor composed of monomorphic cells with mildly hyperchromatic nuclei. Central canal-like structures are present (H&E stain).
DIFFERENTIAL DIAGNOSIS
Stay updated, free articles. Join our Telegram channel

Full access? Get Clinical Tree


