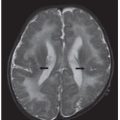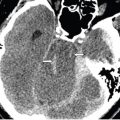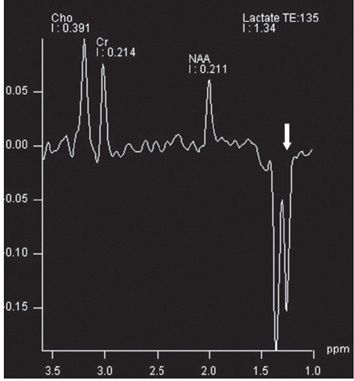
FINDINGS Figure 75-1. Axial T2WI. There are bilateral symmetrical hyperintense lentiform nuclei which appear swollen. There is high signal and atrophy of the occipital white matter (WM) and cortical sulci prominence. Figure 75-2. MRS at TE = 135 ms obtained at the level of the left basal ganglia. There are reduced overall concentrations of choline (Cho), creatine (Cr), and N-acetyl aspartate (NAA). The inverted peak of lactate is clearly seen (arrow).
DIFFERENTIAL DIAGNOSIS Diffuse anoxia (including inhalation of toxic gases), hypoglycemia, organic acidurias, acute necrotizing encephalitis (predominantly thalamic involvement), hemolytic uremic syndrome, and thrombotic thrombocytopenic purpura mitochondrial encephalopathy with lactic acidosis and strokes (MELAS).
DIAGNOSIS Mitochondrial encephalopathy with lactic acidosis and strokes (MELAS).
DISCUSSION
Stay updated, free articles. Join our Telegram channel

Full access? Get Clinical Tree


