8 Angiographically Occult Vascular Lesions
8.1 Cavernous Malformations
8.1.1 Clinical Case
A 55-year-old female with seizure.
8.1.2 Description of Imaging Findings and Diagnosis
Diagnosis
Cavernous malformation of the mesial left temporal lobe.
8.1.3 Background
Cavernous malformations are relatively common lesions seen in up to 1% of MRI scans. On histology, these lesions are characterized as a mulberry-like mass of dilated and thin-walled capillaries surrounded by hemosiderin. There is no normal brain within a cavernous malformation. Common presenting symptoms include headache, seizures, and focal neurological deficits. Symptoms usually present when these lesions bleed or present with intracavernomatous thrombosis. Natural history studies of cavernous malformations have found that risk factors for hemorrhage include brainstem location, prior hemorrhage, and focal neurological deficit. Age, gender, and number of lesions are not risk factors.
In most cases, cavernous malformations are single and sporadic. However, there is a subset of patients with autosomal dominant familial cavernomatosis who present with multiple lesions. Cavernomas can be associated with developmental venous anomalies in 10–30% of cases depending on the series and have been reported to occur following radiation therapy. The fairly heterogeneous predisposing factors of cavernoma formation point to cavernomas being a veno-occlusive disease with repeated episodes of venular thrombosis causing growth and/or rupture of the cavernoma.
8.1.4 Imaging Findings
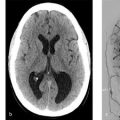
Because symptomatic cavernoma patients often present with acute presentations, CT is sometimes the first imaging modality to pick up on these lesions. On non-contrast CT, cavernous malformations are usually characterized by a well-defined region of hyperdensity/hemorrhage with or without calcification. MRI is the imaging test of choice for detection and characterization of CCM.
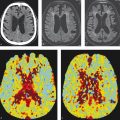
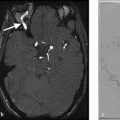
All imaging protocols for the evaluation or detection of CCMs should use T2* imaging with susceptibility weighted imaging. While gradient echo T2* imaging (GRE) is more sensitive than conventional T2- and T1-weighted sequences, SWI is three times more sensitive than GRE. Higher field strength increases the diagnostic yield of SWI in detecting CCMs, but can be prone to more artifacts. On T1- and T2-weighted images, CCMs often have a heterogeneous signal intensity (mixed hyper and hypointensity) depending on the age of the hemorrhagic products (Fig. 8.1 , Fig. 8.2). This bubbly heterogeneous signal creates a mulberry like appearance on MRI. T1 contrast enhanced MRI is helpful as well, especially in evaluating for the presence or absence of an adjacent developmental venous anomaly. When reporting an MRI in a CCM patient, the radiologist should report on the signal characteristics, size, and location of the lesion, number of lesions, and the presence or absence of a DVA (Fig. 8.2 , Fig. 8.3). Signal characteristics can be characterized using the Zambramski classification (Table 8.1), which helps in aging the hemorrhages within the lesions. One important finding that should be commented on is whether or not the cavernoma reaches the surface of the brain or brainstem or whether there is brain tissue between the cavernoma and the subarachnoid space. This is important for operative planning purposes as lesions which reach the surface of the brain are slightly safer to resect due to the lack of any need to dissect through normal neural tissues to reach the lesion.


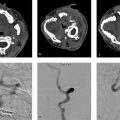
There is growing interest in using advanced imaging techniques to study the venous angioarchitecture surrounding CCMs. Studies using SWI at 7T have found abnormal venous structures typical of developmental venous anomalies in over 90% of sporadic CCMs suggesting that most of these lesions are related to local perturbations in venular drainage. Other studies using high-resolution CTA/CTV have found that DVAs with stenoses or kinks are more likely to harbor CCMs than those without such narrowings (Fig. 8.2). Interestingly, the association between DVAs and CCMs is not present in the familial version of these lesions where a mutation in the KRIT gene points towards a venous endothelial defect as the root cause for cavernoma formation.
There has also been emerging interest in the use of tractography and quantitative susceptibility mapping in evaluating these lesions. Because many of the most worrisome CCMs are located in the brainstem, DTI can help in operative planning and determining optimal surgical approach for brainstem entry zones. The relationship between the CCM and major fiber tracts such as the corticospinal tract and medial lemniscus/medial longitudinal fasciculus is particularly important to comment on for operative planning. For supratentorial lesions, the relationship between the CCM and corticospinal tracts is important to comment on. An important caveat is that susceptibility effects with signal loss surrounding the cavernoma may underestimate the spatial proximity between the lesion and the studied fiber tracts.
There are some new quantitative imaging techniques on the horizon, which may prove useful in the evaluation of CCMs. Quantitative susceptibility mapping is a SWI-based technique which allows for the quantification of iron concentration. CCMs which have bled are associated with higher iron concentration than stable lesions. This is useful in determining, which lesions have bled in the past. Quantitative perfusion techniques such as dynamic contrast-enhanced quantitative perfusion has been shown to be an effective tool in studying brain vascular permeability. Studies have shown that CCMs with higher permeability indices may have a more aggressive clinical course.
Related posts:


Stay updated, free articles. Join our Telegram channel

Full access? Get Clinical Tree


