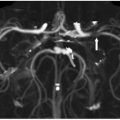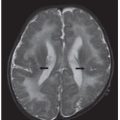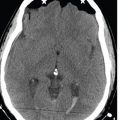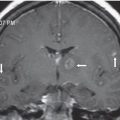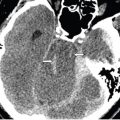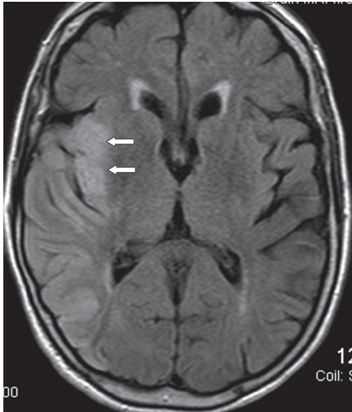
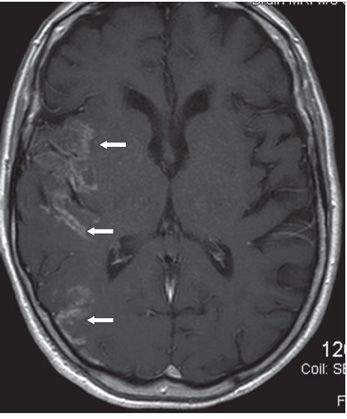
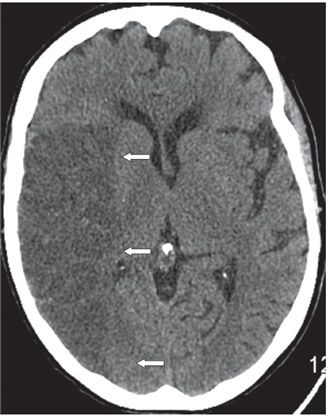
FINDINGS Figure 9-1. Axial ADC map through the level of the thalami. There is a right temporoparietal cortical low ADC within the territory of the inferior division of the right MCA (arrows) consistent with the history of acute infarct. There is very minimal subcortical change. Figure 9-2. Axial FLAIR through same region. There is right insula ribbon effacement (arrows) along with mainly cortical hyperintensity within the right MCA inferior division territory. There is minimal subcortical hyperintensity. Figure 9-3. Axial post-contrast T1WI. There is patchy gyriform contrast enhancement (arrows) through the lesion. Non-contrast T1WI at the same time (not shown) revealed hypointensity within the infarct. Figure 9-4. Axial NCCT 24 hours later. There is a diffuse hypodensity (arrows) through the lesion with local mass effect and subtle midline shift to the left. There is no significant hemorrhage.
DIFFERENTIAL DIAGNOSIS Acute infarct, subacute infarct, encephalitis, arteriovenous malformation (AVM).
DIAGNOSIS Acute right MCA territory infarct.
DISCUSSION
Stay updated, free articles. Join our Telegram channel

Full access? Get Clinical Tree


