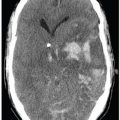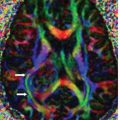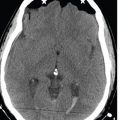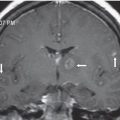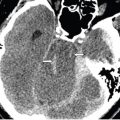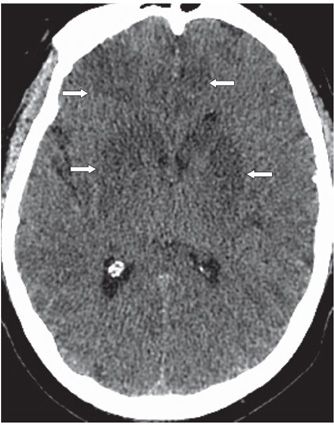
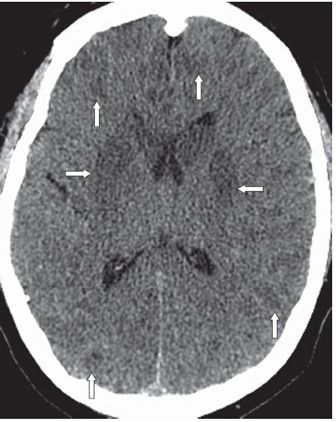
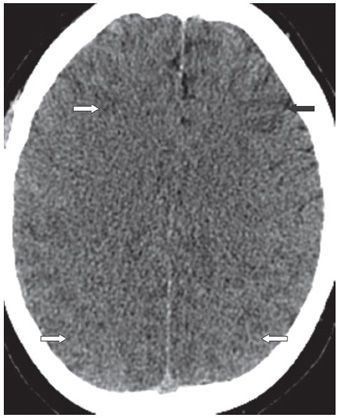
FINDINGS Figure 90-1. Axial NCCT through the tentorial incisura. There is bilateral cerebral hemispheric patchy hypodensities (arrows) with crowding of the tentorial incisura and effacement of the suprasellar cistern and posterior compression of the upper pons by the superior vermis. Figure 90-2. Axial NCCT through the inferior basal ganglia. There are patchy bilateral basal ganglia cortical/subcortical frontal lobes hypodensities (arrows) Figure 90-3. Axial NCCT through the superior basal ganglia. There are bilateral symmetrical caudate nuclei and lentiform nuclei hypodensities (arrows). Multifocal patchy bilateral subcortical hypodensities are also present (vertical arrows). Figure 90-4
Stay updated, free articles. Join our Telegram channel

Full access? Get Clinical Tree


