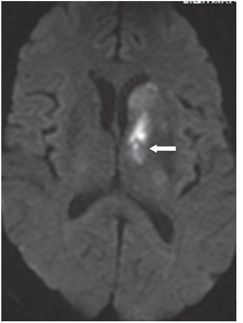
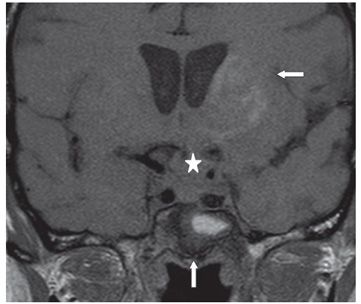
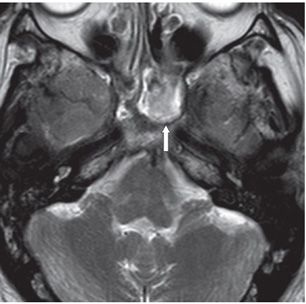
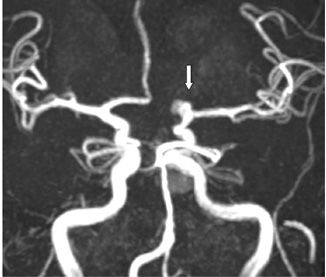
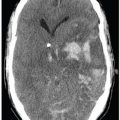
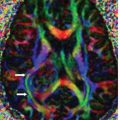
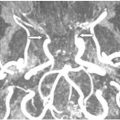
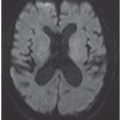
FINDINGS Figure 99-1. Axial NCCT of the head. There is a small focus of hyperdensity (blood) in the anterior left suprasellar cistern in the vicinity of the left internal carotid artery (ICA) (arrow), and the rest of the suprasellar cistern is isodense to brain presumably due to inflammatory tissue. Figure 99-2. DWI through the level of the basal ganglia. There is restricted diffusion in the left basal ganglia and thalamus (arrow) and elsewhere in the left cerebral hemisphere (not shown). Figure 99-3. Coronal non-contrast T1WI through the level of the sphenoid sinus. There is hyperintense sphenoid sinus opacification with surrounding hypointense material (vertical arrow). The sella turcica and suprasellar cerebrospinal fluid (CSF) are isointense with the brain (star) consistent with “granulation/inflammatory tissue” replacing the suprasellar CSF. There is patchy left basal ganglia hyperintensity consistent with hemorrhagic infarcts (transverse arrow). Figure 99-4. Axial T2WI through the sphenoid sinus. There is mixed signal intensity within the sphenoid sinus (vertical arrow), either blood or fungus infection. Figure 99-5

Stay updated, free articles. Join our Telegram channel

Full access? Get Clinical Tree


