Abdomen Ultrasound
William E. Brant
US is firmly established as a primary imaging modality for comprehensive evaluation of the abdomen including the abdominal organs, the peritoneal cavity, and the retroperitoneum (1). Its role includes screening for disease; evaluation and follow-up of known abnormalities; and guidance of biopsy, aspiration, and catheter drainage procedures. Comprehensive examination includes the use of Doppler and color flow imaging, as well as specialized techniques of transvaginal or transrectal US to demonstrate pelvic extension of disease. This chapter provides the basics for understanding the effective use of US in examining the abdomen (2).
Peritoneal Cavity
Normal US Anatomy. The normal peritoneal cavity is a potential space best appreciated when fluid is present. The peritoneal membrane lines the abdominal cavity and covers, in whole or in part, the intraabdominal organs (3). Numerous peritoneal ligaments, folds, and recesses are visualized when outlined by fluid within the peritoneal cavity. US examination for the presence of fluid includes the inspection of the subdiaphragmatic and subhepatic regions, the pericolic gutters, and the pelvic cul-de-sac. Tiny volumes of intraperitoneal fluid are best detected by transvaginal US examination of the cul-de-sac. The focused assessment with sonography for trauma (FAST) scan has been defined to evaluate the peritoneal spaces for bleeding after trauma (4). This examination has been expanded to include the pleural and pericardial space to detect the presence of effusions. Firm transducer pressure and changes in patient position are needed to inspect between bowel loops for fluid collections. Solid organs and fluid serve as sonographic windows to the abdomen and gas in bowel, the ribs, spine, and bony pelvis serve as obstacles.
Intraperitoneal Fluid. Fluid within the peritoneal cavity flows, under the effect of gravity, along peritoneal reflections to peritoneal recesses (Fig. 35.1) (3). The hepatorenal recess (Morison pouch) and the pelvic cul-de-sac are the two most dependent recesses in the supine patient. They connect via the paracolic gutters. Fluid outlining the intraperitoneal organs provides an opportunity to evaluate organ surface abnormalities, such as the fine nodularity of cirrhosis. Transudative ascites, urine, and bile are anechoic. Fluid with echogenic particles, layering debris, or septations may be exudative ascites, hemorrhage, pus, malignant ascites, or spilled GI contents.
Free intraperitoneal fluid outlines recesses and compartments which retain their normal shape. Loops of bowel float and sway freely within free fluid. Loculated fluid collections, abscesses, and cystic masses create their own space, displace bowel and adjacent organs, and are usually more round and tense.
Intraperitoneal Abscess. Although CT is commonly preferred for the detection of small intraperitoneal abscesses, US readily demonstrates most abscesses and is effectively used to guide aspiration and catheter drainage (Fig. 35.2). Because abscesses most commonly form in the dependent recesses, the pelvis must be included in every examination. Abscesses appear as loculated collections of fluid that may be anechoic to densely echogenic. As loculated collections, they displace bowel and abdominal organs. Fluid levels, internal debris, septations, thick walls, and gas within the abscess are common. Gas is brightly echogenic and associated with reverberation artifact and acoustic shadowing. An abscess containing extensive gas may be mistaken for gas-filled bowel and overlooked. Some abscesses appear solid. Changes in patient position show shifting of the particle pattern when liquid. Doppler and color flow US show the absence of internal blood vessels within echogenic fluid collections or the presence of blood flow within solid tissue.
Intraperitoneal Tumor. Metastases are the most common tumor of the peritoneal surface. Fluid and gravity distribute malignant cells throughout the peritoneal cavity where they implant upon visceral or parietal peritoneal surfaces. The greater omentum is fertile ground and thickens with tumor implantation to form “omental cake,” a layer of solid tissue separating bowel from contact with the anterior abdominal wall (Fig. 35.3). Metastatic implants appear as hypoechoic solid masses of varying size on peritoneal surfaces. Ascites is usually present, with echogenic debris and septations common. The most common tumors of origin are ovarian, colon, pancreas, and gastric carcinoma.
Primary peritoneal tumors include mesothelioma, desmoids, carcinoids, primary peritoneal serous papillary carcinoma, and lymphoma. These appear as predominantly hypoechoic solid masses. Acoustic shadows may arise from dense fibrous tissue or calcifications.
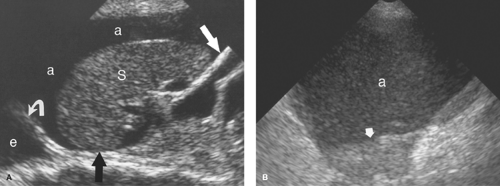 Figure 35.1. Ascites. A. Longitudinal US image shows anechoic ascites (a) surrounding the spleen (S). Fluid outlines the gastrosplenic ligament (white arrow). Note the small bare area of the spleen (black arrow) where reflections of the peritoneum from the spleen to the diaphragm prevent access of intraperitoneal fluid. A left pleural effusion (e) is seen above the diaphragm (curved arrow). B. US image of the right lower quadrant of the abdomen reveals ascites (a) containing echogenic particulate matter. A fluid–fluid layer (arrow) is present. This exudative ascites resulted from a bowel perforation. |
Retroperitoneum
Normal US Anatomy. The retroperitoneum is that portion of the abdomen behind the posterior parietal peritoneum (5). The anatomy of its three compartments is described in Chapter 25. US of the abdominal aorta and inferior vena cava is discussed in Chapter 39. The crura of the diaphragm must not be mistaken for retroperitoneal adenopathy. Both are hypoechoic linear bands of muscle. The right crus is larger, more lobular, and inserts lower, extending to L3 vertebral body. The left crus is more uniform in thickness inserting on L1 and L2 vertebral bodies. The crura serve as landmarks for the identification of the adrenal gland. The psoas and quadratus lumborum muscles show the typical hypoechoic pattern of muscle with longitudinally oriented echogenic fibrous strands dividing muscle bundles. Echogenic retroperitoneal fat surrounds and defines organs, vessels, and other structures.
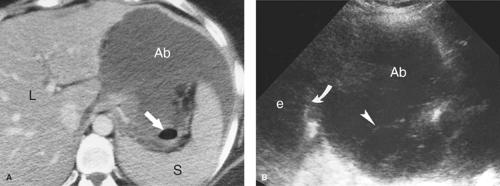 Figure 35.2. Left Subphrenic Abscess. A. A CT scan demonstrates a loculated fluid collection (Ab) in the left subphrenic space following gastric bypass surgery. The stomach (arrow) is displaced posteriorly. L, liver; S, spleen. B. US in the same patient demonstrates internal septations (arrowhead) within the fluid collection (Ab) that are not apparent on the CT study. A pleural effusion (e) is seen above the diaphragm (curved arrow). The abscess contained gram-negative organisms. |
Retroperitoneal Adenopathy. Enlarged individual lymph nodes are homogeneous, hypoechoic, and round or oval (Fig. 35.4). Accentuated sound transmission may be present, and some enlarged solid nodes are so hypoechoic that they appear cystic. A solitary node larger than 1.5 cm in short axis diameter, or multiple nodes larger than 1.0 cm, is considered to be pathologically enlarged. Lymphoma is characterized by the confluence of enlarged nodes to form a solid mass which surrounds vessels and organs. Causes of retroperitoneal adenopathy are lymphoma (most common), tumor metastases (testicular, renal, pelvic, GI malignancies, and melanoma), and infection, especially in AIDS patients.
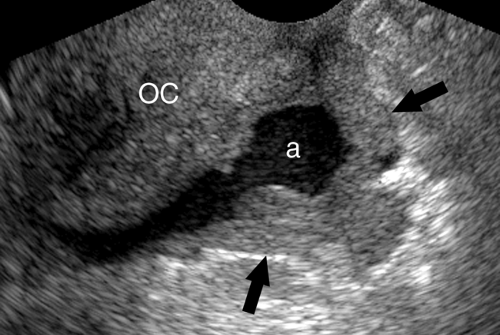 Figure 35.3. Peritoneal Metastases. US image shows solid tumor implanted on the omentum creating “omental cake” (OC). Solid tumor causes lumpy thickening of the peritoneal surfaces (arrows). Malignant ascites (a) contains floating echogenic debris. The primary tumor was ovarian carcinoma. |
Retroperitoneal tumors are most commonly of mesenchymal origin and include liposarcoma, leiomyosarcoma, and malignant fibrous histiocytoma. These are aggressive tumors that invade organs and muscles and are difficult to remove surgically. Most are large, heterogeneous, and partially cystic. Germ cell tumors in the retroperitoneum may be primary or secondary, and benign or malignant. The sonographic features of the various tumors overlap, and US examination does not yield a specific diagnosis. Benign lipoma may be suggested when the tumor is isoechoic to retroperitoneal fat.
Retroperitoneal fluid collections include hemorrhage, infection, urinoma, pancreatic fluid collections, and cystic masses (lymphoceles, lymphangiomas, renal cysts, and teratomas). Portosystemic collaterals and other enlarged blood vessels are differentiated by Doppler US. As within the peritoneal cavity, retroperitoneal fluid may be anechoic or echogenic, with particulate cellular debris and layering fluid levels. Echogenic clotted blood may appear as a solid mass. Absence of internal vascularity on Doppler examination and change in appearance with time are distinguishing features.
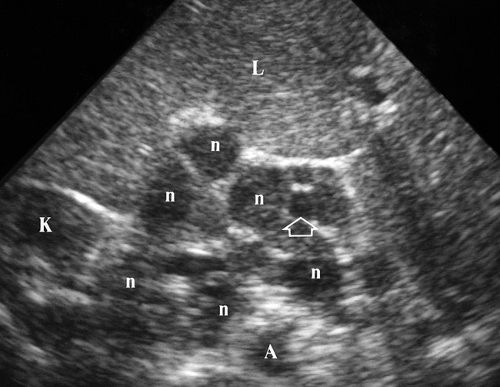 Figure 35.4. Adenopathy—Lymphoma. An axial plane US demonstrates multiple enlarged hypoechoic lymph nodes (n) surrounding and displacing the aorta (A) and celiac axis (open arrow). The adenopathy extends into the hilum of the right kidney (K). L, liver. |
Liver
US is an efficient imaging method to screen patients for diffuse and focal hepatic disease (6,7,8,9). For focal liver metastases, its sensitivity approaches that of CT and MR; however its images are more difficult to reproduce for follow-up comparisons, and benign and malignant nodules cannot usually be distinguished. Contrast-enhanced US imaging shows promise in improving the ability of US to characterize benign and malignant hepatic lesions (9,10). Color Doppler US is valuable in the assessment of liver vasculature, in the diagnosis of portal and hepatic vein thrombosis and portal hypertension, and in evaluating the vascularity of liver tumors.
Normal US Anatomy. The echogenicity of the liver parenchyma is homogeneous and equal to or slightly greater than that of the kidney (Fig. 35.5A). The surface of the normal liver is smooth and the inferior margin of the liver is sharp-edged. The lobar and segmental anatomy of the liver is described and illustrated in Chapter 26. The hepatic veins are seen as echolucent tubes with thin walls that converge into the inferior vena cava. The portal veins, hepatic arteries, and bile ducts, encompassed by fibrofatty tissue, form the portal triads which are normally visualized as echogenic foci throughout the liver. Spectral and color flow Doppler US are essential to US examination of the liver to characterize mass lesions, demonstrate collateral vessels, and detect vascular abnormalities (11).
Fatty infiltration causes an increase in echogenicity of the liver, making the affected areas distinctly more echogenic than normal renal parenchyma (8). Fatty infiltration also increases the attenuation of the US beam, diminishing the visualization of the diaphragm and commonly requiring a lower frequency transducer to examine deep portions of the liver (Fig. 35.5B). The hepatic echotexture appears coarsened and visualization of the portal triads is decreased. The various patterns of fatty infiltration are reviewed in Chapter 26. The “flip-flop” pattern of fatty infiltration as seen on US compared with CT is useful in confirming the diagnosis of focal fatty infiltration and focal fat sparing. Fat infiltrated areas are bright on US and dark on CT. Focally sparred areas within diffuse fatty infiltration are dark on US and bright on CT.
Acute hepatitis results in diffuse hepatic edema which reduces the echogenicity of the liver, resulting in a “starry sky” appearance. The portal triads appear unusually bright on the darkened background of edematous parenchyma. The starry sky appearance has also been described with diffuse leukemic or lymphomatous infiltrate, toxic shock syndrome, and diffuse decrease in glycogen stores in the liver.
Passive hepatic congestion refers to stasis of blood in the liver due to congestive heart failure. US findings include hepatomegaly, distention of the inferior vena cava and hepatic veins, and pulsatile portal vein flow seen on Doppler due to the transmission of right atrial activity through congested sinusoids. Ascites, right pleural effusion, and pericardial effusion are often present.
Cirrhosis. US reflects the morphological changes in the liver associated with cirrhosis (8). Hepatic echotexture is usually coarsened and heterogeneous with numerous vague nodules commonly evident (Fig. 35.6). The surface of the liver examined with high-frequency transducers shows abnormal fine or coarse nodularity. Echogenicity is increased in proportion to the degree of fatty infiltration. With alcoholic cirrhosis, the right lobe is shrunken and the left lobe and caudate lobe
are enlarged. Advanced cirrhosis results in a small liver with a markedly nodular contour. The normal triphasic Doppler waveform of the hepatic veins is flattened in cirrhosis with loss of the reverse flow component caused by atrial systole. US is insensitive (<45%) to the detection of malignancy in cirrhotic livers; however US demonstration of a discrete focal mass is highly predictive of malignancy.
are enlarged. Advanced cirrhosis results in a small liver with a markedly nodular contour. The normal triphasic Doppler waveform of the hepatic veins is flattened in cirrhosis with loss of the reverse flow component caused by atrial systole. US is insensitive (<45%) to the detection of malignancy in cirrhotic livers; however US demonstration of a discrete focal mass is highly predictive of malignancy.
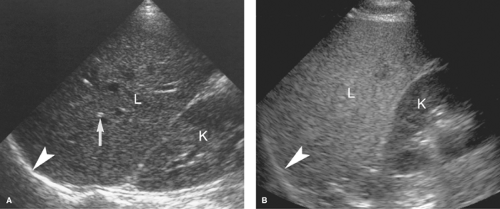 Figure 35.5. Normal and Diffuse Fatty Liver. A. Longitudinal US image demonstrates normal liver (L) and right kidney (K). The liver parenchyma is of uniform echogenicity, approximately equal to the parenchymal echogenicity of the kidney. The liver is well visualized to the level of the diaphragm (arrowhead). Small portal triad structures (arrow) are seen throughout the liver parenchyma. B. Diffuse fatty infiltration of the liver (L) markedly increases liver parenchymal echogenicity compared to that of the kidney (K). No portal triads are seen, and the diaphragm (arrowhead) is less well visualized. |
Portal Hypertension. US evidence of portal hypertension includes the demonstration of portosystemic collateral vessels, dilatation of the portal vein (>13 mm), dilatation of the splenic and superior mesenteric veins (>10 mm), splenomegaly, and ascites. The hepatic artery is often enlarged and tortuous (12). Doppler demonstration of reversed (hepatofugal) flow in the portal vein is diagnostic of portal hypertension (Fig. 35.7). Flow in a dilated paraumbilical vein traversing the falciform ligament and anterior abdominal wall is also highly specific for portal hypertension. Color Doppler is very useful in the detection of splenorenal, retroperitoneal, and coronary vein collaterals.
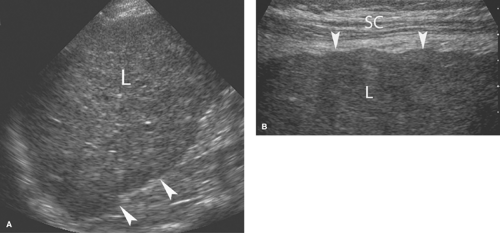 Figure 35.6. Cirrhosis. A. Longitudinal US image of the liver (L) shows coarsening of the echotexture, loss of visualization of portal triads, and nodularity characteristic of cirrhosis. The deep surface of the liver (arrowheads) shows the nodular contour typical of cirrhosis. Cirrhosis coarsens hepatic echotexture. Fatty infiltration increases hepatic echogenicity. B. A linear array transducer produces a detailed image of the liver (L) surface showing the nodular contour (arrowheads) of cirrhosis. SC, subcutaneous tissues. This technique is helpful in revealing the morphologic changes of cirrhosis. |
Portal vein thrombosis is evidenced by the presence of echogenic clot within an enlarged portal vein (Fig. 35.8). Color Doppler confirms complete occlusion or demonstrates residual flow around the thrombus. The thrombus itself varies in appearance from anechoic to hyperechoic, depending upon the age of the thrombus. Tumor thrombus from invasion of the portal vein by hepatoma is confirmed by spectral Doppler demonstration of arterial waveforms in the thrombus within
the portal vein. Cavernous transformation of the portal vein refers to the formation of multiple tortuous collateral vessels that develop in the porta hepatis in response to chronic portal vein thrombosis.
the portal vein. Cavernous transformation of the portal vein refers to the formation of multiple tortuous collateral vessels that develop in the porta hepatis in response to chronic portal vein thrombosis.
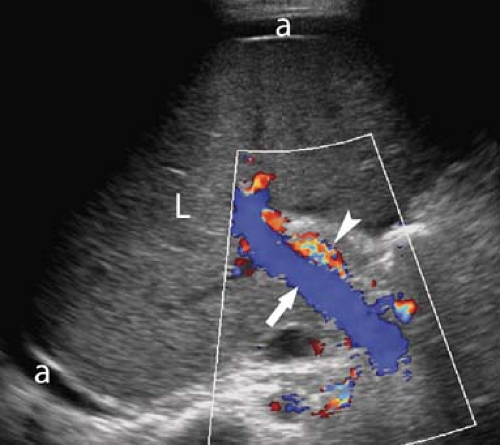 Figure 35.7. Reversed Flow in the Portal Vein. Color Doppler image through the porta hepatis shows reversed flow (out of the liver, L) in the portal vein (arrow, blue). The hepatic artery (arrowhead) is dilated and tortuous. Flow within the hepatic artery (arrowhead) is mixed in color due to aliasing. The predominant color is red, indicating normal flow direction into the liver. Reversed flow in the portal vein is indicative of advanced portal hypertension. A small volume of ascites (a) surrounds the liver. |
Cysts are common and easily identified and characterized by US (Fig. 35.9). Benign hepatic cysts have US characteristics of simple cysts: anechoic fluid, thin walls, and posterior acoustic enhancement. Thin septations are common (7). The size ranges from millimeters to 20 cm. Small cysts may mimic vessels on quick inspection. Doppler is useful to improve detection and confirm their avascular nature. Biliary cystadenomas are rare multilocular cystic lesions with malignant potential. US reveals a solitary cystic mass with thick walls, mural nodules, and multiple internal septations. Biliary cystadenocarcinomas have a similar appearance that cannot be differentiated from benign lesions by imaging alone. Both benign and malignant forms show slow growth.
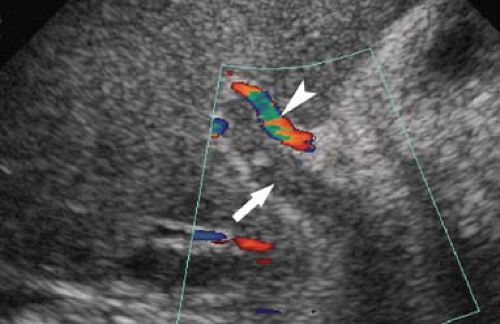 Figure 35.8. Portal Vein Thrombosis. Color Doppler US image through the porta hepatis shows echogenic thrombus (arrow) completely filling the portal vein. The hepatic artery (arrowhead) is mildly dilated and show blood flow into the liver (red) and aliasing (green). |
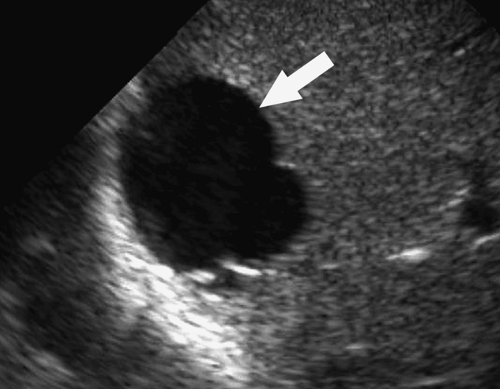 Figure 35.9. Benign Hepatic Cyst. A hepatic cyst (arrow) has sharply defined wall and anechoic contents. Benign hepatic cysts tend to occur in clusters, have thin septations, and lobulated contours. No solid nodular component is evident. |
Cavernous hemangiomas are commonly identified on hepatic sonograms. The classic US appearance is a sharply marginated homogeneous hyperechoic mass (Fig. 35.10) (13). Doppler usually shows no internal blood flow, although, on occasion, with high sensitivity settings very low-velocity flow is detected. Large lesions may contain hypoechoic thrombosis, fibrosis, and calcification. Most lesions remain stable in size over time, but about 2% show enlargement. Classic appearing lesions in patients with normal liver function tests usually require no follow-up. Atypical lesions should have a 6-month follow-up US or be confirmed with other imaging modalities as discussed in Chapter 26.
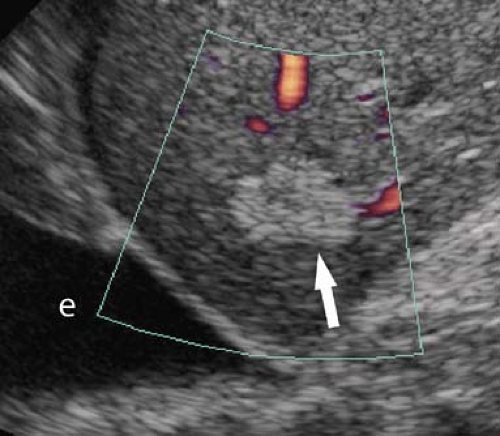 Figure 35.10. Cavernous Hemangioma. Power Doppler image shows the characteristic US appearance of a cavernous hemangioma (arrow). The mass is highly echogenic compared to surrounding liver, has sharply defined but lobulated borders, and shows no internal blood flow. Power Doppler is particularly sensitive to the detection of slow flow. This patient also has a pleural effusion (e). |
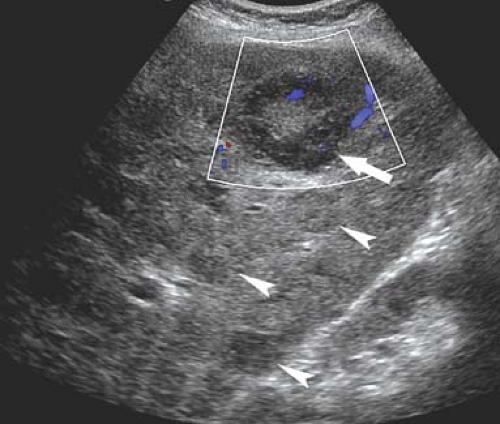 Figure 35.11. Metastases. Color Doppler shows limited vascularity to a liver mass lesion (arrow) with a target appearance commonly seen with metastatic disease. Numerous smaller nodules (arrowheads) seen throughout the liver show poor margination and variable echogenicity. Biopsy confirmed squamous cell carcinoma metastatic to the liver. |
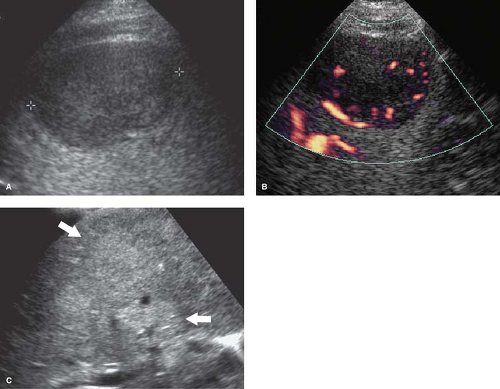 Figure 35.12. Hepatocellular Carcinoma. A. A well-differentiated hepatocellular carcinoma appears as a well-defined mass (between cursors, +) within an echogenic cirrhotic liver. B. Power Doppler interrogation of the same lesions as in panel (A) shows prominent internal blood flow commonly found with hepatocellular carcinoma. C. A poorly differentiated hepatocellular carcinoma appears as multiple poorly defined echogenic masses (arrows) within a cirrhotic liver. |
Metastases vary greatly in appearance ranging from hypoechoic to hyperechoic and from homogeneous to heterogeneous to calcified (Fig. 35.11). Metastatic disease must be considered in the differential diagnosis of all solid and atypical cystic lesions in the liver. In 90% of cases, metastatic disease is multifocal in the liver.
Lymphoma in the liver is suggested by the presence of multiple hypoechoic liver nodules in the presence of lymphadenopathy and splenomegaly (14).
Hepatocellular carcinoma (HCC) may be solitary, multifocal, or diffuse (Fig. 35.12). Detection in the diseased liver is commonly difficult with US. Most are hypervascular with prominent vascularity shown by color Doppler. Contrast-enhanced US show arterial phase enhancement with washout during portal venous phase (10). Tumor invasion of the portal and hepatic veins is common. HCC may be hyperechoic with internal fat to hypoechoic and heterogeneous due to nonliquefactive necrosis. Any solid mass detected by US in a diseased liver, including echogenic lesions resembling hemangioma, is suspicious for HCC.
Abscesses usually appear as complex fluid collections containing echogenic fluid, fluid-fluid layers, or gas (Fig. 35.13) (15). Healed abscesses commonly calcify.
Microabscesses occur most commonly in immunocompromised patients with fungal or parasitic septicemia. Target lesions with central echogenic spot and peripheral hypoechoic halo are common. The differential diagnosis of multiple small (<10 mm) lesions in the liver is given in Table 26.6.
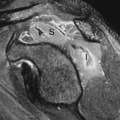
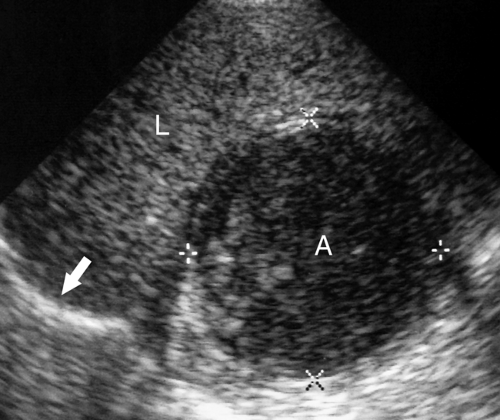 Figure 35.13. Amebic Abscess. A well-defined hypodense mass (A, between calipers) is seen in the right lobe of the liver (L). Note the proximity to the right hemidiaphragm (arrow). Amebic abscesses in the liver may rupture through the diaphragm into the right pleural space. |
Other masses, including hepatic adenoma, focal nodular hyperplasia, sarcoma, and peripheral cholangiocarcinoma, have a varied and nonspecific sonographic appearance. They range from hypoechoic to hyperechoic and may contain areas of internal hemorrhage, necrosis, fibrosis, or calcification. Characterization of these nonspecific masses is often best performed with three-phase contrast-enhanced MDCT. The final diagnosis often depends on percutaneous biopsy.
Transjugular intrahepatic portosystemic shunt (TIPS) has become a commonly performed procedure for the treatment of the complications of portal hypertension. However, shunt dysfunction is common (up to 80% in the first year) and US is the method of choice to evaluate for shunt patency and malfunction (Fig. 35.14) (16,17). Both bare and covered expansile wire stents are used to create a shunt between the portal and hepatic venous systems. Bare stents have a high incidence of failure and are routinely evaluated with Doppler 24 hours after shunt placement. Covered stents have a lower TIPS malfunction rate. Covered stents transiently block sound transmission because of air bubbles in the graft for up to a week following placement. Routine US surveillance of covered TIPS is usually performed 7 to 14 days following placement. Doppler US is used to confirm patency and flow direction in the main portal vein and right and left portal branches, and to measure flow velocities in the portal venous end, mid-portion, and hepatic venous end of the TIPS. In a normally functioning TIPS, flow direction in the portal vein is antegrade (toward the TIPS), whereas in the right and left branches of the portal vein flow in most cases becomes retrograde (toward the TIPS) after TIPS placement. Within the TIPS, spectral Doppler shows turbulent venous waveforms with normal flow velocities of 95 to 200 cm/s. Flow velocities of 50 to 95 cm/s are considered to be indicative of insignificant TIPS stenosis. Flow velocities below 50 cm/s, or a focal jet within the TIPS or at the hepatic vein outflow greater than 200 cm/s, indicate significant TIPS stenosis. Conversion of blood flow in the right or left branches of the portal vein from retrograde (out of the liver) to antegrade (into the liver) is an indirect sign of TIPS malfunction. With TIPS, occlusion thrombus fills the lumen of the shunt. TIPS malfunction is addressed angiographically.
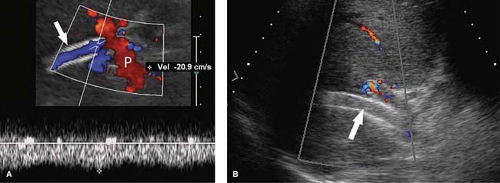 Figure 35.14. Transjugular Intrahepatic Portosystemic Shunt (TIPS) Malfunction. A. Color and spectral Doppler assessment of a TIPS (arrow) shows abnormally low-velocity flow (20.9 cm/s) at the portal venous end (P). On further Doppler interrogation, this finding was shown to be caused by high-grade stenosis at the hepatic venous end. B. TIPS in another patient is completely occluded, shows no blood flow on color Doppler imaging, and is filled with echogenic thrombus (arrow). Note the highly reflective walls of the stents in both patients. |
Liver Transplants. US with Doppler is the imaging method of choice for postoperative evaluation of liver transplants (Fig. 35.15) (18,19). Liver transplantations are performed using living donors (either right lobe or left lobe transplants) or cadaveric full liver transplants in both adults and children. Peritransplant fluid collections are common in the immediate posttransplant period. Simple anechoic fluid collections include ascites, bile, and lymph. Fluid with particulate matter is usually pus or blood. Hepatic artery complications account for 60% of vascular complications and include thrombosis, stenosis, and pseudoaneurysms. Thrombosis and stenosis of the portal vein or inferior vena cava are uncommon. Bile leaks, bile duct anastomotic strictures, necrosis of bile ducts, and stones in the bile ducts account for 25% of complications. Posttransplantation lymphoproliferative disorder (PTLD) may occur 4 to 12 months following transplantation. Focal solid hypoechoic masses may be seen within or adjacent to the transplanted liver. HCC is a risk for the immunocompromised posttransplant patient.
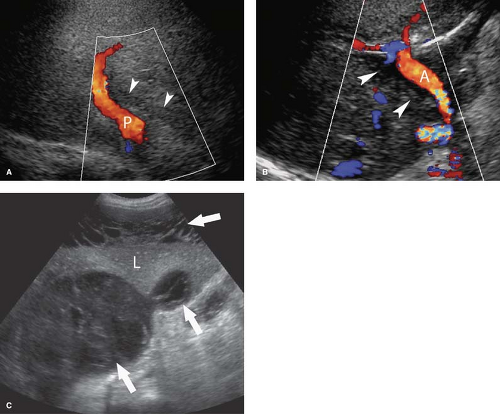 Figure 35.15. Liver Transplant. A. The hepatic artery (arrowheads) of the liver transplant is filled with thrombus and shows no flow on color Doppler imaging. This constitutes a surgical emergency requiring immediate revascularization to save the transplant. The portal vein (P) is widely patent. B. In this patient, 2 days post liver transplant, the portal vein (arrowheads) is completely occluded and filled with thrombus. The hepatic artery (A) is widely patent. This uncommon complication also requires correction with thrombolysis, angioplasty, or stent placement. C. Multiple complex septated fluid collections (arrows) surround and indent the transplant liver (L). The patient did not become infected and all spontaneously resolved. Peritransplant hematomas and seromas are common following liver transplantation. |
Bile Ducts
Normal US Anatomy. Intrahepatic bile ducts run in the portal triads in the company of the portal veins and hepatic arteries (20). Normal intrahepatic ducts are visualized with current high-resolution US. Intrahepatic ducts normally do not exceed 2 mm in diameter in the central liver or 40% of the diameter of the adjacent portal vein. The junction of the right and left lobe bile ducts to form the common hepatic duct marks the division between the intrahepatic and extrahepatic portions of the biliary tree. The junction of the cystic duct with the common hepatic duct marks the commencement of the common bile duct. Because this junction is seldom visualized with US, the generic term “common duct” is used to identify the duct in the porta hepatis. The common duct courses anterior to the main portal vein, the right portal vein, and the right hepatic artery in the portal region. The hepatic artery is commonly tortuous in the porta hepatis, but the common duct runs a straight course parallel to the portal vein. This straight portion of the common duct is routinely measured, although the normal limit of diameter for the adult population remains controversial. All agree that a common duct diameter ≤6 mm is normal for an adult. Some studies suggest that the normal duct dilates with age (1 mm per decade; an 8-mm duct would be normal for an 80-year-old patient) and that the duct dilates following cholecystectomy. Other studies refute these claims. It seems appropriate that an asymptomatic patient with a duct greater than 7 mm could be followed for evidence of change. A symptomatic patient deserves further evaluation with MRCP or ERCP.
As the portal triad structures course through the free edge of the hepatoduodenal ligament, a “Mickey Mouse” configuration is formed, with the common duct forming Mickey’s right ear (Fig. 35.16). The normal common bile duct can be traced descending adjacent to the pancreatic head to its insertion at the Ampulla of Vater. Normal variants that may cause confusion include a “replaced” right hepatic artery arising from the superior mesenteric artery and coursing between the portal vein and inferior vena cava to the porta hepatis. An elongated gallbladder neck may be mistaken for a dilated common duct. Low insertion of the cystic duct causes the appearance of two common ducts. Doppler identification of vascular structures is helpful in confusing cases.
Dilatation of the Biliary Tree. Dilated intrahepatic ducts are tortuous like the branches of an oak tree, exceed 40% of the diameter of the adjacent portal vein, and are visualized in the periphery of the liver (21). US shows “too many tubes” in the liver, and color Doppler US offers rapid differentiation of patent blood vessels and dilated bile ducts (Fig. 35.17). Dilated extrahepatic ducts exceed 6 to 7 mm in diameter and appear
as enlargement of Mickey’s right ear in the hepatoduodenal ligament. The dilated duct should be followed to the level of obstruction, where careful evaluation will demonstrate the cause of obstruction in 80% of patients. Echogenic material within dilated bile ducts is seen with biliary stasis and hemobilia.
as enlargement of Mickey’s right ear in the hepatoduodenal ligament. The dilated duct should be followed to the level of obstruction, where careful evaluation will demonstrate the cause of obstruction in 80% of patients. Echogenic material within dilated bile ducts is seen with biliary stasis and hemobilia.
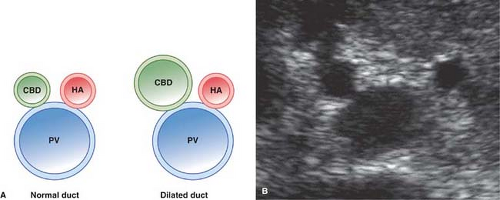 Figure 35.16. “Mickey Mouse” Configuration of the Portal Triad. A. A drawing demonstrates the anatomic relationships of the common bile duct (CBD), hepatic artery (HA), and portal vein (PV). Dilation of the common bile duct enlarges Mickey’s right ear. B. US image of Mickey Mouse. |
Choledocholithiasis. Stones in the bile ducts appear as echogenic objects within the lumen of the duct (Fig. 35.18). Unfortunately, not all intraluminal stones will cast a distinct acoustic shadow. Technique must be optimized to demonstrate shadowing. Nonetheless, US detection of obstructing common duct stones is only about 75% sensitive. Abrupt termination of a dilated common duct is an indication for MR cholangiography. Calcification in the hepatic artery may mimic the appearance of stones or gas in the biliary tree.
Gas in the biliary tree is most commonly the result of surgical procedures, such as sphincterotomy or choledochoenterostomy (see Table 26.9). Additional causes include gas-producing infection, fistulous connection with the intestinal tract (gallstone ileus, perforating duodenal ulcer), and trauma. Air in bile ducts causes bright linear or globular reflections often with shadowing and ring-down artifacts (Fig. 35.19). Air will move in the biliary tree, with changes in patient positioning. Ducts are usually dilated when air is present.
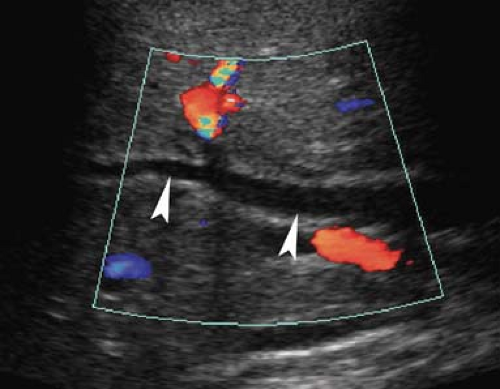 Figure 35.17. Bile Duct Dilation. Color Doppler US makes it easy to differentiate dilated bile ducts (arrowheads) from blood vessels showing blood flow in color. |
Cholangiocarcinoma. Hilar cholangiocarcinoma (Klatskin tumor) and extrahepatic cholangiocarcinoma tend to be small (<3 cm) when they present with biliary obstruction (22). US demonstrates the tumor as a focal mass at the point of obstruction (Fig. 35.20), nodular thickening of the bile duct wall, or polypoid intraluminal mass. The visualized mass is most commonly isoechoic with the liver parenchyma but may be hypoechoic or hyperechoic. Abrupt termination of a dilated
duct without a mass being seen may be the only finding. Adjacent portal veins may be invaded and obstructed by tumor.
duct without a mass being seen may be the only finding. Adjacent portal veins may be invaded and obstructed by tumor.
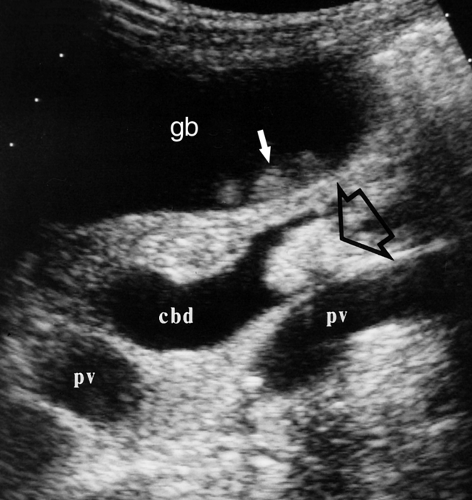 Figure 35.18. Choledocholithiasis. US image of the porta hepatis demonstrates a large stone (open arrow) obstructing the common bile duct (cbd) and resulting in its dilation (13 mm diameter). The gallbladder (gb) is dilated and contains several nonshadowing sludge balls (white arrow) formed as a result of biliary stasis. pv, portal vein. |
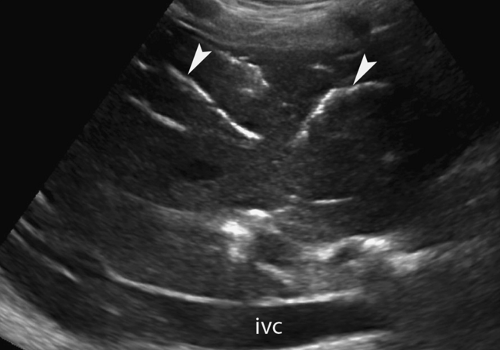 Figure 35.19. Gas in the Biliary Tree. Longitudinal image of the liver shows a series of bright linear echoes (arrowheads) corresponding to gas in the intrahepatic biliary tree. The linear echoes moved and changed in appearance with alterations in patient position. This patient had undergone a sphincterotomy because of gallstone disease. The inferior vena cava (ivc) is evident. |
Recurrent pyogenic cholangiohepatitis, also referred to as “oriental” cholangiohepatitis, is related to infestation of the biliary tree by parasites. Causative organisms include Clonorchis sinensis, Opisthorchis viverrini and felineus, and Fasciola hepatica (23). US reveals bile ducts that are focally dilated or stenotic. Flukes in the bile ducts appear as nonshadowing echogenic foci. Gallstones may or may not be present as well. Debris (“biliary mud”) may fill and layer within dilated ducts. Most patients originate from Southeast Asian countries where the disease is endemic.
AIDS-related cholangitis features dilated intra- and extrahepatic bile ducts, with thickening of the walls of the bile ducts and gallbladder. Sludge is commonly seen, but stones are usually not present. A unique finding is an echogenic nodule representing edema of the papilla of Vater at the termination of the dilated common bile duct.
Biliary Ascariasis. Worms that colonize the intestinal tract may find their way into the biliary tree and gallbladder (23). Living worms may obstruct the biliary tree and gallbladder and cause cholangitis, cholecystitis, and pancreatitis with a high associated mortality (24). Worms are seen by US as moving tubular echogenic structures with an echolucent core.
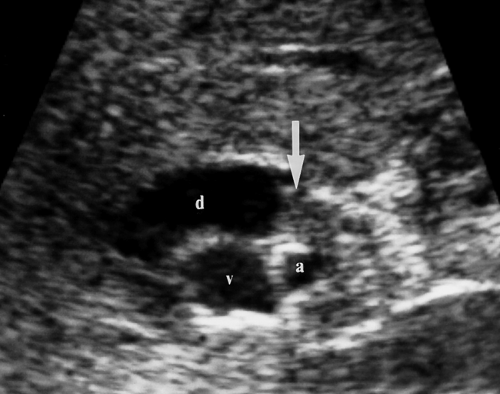 Figure 35.20. Cholangiocarcinoma. Tumor (arrow) obstructs and dilates the common bile duct (d) in the porta hepatis. v, portal vein; a, hepatic artery. |
Congenital Biliary Cysts. The classification of congenital biliary cysts is illustrated in Chapter 26. US is excellent in demonstrating the morphology of cystic masses and their relationship to the biliary tree.
Gallbladder
Normal US Anatomy. The gallbladder is found on the undersurface of the liver, with the gallbladder neck positioned in the interlobar fissure. Normal bile is anechoic. The normal wall does not exceed 3 mm in thickness (Fig. 35.21). The mucosa is echogenic and the smooth muscle layer of the wall is hypoechoic. The diameter of the gallbladder is less than 4 cm in 96% of normals. Length of the gallbladder is highly variable and measurement is not diagnostically useful. Most patients are examined after an overnight fast, although a 4-hour fast is usually sufficient to ensure gallbladder distension. Patients are examined in multiple positions to displace gallstones and demonstrate their mobility. The neck region should be carefully examined to avoid overlooking impacted stones. Normal folds in the gallbladder neck and cystic duct may cause acoustic shadows and mimic gallstones.
Echogenic Bile. Bile becomes echogenic when it is highly concentrated and cholesterol crystals and calcium bilirubinate granules precipitate as sludge. Sludge commonly layers in the gallbladder and may become quite viscous and form tumefactive sludge or “sludge balls” (Fig. 35.22). Sludge balls usually move within the gallbladder but do not cast acoustic shadows. Floating cholesterol crystals are seen as bright reflectors with short comet-tail artifacts. Air in bile has a similar appearance. Sludge is not definitive evidence of gallbladder disease but is indicative of a prolonged lack of bile turnover in the gallbladder. Prolonged fasting is the most common cause, but sludge is usually present with gallbladder and biliary obstruction. Sludge is not produced by the routine overnight fast advised in preparation for gallbladder examination. Additional causes of echogenic bile are blood, pus, and parasites.
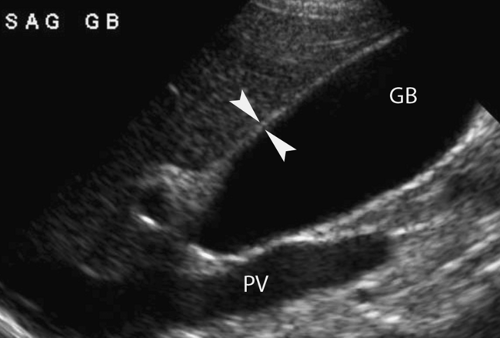 Figure 35.21. Normal Gallbladder. Sagittal image shows the normal appearance of the gallbladder (GB) distended with normal anechoic bile by a 4-hour fast. The gallbladder wall is routinely measured (arrowheads) between the lumen of the gallbladder and the parenchyma of the liver. This standardized measurement includes the wall of the gallbladder, the capsule of the liver, and any tissue, edema, or fluid between the two. The normal measurement does not exceed 3 mm. The portal vein (PV) is evident beneath the gallbladder. |
 Figure 35.22. Echogenic Bile—Sludge Ball. Highly concentrated echogenic bile fills the gallbladder (arrowheads) producing an echogenic mass (M). Color Doppler US is essential to verify the lack of blood flow within the mass, confirming echogenic bile and excluding gallbladder carcinoma. |
Related posts:
Stay updated, free articles. Join our Telegram channel

Full access? Get Clinical Tree


