Abdomen Ultrasound
Imaging Technique
The abdomen is examined with sector or curved array transducers using frequencies of 5.0 to 2.25 MHz. The highest frequency that allows adequate penetration is used [1]. Routine examinations are conducted following a minimum fast of 4 hours to allow for filling of the gallbladder. Emergency examinations are conducted without patient preparation.
The liver is examined in transverse and longitudinal planes. The entire liver, porta hepatis, portal veins (PVs), hepatic veins, and intrahepatic inferior vena cava (IVC) are examined and documented on recorded images. Much of the liver is examined using an intercostal approach. Having the patient breathe in deeply will depress the liver for examination along the costal margin. An image that includes the liver and the right kidney should always be obtained to compare the relative echogenicity of the parenchyma of each organ. The right pleural space and right hemidiaphragm are included in the examination.
The intrahepatic bile ducts are examined along with the PVs and peripheral portal triads. Recorded images should include the right and left branches of the PVs and bile ducts. The common bile duct (CBD) is visualized in the porta hepatis and its diameter is measured (see Figs. 2.6, 2.7). Its course should be followed through the pancreatic head to its terminus in the descending duodenum.
The gallbladder (GB) is examined in its long and short axes with careful inspection for gallstones, luminal contents, wall thickness, and surrounding pathology. The examination is conducted with the patient in supine, left lateral decubitus, erect (sitting), and prone positions as needed to aid in the detection of gallstones and to document their mobility.
The pancreas is examined by transverse and sagittal imaging in the epigastrium. The left lobe of the liver serves as a sonographic window to the pancreas. Visualization of the pancreas is easy when the left lobe is large and is difficult when the left lobe is small. Air in the transverse colon and small bowel may obscure the pancreas and must be moved out of the way by graded transducer pressure. The patient is told that the examiner will “press hard” and is asked to tell the examiner if the maneuver becomes painful. In my experience other touted maneuvers, such as filling the stomach with water, seldom are worth the effort. Only graded compression works reliably to visualize the hidden pancreas. The
splenic vein (SV) serves as the major sonographic landmark for the neck, body, and tail of the pancreas. The tail region is often obscured by gas in overlying small bowel. Masses in the tail region may be seen by using a left lateral approach to image the tail in the splenic hilum region through the spleen. The pancreatic head is identified by finding the PV commencement at the junction of the SV and superior mesenteric vein (SMV). The head envelops this confluence and extends caudally to wrap under the SMV as the uncinate process. This caudal extension of the head and the uncinate process is best shown in transverse plane. This area is particularly important to examine because it includes the terminus of the CBD and the pancreatic duct into the duodenum. Many disease processes (tumors, obstructing stones) involve this area.
splenic vein (SV) serves as the major sonographic landmark for the neck, body, and tail of the pancreas. The tail region is often obscured by gas in overlying small bowel. Masses in the tail region may be seen by using a left lateral approach to image the tail in the splenic hilum region through the spleen. The pancreatic head is identified by finding the PV commencement at the junction of the SV and superior mesenteric vein (SMV). The head envelops this confluence and extends caudally to wrap under the SMV as the uncinate process. This caudal extension of the head and the uncinate process is best shown in transverse plane. This area is particularly important to examine because it includes the terminus of the CBD and the pancreatic duct into the duodenum. Many disease processes (tumors, obstructing stones) involve this area.
The spleen is best imaged with the patient supine utilizing a posterior intercostal approach in the left upper quadrant [2,3]. Unless the spleen is enlarged, placing the patient in a right lateral decubitus position may be counterproductive because hyperexpansion of the left lung obliterates the narrow intercostal window to the spleen.
The peritoneal cavity is carefully inspected for the presence of ascites, blood, abscess, or tumor. Examination should include the major peritoneal recesses including the subdiaphragmatic spaces on both sides, the hepatorenal fossa (Morison’s pouch), the paracolic gutters, and the pelvis and cul de sac.
US examination of the abdomen is commonly extended to include the retroperitoneum, kidneys, abdominal aorta, and IVC. These examinations are discussed in subsequent chapters.
Anatomy
Liver
Localization of tumors to segments of the liver is critical in the planning of surgical resection. The international Couinaud (pronounced “kwee-NO”) system of hepatic nomenclature is currently utilized [4,5,6]. This system is based on the distribution of portal and hepatic veins. The right and left lobes are divided by the main hepatic fissure defined by the middle hepatic vein in the superior portion of the liver and by a line connecting the GB with the IVC in the inferior portion of the liver. Each segment has a branch PV at its center and a hepatic vein at its periphery. Segments are numbered clockwise starting with the caudate lobe (segment 1), left lobe (segments 2-4), and right lobe (segments 5-8) (Table 2.1, Fig. 2.1). The caudate lobe is anatomically distinct, extending between the IVC and the left lobe and separated from the left lobe by the fissure of the ligamentum venosum (Fig. 2.2).
Blood supply to the liver is provided by both the PV (~70%) and the hepatic artery (~30%). This dual blood supply makes infarction rare in the liver. Both enter the liver at the porta hepatis and divide into right and left lobe branches. Doppler documents blood flow direction in both vessels as into the liver (hepatopetal). Spectral Doppler shows a low-resistance, arterial flow pattern for the hepatic artery with forward flow throughout the cardiac
cycle. Diastolic flow velocity increases and resistance index decreases after eating. The PV shows continuous antegrade venous flow with small pulsations that mirror the cardiac cycle. Mean velocity in the PV is 15-18 cm/sec.
cycle. Diastolic flow velocity increases and resistance index decreases after eating. The PV shows continuous antegrade venous flow with small pulsations that mirror the cardiac cycle. Mean velocity in the PV is 15-18 cm/sec.
Table 2.1: Couinard’s Liver Segments | |||||||||||||||||||||||||||
|---|---|---|---|---|---|---|---|---|---|---|---|---|---|---|---|---|---|---|---|---|---|---|---|---|---|---|---|
|
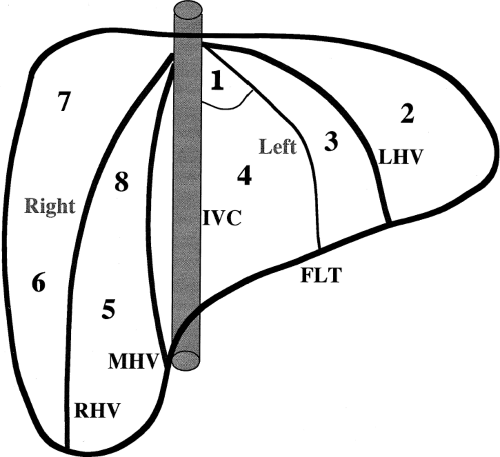 Figure 2.1 Couinaud’s Liver Segments. Diagrammatic representation of Couinaud’s numerical liver segments. FLT, fissure of the ligamentum teres; IVC, inferior vena cava; LHV, left hepatic vein; MHV, middle hepatic vein; RHV, right hepatic vein. Adapted from Smith D, Downey D, Spouge A, et al. Sonographic demonstration of Couinard’s liver segments. J Ultrasound Med 1998;17:375-381. |
Venous drainage of the liver is by three major hepatic veins that enter the IVC just below the diaphragm (Fig. 2.3). The right hepatic vein divides the anterior and posterior segments of the right lobe and enters the IVC separately. The middle and left hepatic veins may join just before entering the IVC. The middle hepatic vein separates the right and left lobe while the left hepatic vein divides the medial and lateral segments of the left lobe. Hepatic veins have no valves and their blood flow reflects the triphasic pulsatility of the IVC and right atrium. Spectral Doppler shows prominent antegrade flow toward the heart during systole reflecting movement of the tricuspid valve toward the cardiac apex. A second antegrade peak is produced in early diastole by opening of the tricuspid valve. In late diastole flow is reversed in the hepatic vein owing to atrial contraction. The caudate lobe drains directly into the IVC via small venous channels.
The liver parenchyma has homogeneous echogenicity equal to or slightly greater than the echogenicity of renal parenchyma (Fig. 2.4). Liver echogenicity is slightly less than that of the spleen. Portal triads are seen as echogenic foci well out into the periphery of the liver
(Fig. 2.4). Fissures and ligaments are usually invested in fat and are highly echogenic (Fig. 2.2). The fissure of the ligamentum teres in the left lobe must not be mistaken for an echogenic mass (Fig. 2.5).
(Fig. 2.4). Fissures and ligaments are usually invested in fat and are highly echogenic (Fig. 2.2). The fissure of the ligamentum teres in the left lobe must not be mistaken for an echogenic mass (Fig. 2.5).
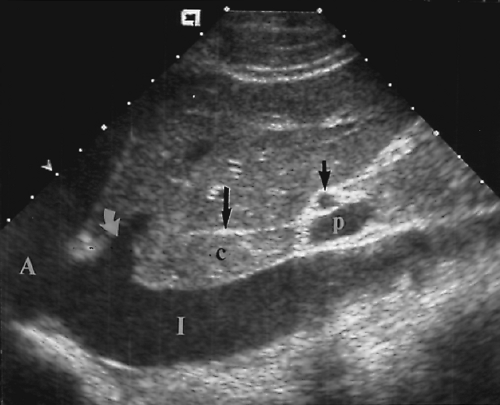 Figure 2.2 Caudate Lobe. The caudate lobe (c) is between the inferior vena cava (I) and the fissure of the ligamentum venosum (long arrow). The inferior vena terminates in the right atrium (A). The curved arrow indicates the right hepatic vein. Also seen are the portal vein (p) and the hepatic artery (short arrow). |
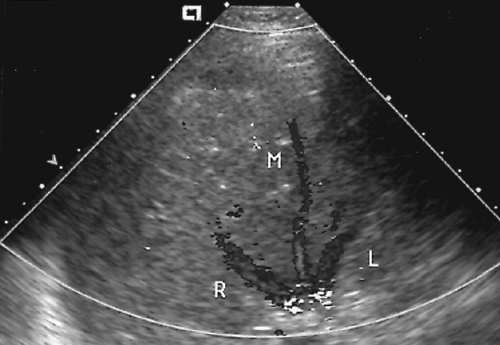 Figure 2.3 Normal Hepatic Veins. Transverse image through the liver obtained just below the diaphragm shows the right (R), middle (M), and left (L) hepatic veins converging to enter the inferior vena cava. |
Biliary Tree
Intrahepatic bile ducts (IHBD) course in the portal triads with the PVs and hepatic arteries. In the portal triads the relationship of the three structures to each other is not constant. The bile ducts may be anterior to, posterior to, or wrap around the PV [7]. Small bile ducts progressively anastomose to form the right and left lobe bile ducts that join in the porta hepatis to form the common hepatic duct. The common hepatic duct becomes the CBD approximately 3 cm distally at the junction of the cystic duct. The common hepatic duct and CBD are approximately 10 cm in length (Figs. 2.6, 2.7). Since they course outside of the liver parenchyma both are considered extrahepatic bile ducts (EHBD). The CBD joins with the main PV and the proper hepatic artery to cross the foramen of Winslow in the hepatoduodenal ligament. In this region the three structures maintain a constant relationship with the larger PV posterior and the smaller CBD and hepatic artery anterior. In cross section the three structures resemble Mickey Mouse with the vein being his face, the CBD his right ear, and the hepatic artery his left ear (Fig. 2.8). Dilatation of the CBD enlarges Mickey’s right ear. The distal CBD passes behind the duodenum to run in a groove formed by the posterior pancreatic head and the medial aspect of the duodenum (see Fig. 2.14). The CBD enters the duodenum opposite the uncinate process of the pancreas.
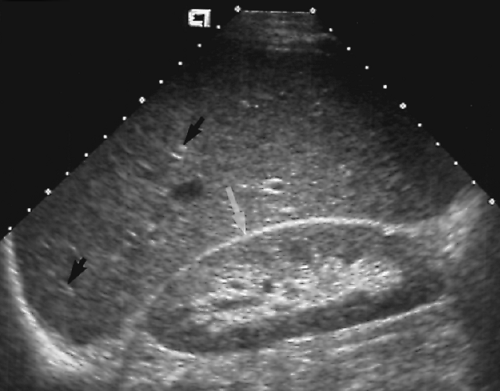 Figure 2.4 Normal Liver and Kidney Echogenicity. The parenchyma of the liver and kidney are equal in echogenicity. The white arrow indicates the location of the hepatorenal fossa (Morison’s pouch). The portal triads (black arrows) are well visualized. |
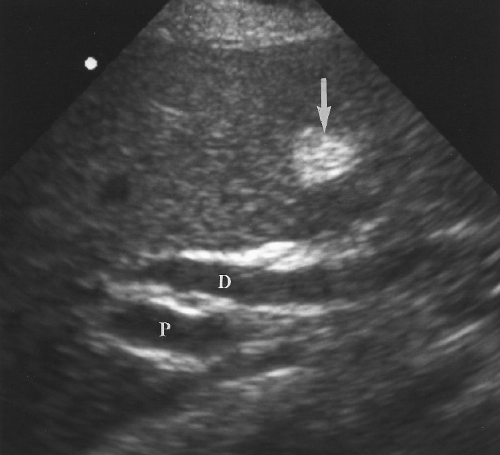 Figure 2.5 Normal Fat in Fissure of Ligamentum Teres. Transverse image through the left lobe of the liver demonstrates a focal echogenic area (arrow) that might be mistaken for an echogenic mass. This is the characteristic appearance and location of fat in the fissure of the ligamentum teres. Imaging in the longitudinal plane shows an elongated appearance to fat in the fissure. This patient also has a dilated bile duct (D) anterior to the portal vein (P). |
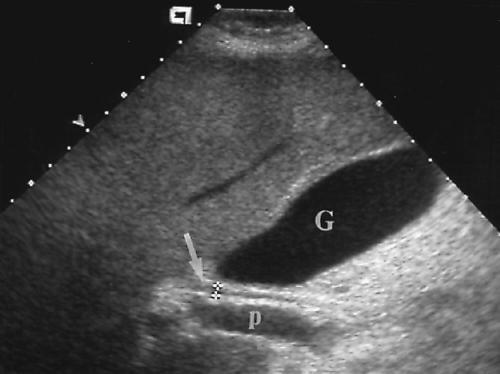 Figure 2.6 Common Bile Duct. The common bile duct (arrow) anterior to the portal vein (p) is measured with cursors (+). Compare to appearance of the dilated common bile duct in Figure 2.5. The gallbladder (G) is also seen. |
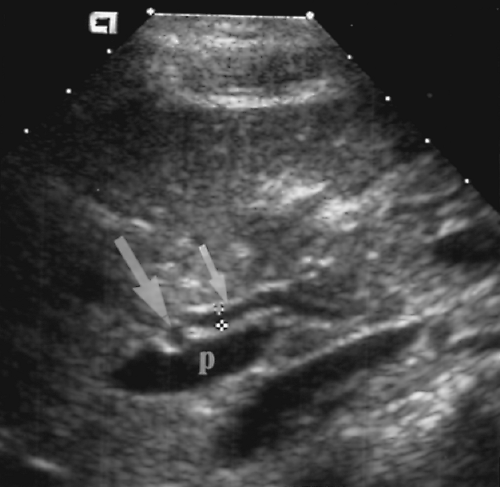 Figure 2.7 Porta Hepatis. The portal vein (p), common duct (short arrow), and hepatic artery (large arrow) course in the hilum of the liver, the porta hepatis. Note the oblique orientation of the hepatic artery as it courses between the common duct and the portal vein. Cursors (+) measure the diameter of the common bile duct. |
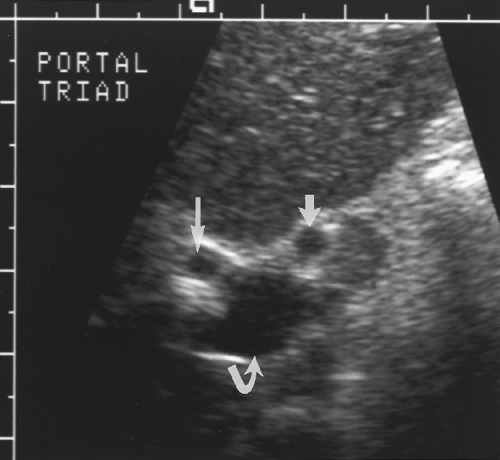 Figure 2.8 Mickey Mouse. Transverse image of the portal triad as it crosses the hepatoduodenal ligament resembles Mickey Mouse with the face being the portal vein (curved arrow), the hepatic artery being the left ear (short arrow), and the common bile duct being the right ear (long arrow). |
Gallbladder
The GB is a pear-shaped, bile-filled sac nestled in a concave fossa on the visceral surface of the liver (Figs. 2.6, 2.9). The fundus usually projects beyond the edge of the liver while the body and neck extend dorsally toward the porta hepatis. The hepatic surface of the GB is attached to the liver by blood vessels and connective tissue whereas the inferior surface and fundus of the GB are covered by visceral peritoneum. Occasionally the GB is suspended on a mesentery and is not closely applied to the liver. The GB wall is made up of three layers of tissue. The inner mucosa is redundant and loosely connected to the fibromuscular layer. The mucosa is mucin-secreting columnar epithelium and is continuous with the epithelium of the cystic duct and biliary tree. The fibromuscular layer provides the framework of the sac with interlaced fibrous tissue and smooth muscle. The external coat is the covering peritoneum. The cystic duct is 4 cm long extending from the GB neck to the hepatic duct which it joins to form the CBD. The mucosal lining of the cystic duct forms 5-12 folds that constitute the spiral valve of Heister. These folds may cast acoustic shadows and mimic small stones lodged in the cystic dust. After a fast of 4 or more hours the normal GB is well distended and easily visualized by US as a gourd-shaped sac of fluid. Normal bile is echo-free. The normal GB does not exceed 5 cm in transverse diameter. In 4% of patients the fundus
folds back on itself forming a “Phrygian cap.” Additional normal folds may be seen near the neck of the GB. The GB wall is visualized as a thin echogenic line at the GB interface with the liver. Wall thickness is measured between the liver parenchyma and the GB lumen. This measurement, which includes the liver capsule, the entire GB wall, and intervening tissue, is normally less than 3 mm.
folds back on itself forming a “Phrygian cap.” Additional normal folds may be seen near the neck of the GB. The GB wall is visualized as a thin echogenic line at the GB interface with the liver. Wall thickness is measured between the liver parenchyma and the GB lumen. This measurement, which includes the liver capsule, the entire GB wall, and intervening tissue, is normally less than 3 mm.
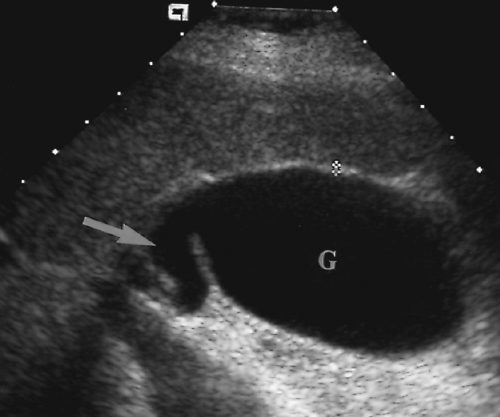 Figure 2.9 Normal Gallbladder. Image through the long axis of the gallbladder (G) demonstrates a tortuous gallbladder neck (arrow). Gallbladder wall thickness is measured between the gallbladder lumen and the hepatic parenchyma (cursors, +). This gallbladder wall measures a normal 2 mm. |
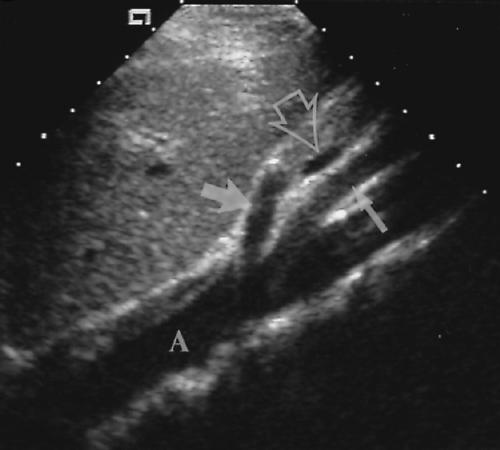 Figure 2.10 Aortic Branch Arteries. Longitudinal image through the aorta (A) shows the origin of the celiac axis (fat arrow) and the superior mesenteric artery (skinny arrow). The splenic vein (open arrow) is seen in cross section. |
Pancreas
The pancreas is identified on US by recognition of the blood vessels within and around the pancreatic parenchyma (Figs. 2.10, 2.11, 2.12, 2.13 and 2.14). The neck, body, and tail of the pancreas course anterior and parallel to the SV. The total length of the pancreas from head to tail is 12-15 cm. The neck of the pancreas is anterior to the confluence of the SV and the SMV that forms the PV. The SV is of uniform diameter (<10 mm) until its junction with the SMV where the combined veins form a teardrop-shaped dilatation (Figs. 2.12, 2.13 and 2.14). The SMV courses in sagittal plane just to the right and usually slightly anterior to the superior mesenteric artery (SMA). The uncinate process of the pancreas extends leftward beneath the SMV to form a
tapered projection. Blunting of the normally tapered uncinate process is a sensitive sign of pancreatic enlargement or tumor. The SMA arises anteriorly from the aorta at or near the level of the crossing SV (Fig. 2.10). The SMA is surrounded by a collar of echogenic fat and appears, on transverse section, as the hole in a doughnut (Figs. 2.12, 2.14). The left renal vein and the transverse portion of the duodenum course underneath the SMV and SMA caudal to the level of the pancreas. The celiac axis arises from the aorta just cephalad to the pancreas (Fig. 2.10). In transverse plane the bifurcation into the hepatic and splenic arteries resembles a seagull in flight. The left gastric artery origin off the celiac axis may be seen in longitudinal plane.
tapered projection. Blunting of the normally tapered uncinate process is a sensitive sign of pancreatic enlargement or tumor. The SMA arises anteriorly from the aorta at or near the level of the crossing SV (Fig. 2.10). The SMA is surrounded by a collar of echogenic fat and appears, on transverse section, as the hole in a doughnut (Figs. 2.12, 2.14). The left renal vein and the transverse portion of the duodenum course underneath the SMV and SMA caudal to the level of the pancreas. The celiac axis arises from the aorta just cephalad to the pancreas (Fig. 2.10). In transverse plane the bifurcation into the hepatic and splenic arteries resembles a seagull in flight. The left gastric artery origin off the celiac axis may be seen in longitudinal plane.
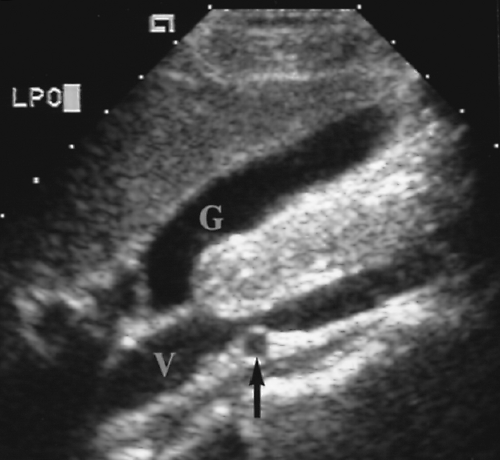 Figure 2.11 Inferior Vena Cava. Longitudinal image through the inferior vena cava (V) shows the right renal artery (arrow) crossing behind the cava. G, gallbladder. |
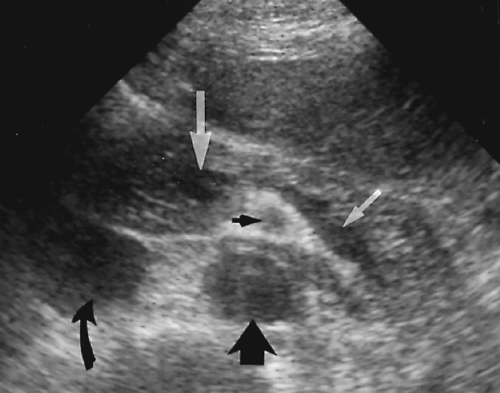 Figure 2.12 Normal Pancreas–Transverse. The pancreas is recognized by identifying its adjacent vasculature: the splenic vein (small white arrow), the superior mesenteric artery (black arrowhead), the inferior vena cava (curved black arrow), and the aorta (fat black arrow). The junction of the splenic vein with the superior mesenteric vein marks the commencement of the portal vein and is recognized by its teardrop shape (large white arrow) at the right end of the splenic vein. |
The CBD extends caudally in the posterior aspect of the pancreatic head where it is commonly visualized as a tubular structure that ends at the major papilla entering the descending duodenum (Fig. 2.14). The pancreatic duct courses centrally within the pancreatic parenchyma from the tail to the head (Fig. 2.15). It joins the CBD to drain into the major papilla in 80% of individuals. In the remaining 20% the pancreatic duct enters the duodenum separately at the minor papilla. The hypoechoic muscular wall of the stomach should not be mistaken for the pancreatic duct (Fig. 2.16). The gastroduodenal artery courses anterior and parallel to the CBD. Doppler US confirms its identification.
The normal echogenicity of the pancreatic parenchyma depends upon the amount of fatty infiltration. The pancreas has no distinct capsule and, with aging, fat infiltrates between the lobules of parenchyma and increases the echogenicity. In children and younger adults the pancreas resembles a slab of meat and has well-defined margins with echogenicity
approximately equal to liver parenchyma. In older patients the pancreas resembles a dust mop and has poorly defined margins with echogenicity just slightly less than fat.
approximately equal to liver parenchyma. In older patients the pancreas resembles a dust mop and has poorly defined margins with echogenicity just slightly less than fat.
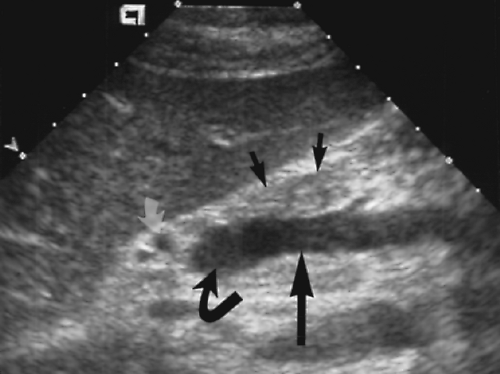 Figure 2.13 Normal Pancreas–Sagittal. Longitudinal image demonstrates the superior mesenteric vein (long arrow) extending cranially to its junction with the splenic vein to form the portal vein (black curved arrow). The hepatic artery (white curved arrow) is seen in cross section. A portion of the neck of the pancreas (2 small arrows) is seen anterior to the superior mesenteric vein. |
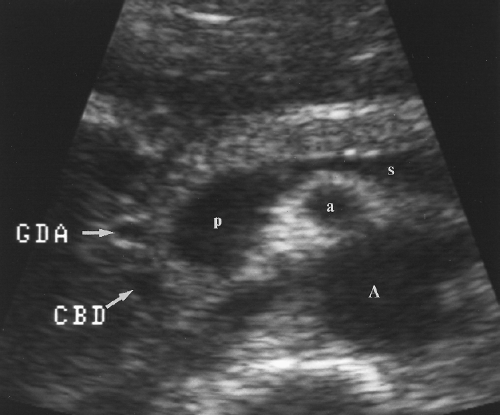 Figure 2.14 Normal Head of the Pancreas. Transverse view demonstrates the gastroduodenal artery (GDA) and the common bile duct (CBD) coursing adjacent to the head of the pancreas. The splenic vein (s) extends rightward to the commencement of the portal vein (p). Also seen are the superior mesenteric artery (a) and the aorta (A). |
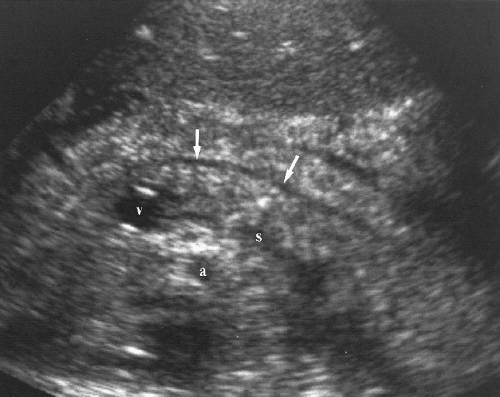 Figure 2.15 Normal Pancreatic Duct. A normal pancreatic duct (2 white arrows) courses in the substance of the pancreas anterior to a collapsed splenic vein (s). The portal vein origin (v) and superior mesenteric artery (a) are also seen on this transverse image. |
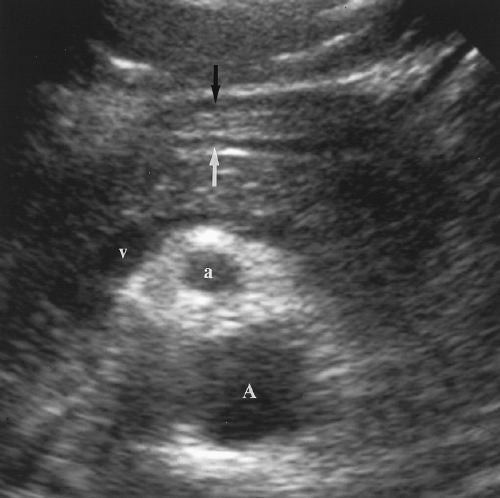 Figure 2.16 Stomach Wall Mimics the Pancreatic Duct. The hypoechoic posterior wall of the stomach (white arrow) may be mistaken for the pancreatic duct. This error is avoided by recognizing that the stomach wall is anterior to, rather than within, the pancreas and by identifying the anterior wall of the stomach (black arrow). Also seen on this transverse image are the superior mesenteric vein (v) and artery (a) and the aorta (A). |
Spleen
The spleen is normally visualized in the left upper quadrant of the abdomen between the diaphragm and the fundus of the stomach (Fig. 2.17). The spleen is soft and pliable allowing it to conform to the shape of the structures around it. Its diaphragmatic surface is smooth and convex, matching the concavity of the diaphragm. Its visceral surface is rounded and smooth with concavities for the stomach, left kidney, and the splenic flexure of the colon. Usual dimensions in adults are 12 cm in length, 7 cm in breadth, and 3-4 cm in thickness.
The spleen parenchyma is a network of lymphatic follicles (the white pulp) surrounded by vascular lakes filled with blood (the red pulp). On US the splenic parenchyma is extremely homogeneous with mid-to-low-level echogenicity slightly greater than that of the liver. The SV runs a relatively straight course rightward from the splenic hilum to the commencement of the PV dorsal to the neck of the pancreas. The SV receives the small inferior mesenteric vein in the region of the distal body of the pancreas and joins with the larger SMV to form the PV. The splenic artery is tortuous as it courses from the celiac axis to the splenic hilum. As the splenic artery enters the hilum it divides into six or more branches which ramify throughout the parenchyma. The capsule of the spleen is covered by closely applied visceral peritoneum except at the hilum and a small “bare area” at the posterior dome of the diaphragm. The spleen is anchored by phrenicolienal, lienorenal, and gastrolienal ligaments that converge at the hilum.
Peritoneal Cavity
The peritoneal cavity is that portion of the abdominal cavity that is bounded by the parietal peritoneum. It consists of numerous recesses formed by organs, ligaments, and peritoneal reflections [8]. The lesser sac is the large potential space behind the stomach. It communicates with the remainder of the peritoneal cavity only by the small opening of the foramen of Winslow. Fluid in the lesser sac usually occurs only as a result of disease in structures bordering the lesser sac [9]. The major recesses of the greater peritoneal cavity are the right
and left subdiaphragmatic spaces, the hepatorenal recess (Morison’s pouch) (Fig. 2.18), the paracolic gutters, and the pelvic cul-de-sac. These recesses are most apparent when fluid is present in the peritoneal cavity.
and left subdiaphragmatic spaces, the hepatorenal recess (Morison’s pouch) (Fig. 2.18), the paracolic gutters, and the pelvic cul-de-sac. These recesses are most apparent when fluid is present in the peritoneal cavity.
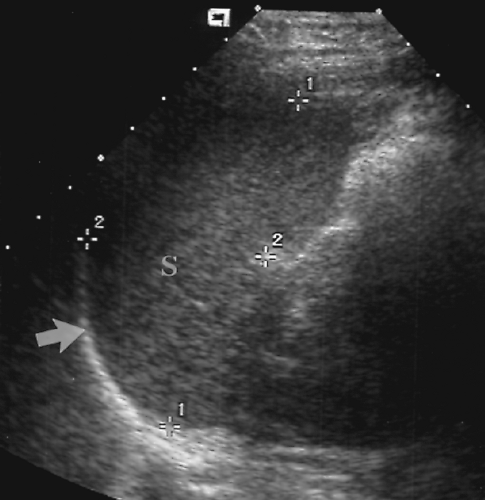 Figure 2.17 Normal Spleen. Longitudinal image shows a normal spleen (S; between cursors, +, 1, 2) conforming to the smooth curve of the diaphragm (arrow). |
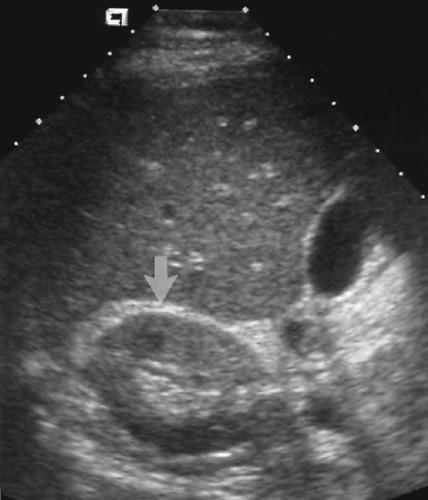 Figure 2.18 Hepatorenal Recess. Transverse image shows the location of the hepatorenal recess (Morison’s pouch) (arrow) between the liver and the right kidney. |
Liver
Diffuse Hepatic Disease
Hepatomegaly
Hepatomegaly is a nonspecific finding in primary and systemic diseases of the liver. Causes include vascular congestion, infection, tumors and cysts, diffuse cellular infiltration (lymphoma, leukemia), storage diseases, and fatty infiltration.
Length of the right lobe >15.5 cm is 87% accurate in the diagnosis of hepatomegaly (Fig. 2.19) [10].
Extension of the right lobe beyond the lower pole of the right kidney suggests hepatomegaly (Fig. 2.19).
Rounding of the inferior edge of the liver suggests pathologic enlargement (Fig. 2.20).
Reidel’s lobe is an elongation of the right lobe of the liver that may extend to the iliac crest. It is commonly found as a normal variation in thin women and may be mistaken for hepatomegaly. Reidel’s lobe is recognized by noting an associated decreased volume of the left hepatic lobe.
Viral Hepatitis
Viral hepatitis is a common illness throughout the world. It is classified as hepatitis A (spread by fecal-oral contamination), hepatitis B (spread by blood products and sexual contact), and hepatitis C (spread by blood transfusion).
Acute hepatitis causes diffuse interstitial edema and infiltration of inflammatory cells. US examination is commonly normal but may show hepatomegaly, GB wall edema, and
diffuse decrease in parenchymal echogenicity. The latter finding has been called the starry sky liver because the bright portal triads stand out as “stars” against a background of dark parenchyma (Fig. 2.21). Differential diagnosis of starry sky liver includes acute hepatitis, glycogen storage disease, leukemia, passive hepatic congestion, and toxic shock syndrome [11].
Chronic hepatitis implies continuing, usually low-grade, liver injury. US findings are usually normal until cirrhosis develops.
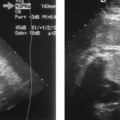
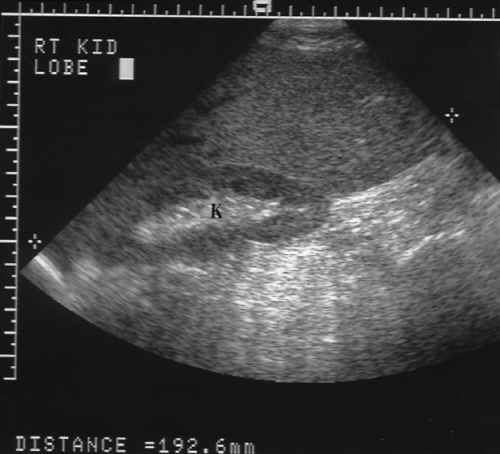 Figure 2.19 Hepatomegaly. The right lobe of the liver extends well below the lower pole of the right kidney (K) and measures 20 cm (between cursors, +), well exceeding the normal limit of 15.5 cm. |
Fatty Liver
Infiltration of hepatocytes with lipid is a common and non-specific reaction to hepatocyte injury. This abnormality has a multitude of causes (Box 2.1).
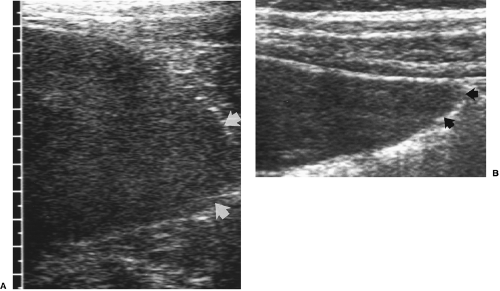 Figure 2.20 Blunting of the Liver Edge. A. A high frequency linear array transducer shows blunting of the edge of the liver (arrows). This finding is a sign of hepatomegaly or diffuse hepatic disease. B. A normal sharp liver edge (arrows) is shown for comparison. |
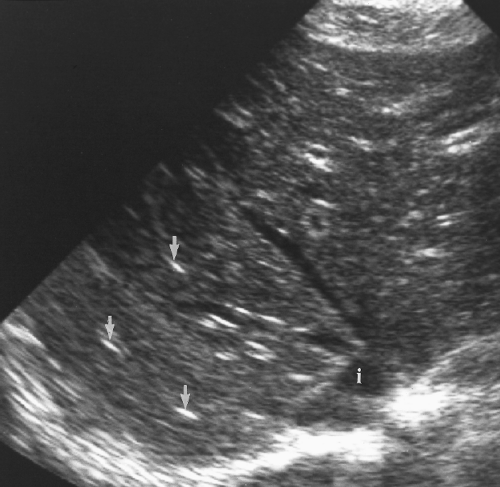 Figure 2.21 Acute Hepatitis. Transverse image at the level of the hepatic veins and inferior vena cava (i) shows the “starry sky” appearance of bright portal triads (arrows) on a background of edematous hypoechoic liver parenchyma. |
Fatty infiltration increases the echogenicity of the liver parenchyma and causes increased attenuation of the US beam resulting in poor definition of the deep portions of the liver and the diaphragm (Fig. 2.22). The fatty liver significantly exceeds the echogenicity of normal renal parenchyma.
Diffuse fatty liver involves all of the liver parenchyma. Vessels course normally through the parenchyma without distortion, encasement, or mass effect.
Focal fatty liver usually occurs in a lobar or segmental distribution. Angulated geometric boundaries between involved and spared areas of liver parenchyma are characteristic.
Single or multiple nodular areas of focal fatty infiltration may occur and simulate tumors and metastatic disease [12]. A key finding is the absence of mass effect on vessels within and adjacent to the focal fatty nodules. Focal fatty nodules tend to occur in the same areas as focal fatty sparing [13].
An interdigitating pattern of fatty infiltrated and spared parenchyma is an uncommon but characteristic pattern of involvement.
Focal sparing in diffuse fatty liver simulates hypoechoic masses (Fig. 2.23). Recognizing that the liver parenchyma is diffusely echogenic and that the spared, more hypoechoic areas are in characteristic locations makes this diagnosis. Common areas for focal sparing (and for focal fat infiltration) are the medial segment of the left lobe (segment IV), anterior to the PV bifurcation, near the GB bed, and in subcapsular parenchyma.
Correlation with CT of the liver that shows low attenuation in areas of fatty infiltration and normal attenuation in areas of fatty sparing is diagnostic in problem cases.
The patterns of fatty infiltration are related to the relative blood flow distributions of the PV and hepatic artery either preferentially carrying toxins to, or preferentially sparing, portions of the liver [14].
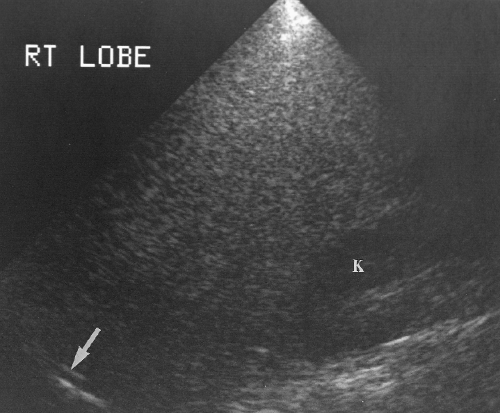 Figure 2.22 Diffuse Fatty Liver. The liver is markedly echogenic and difficult to penetrate with US despite the use of a 2.5-MHz transducer. The diaphragm (arrow) and right kidney (K) are barely visualized. The liver parenchyma is markedly more echogenic than the renal parenchyma. |
Cirrhosis
Cirrhosis is the final common pathway of chronic injury to the liver from many causes (Box 2.2). Parenchymal necrosis is followed by extensive fibrosis and nodular regeneration of hepatocytes with progressive distortion of lobar and vascular architecture [15].
Cirrhosis alters hepatic echotexture resulting in liver parenchyma that appears heterogeneous, nodular, grainy, or coarse, (Figs. 2.24, 2.25). Visualization of portal triads in the periphery of the liver is decreased. The echotexture of hepatic parenchyma does not correlate well with hepatic function or the severity of cirrhosis. In addition, this appearance is not specific and may be seen in other conditions such as diffuse metastatic disease (especially from breast cancer) or infiltrative hepatocellular carcinoma (HCC).
Increased echogenicity of the liver indicates fatty infiltration, which is commonly present in cirrhosis.
Scarring and nodular regeneration result in a nodular surface of the liver best seen with a linear array transducer (Fig. 2.26) or when ascites is present (Fig. 2.25) [16]. This finding is more specific for cirrhosis than is altered echotexture. The nodular contour varies from fine to coarse to grossly lobular [17].
Asymmetric shrinkage of the right lobe with relative hypertrophy of the left lobe and caudate lobe are common findings in alcoholic cirrhosis. Portal venous flow from the stomach, where most alcohol is absorbed, is preferential to the right lobe, relatively sparing the left and caudate lobes.
Nodules are a constant and problematic feature of cirrhosis.
Portal hypertension is evidenced by splenomegaly, ascites, enlargement of the PV and mesenteric veins, and the presence of portosystemic collaterals.
The hepatic artery is enlarged and tortuous in advanced cirrhosis.
Patients with cirrhosis are prone to PV thrombosis.
Cirrhosis decreases the compliance of the walls of hepatic veins resulting in spectral Doppler waveforms that are dampened and lack the normal pulsatility and flow reversal with atrial contraction that is characteristic of the hepatic veins [18]. This finding has been called portalization of the hepatic veins.
HCC develops in 5-12% of patients with cirrhosis.
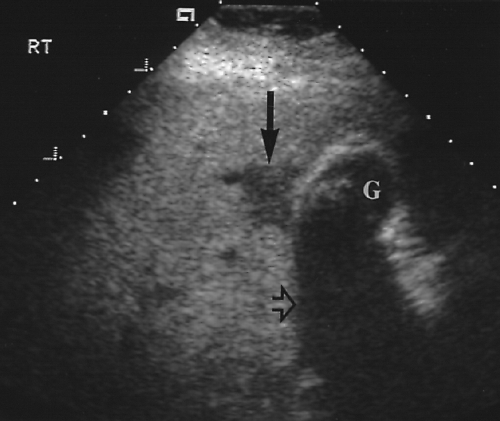 Figure 2.23 Focal Sparring in Fatty Liver. A hypoechoic area (arrow) with angulated margins located near the gallbladder (G) is characteristic of focal sparring in a markedly echogenic fatty liver. Gallstones in the gallbladder cast an acoustic shadow (open arrow). |
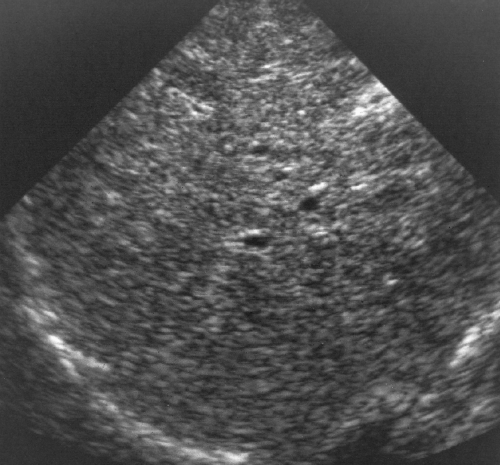 Figure 2.24 Cirrhosis. The fibrosis and altered architecture of cirrhosis cause a coarse appearance of the hepatic parenchyma with limited visualization of portal triads. |
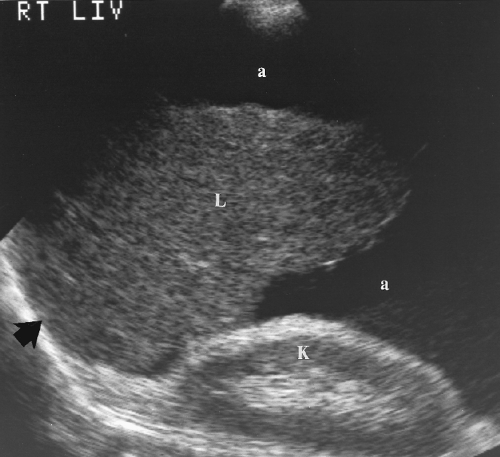 Figure 2.25 Cirrhosis and Ascites. The liver (L) appears shrunken and nodular as it is suspended in a sea of ascites (a). Note the echogenicity of the liver is nearly identical to the echogenicity of the right kidney (K) parenchyma. The “bare area” of the liver (arrow) is closely applied to the diaphragm and is not covered by ascites. |
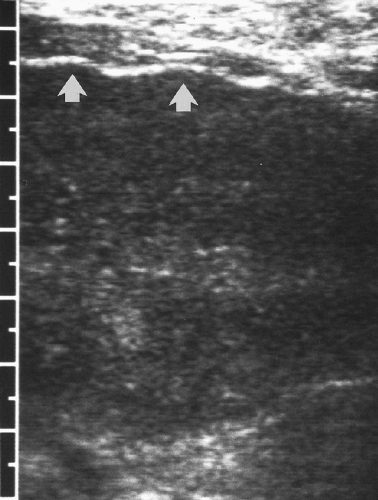 Figure 2.26 Nodular Liver Surface in Cirrhosis. Inspection of the liver surface with a high-frequency, linear array transducer demonstrates the surface nodularity (arrows) characteristic of cirrhosis. |
Nodules in Cirrhosis
Patients with cirrhosis are at high risk of developing HCC. Detection of this tumor is markedly impaired by the scarring and nodule formation that is characteristic of cirrhosis. A variety of nodular masses are seen in cirrhosis [19].
Regenerative nodules are present in all cirrhotic livers; however, imaging studies demonstrate them in only 25-50% of patients. Each nodule consists of a group of regenerating hepatocytes surrounded by fibrous septa. Regenerating nodules are usually <10 mm in size. Most regenerating nodules are isoechoic and are poorly seen on US. When seen,
the nodules are hypoechoic (Fig. 2.27). Nodularity is best appreciated by examining the surface of the liver with a high-frequency, linear array transducer (Fig. 2.26) [16].
Dysplastic regenerative nodules (adenomatous hyperplasia) contain areas of cellular atypia without distinct malignancy. These nodules are a precursor of HCC. Most exceed 10 mm in size. These nodules are best recognized as a solid hypoechoic dominant nodule surrounded by a group of smaller nodules [20].
Small HCCs (<3 cm) are difficult to differentiate from regenerative nodules. US detection rates of these small cancers are reported at 55-84%. Most small HCCs are hypoechoic solid tumors without necrosis. A thin peripheral hypoechoic halo, corresponding to a fibrous capsule, is a characteristic finding. Spectral Doppler shows high-velocity flow (70-90 cm/sec) in feeding arteries [21].
Focal confluent fibrosis may be seen as a mass replacing hepatic parenchyma. Focal fibrosis may occur in any form of cirrhosis but is most common in primary sclerosing cholangitis [20]. Confluent fibrosis may be wedge-shaped, peripheral, segmental, or lobar [22]. Associated parenchymal atrophy is prominent.
Hemangiomas and cysts are rare in cirrhotic livers, probably because they get obliterated by the cirrhotic process [20].
Metastatic disease from primary cancers outside of the liver is uncommon in cirrhotic livers, probably because cirrhosis creates an unfavorable environment for metastatic tumor growth [23].
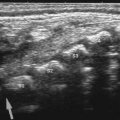
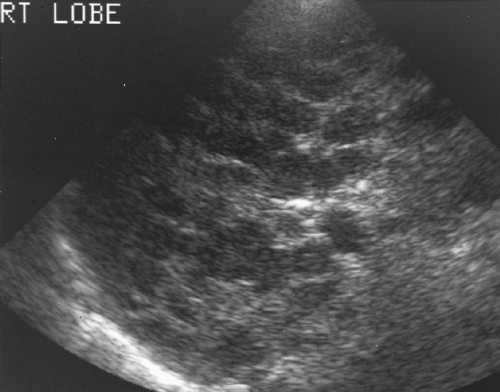 Figure 2.27 Regenerative Nodules in Cirrhosis. Innumerable small hypoechoic nodules are seen throughout the liver in this patient with cirrhosis. |
Portal Hypertension
US diagnosis of portal hypertension depends on indirect signs because non-invasive measurement of PV pressure is not currently possible.
PV diameter >13 mm and SV or SMV diameter >10 mm suggests portal hypertension (approximately 80% sensitivity and specificity) (Fig. 2.28) [24].
PV flow velocity < 21 cm/sec is 80% predictive [24].
Splenomegaly and ascites are usually present with significant portal hypertension.
Identification of porto-systemic collateral vessel enlargement (varices) is the most specific evidence of portal hypertension. A patent enlarged paraumbilical vein coursing through the fissure of the ligamentum teres (Fig. 2.29) and along the falciform ligament to the anterior abdominal wall and umbilicus is highly indicative. Additional enlarged collateral vessels may be seen along the lesser curve of the stomach (in the gastrohepatic ligament), in the hilum of the spleen (Fig. 2.30), and in the retroperitoneum especially near the renal hilum [25].
Retrograde flow in the PV (hepatofugal flow–away from the liver) (Fig. 2.31) is indicative of advanced portal hypertension.
Calcification may be seen in the wall of the portal, splenic, or mesenteric veins with long-standing portal hypertension [26].
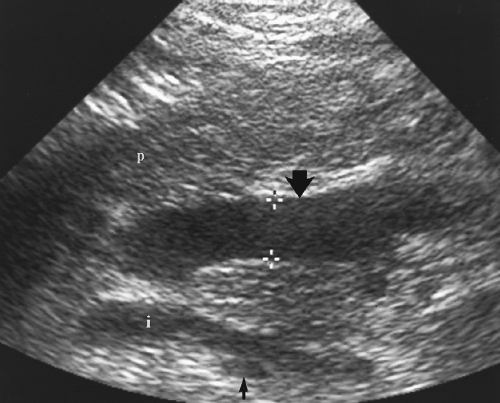 Figure 2.28 Portal Hypertension–Dilated SMV. Longitudinal image shows dilatation of the superior mesenteric vein (large arrow) to 12 mm (between cursors, +). This finding is highly indicative of portal hypertension. Seen posterior to the enlarged superior mesenteric vein is the inferior vena cava (i) and right renal artery (small arrow). p, neck of pancreas. |
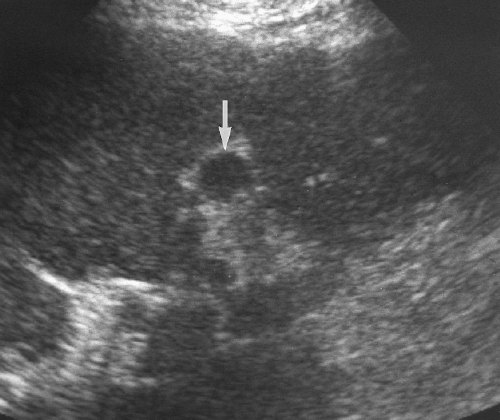 Figure 2.29 Portal Hypertension–Enlarged Paraumbilical Vein. Transverse image shows a dilated paraumbilical vein (arrow) seen as a “hole” in the normally echogenic fissure of the ligamentum teres. Enlarged paraumbilical vein collaterals are definitive evidence of portal hypertension. |
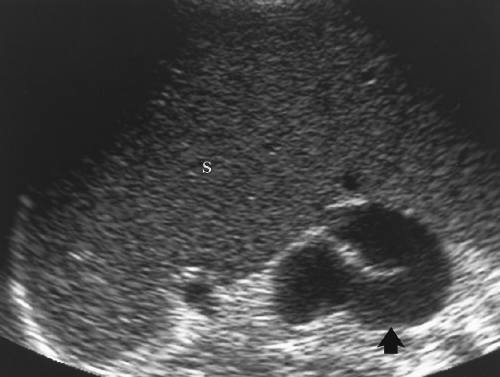 Figure 2.30 Portal Hypertension–Collaterals. The spleen (S) is massively enlarged, and a markedly dilated and tortuous porto-systemic collateral vein (arrow) is seen in the splenic hilum. |
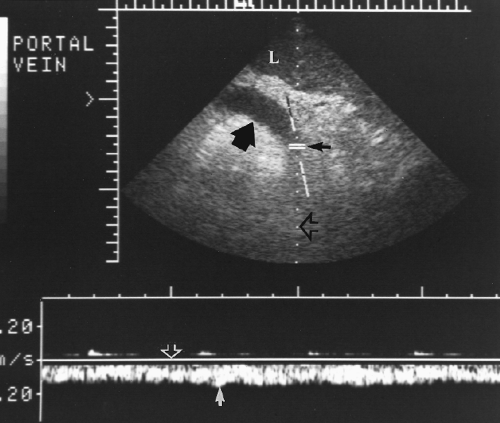 Figure 2.31 Portal Hypertension–Reversed Flow in Portal Vein. Spectral Doppler shows flow in the portal vein (fat black arrow) to be out of the liver (L). The spectral trace (short white arrow) is below the baseline (open white arrow), indicating flow away from the Doppler US pulse shown by the dotted line (open black arrow). When correlated with the anatomic position of the Doppler sample volume (small black arrow), this finding confirms reversed blood flow direction in the portal vein. |
Portal Vein Thrombosis
PV thrombosis occurs in association with cirrhosis, HCC, portal hypertension, hypercoagulable states, pancreatitis, and cholecystitis. Clinical presentation is non-specific.
Color flow US shows complete absence of blood flow or blood flow around an intraluminal thrombus (Fig. 2.32).
Cavernous transformation of the PV refers to PV thrombosis with collateral flow in multiple tortuous collateral vessels that course in the bed of the PV (Fig. 2.33) [28].
Hepatic artery resistance index (RI) is lowered (RI <0.50) by PV thrombosis [29].
Normal color flow US examination excludes the diagnosis.
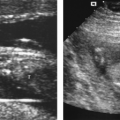
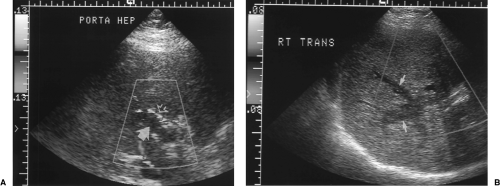 Figure 2.32 Thrombosed Portal Vein. A. Color Doppler image through the porta hepatis shows absence of blood flow in the dilated portal vein (fat arrow). High-velocity turbulent blood flow (mixed colors) is evident in the adjacent hepatic artery (open arrow). B. Transverse color Doppler image of the right lobe reveals extension of blood clot into intrahepatic branches (arrows) of the portal vein (see Color Figure 2.32A, B). |
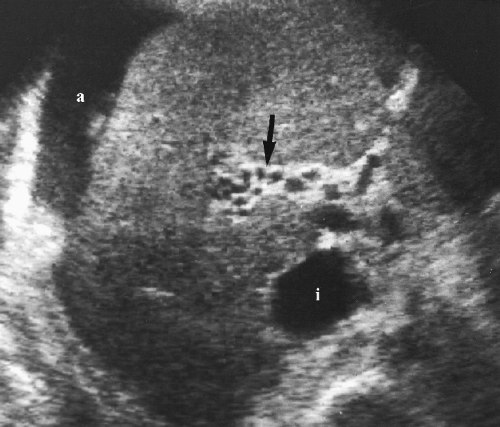 Figure 2.33 Cavernous Transformation of the Portal Vein. Transverse image through the porta hepatis shows multiple small collateral veins (arrow) in the bed of the occluded portal vein. Ascites (a) is present. The inferior vena cava (i) is dilated. |
Passive Hepatic Congestion
Compromise of hepatic venous drainage by congestive heart failure or constrictive pericarditis causes stasis of blood in the liver parenchyma. Elevated central venous pressure is transmitted to the hepatic veins and the hepatic parenchyma. The liver becomes engorged and edematous [30].
The IVC and hepatic veins dilate with increasing central venous pressure. The hepatic veins are considered dilated when their diameter exceeds 9-10 mm [31].
The IVC and hepatic veins lose their normal triphasic pulsatility on spectral Doppler and show an abnormal pattern of continuous blood flow toward the heart [30].
Portal venous blood flow becomes pulsatile as elevated pressure from the right heart is transmitted to the PV [32].
Additional non-specific findings that are commonly present include cardiomegaly, pleural effusions, pericardial effusions, ascites, and hepatomegaly [30].
Budd-Chiari Syndrome
Budd-Chiari syndrome is characterized by obstruction or severe stenosis of hepatic venous outflow at the level of the hepatic veins or extrahepatic IVC. In Western countries Budd-Chiari syndrome is most often caused by thrombosis induced by systemic or malignant diseases. In Asian countries the cause is most often a membranous or segmental obstruction of the IVC. Patients present with abdominal pain, hepatomegaly, and ascites.
Color Doppler shows no flow in one or more of the hepatic veins or the IVC. Retrograde flow away from the IVC into intrahepatic venous collaterals may be seen [33].
Intrahepatic veno-venous collaterals are characteristic. These may appear as large tortuous intrahepatic veins or tiny “spider web” small vessel collaterals deep within the parenchyma or in the subcapsular area [34].
Occlusion of the hepatic veins may result in portal hypertension with reversed flow in the PV and enlarged porto-systemic collateral veins. These changes may reverse after therapy.
Webs appear as echogenic flap-like structures in the IVC near the junction with hepatic veins. IVC occlusion may be short segment (1 cm) or long segment (5 cm). The thrombosed IVC may be calcified [35].
When the syndrome is chronic, the caudate lobe is classically hypertrophied whereas the involved lobes are atrophic. The involved parenchyma is heterogeneous in echogenicity. The caudate lobe drains directly into the IVC via small veins and is typically spared by hepatic vein thrombosis.
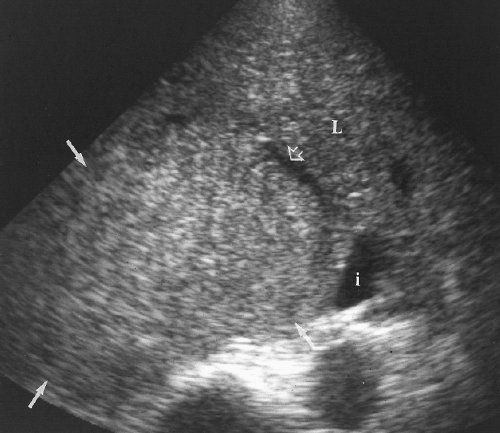 Figure 2.34 Hepatocellular Carcinoma. A large hepatocellular carcinoma (small arrows) replaces the right hepatic lobe and bows the right hepatic vein (open arrow). The margins of the hepatoma are poorly defined. The liver parenchyma (L) is heterogeneous because of cirrhosis. i, inferior vena cava. |
Liver Masses
Hepatocellular Carcinoma
HCC is the most common primary hepatic malignancy. It nearly always occurs in a setting of cirrhosis or chronic hepatitis. Serum alpha-fetoprotein is often elevated.
US findings are usually non-specific in HCC. Tumors occur as a solitary mass (Fig. 2.34), as a dominant mass with small satellite lesions, as multiple nodules, or as diffuse parenchymal infiltration.
Small HCCs (<3 cm) are usually homogeneous, solid, hypoechoic nodules that are difficult to differentiate from regenerative nodules in the cirrhotic liver. A thin peripheral hypoechoic halo corresponding to a fibrous capsule favors HCC [21]. Pulsatile blood flow shown by color Doppler or power Doppler US favors HCC [36].
Larger HCCs are more variable in appearance with heterogeneous solid areas and areas of hemorrhage and necrosis.
Intratumoral fat deposits cause diffuse or focal areas of increased echogenicity. Small HCCs with high fat content are echogenic masses that resemble hemangiomas. Because hemangiomas are uncommon in cirrhotic livers, HCC should always be considered the prime diagnosis.
Many tumors are hypervascular with arteriovenous shunting. Doppler demonstrates high-velocity pulsatile flow most conspicuous in the periphery of the tumor. Color and power Doppler show a fine network of blood vessels around the periphery of the tumor or a branching network of internal vascularity [37].
Tumor invasion of PVs (25-40%) and hepatic veins (16%) is characteristic of HCC. Tumor thrombus is visualized as a low-density plug within a dilated vein (Fig. 2.35). Doppler shows complete venous occlusion or flow around a partially obstructing thrombus. Extension of tumor into the IVC is a cause of Budd-Chiari syndrome.
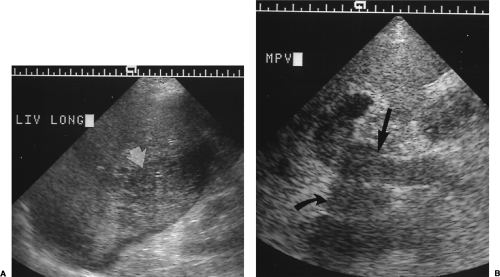 Figure 2.35 Hepatocellular Carcinoma with Portal Vein Invasion. A. A hepatocellular carcinoma (arrow) is seen as an irregular heterogeneous hypodense mass in the inferior right lobe. B. The tumor (curved arrow) invades the portal vein, filling and expanding the vein with tumor thrombus (straight arrow). |
Fibrolamellar Carcinoma
Fibrolamellar carcinoma is a distinct variant of HCC in its clinical, pathologic, and imaging features. It is characteristically found in adolescents and young adults who lack the risk factors for HCC. Hemorrhage and necrosis are characteristically absent from the tumor [38].
A large, lobulated, well-defined hepatic mass in a young person (mean age, 23) is characteristic (Fig. 2.36) [38].
A central stellate fibrous scar is common. The scar may include calcification that is also stellate in appearance.
Echotexture is variable and usually mixed with hyperechoic and isoechoic components [38].
Hemorrhage, necrosis, vascular invasion, and multifocal disease are usually conspicuously absent.
The major differential diagnosis is focal nodular hyperplasia (FNH).
Hepatic Cavernous Hemangioma
Cavernous hemangioma is the most common primary neoplasm of the liver. Fortunately, all are benign with no malignant potential. Most cause no symptoms and are discovered incidentally by US or CT. Hemangiomas consist of a mass of blood-filled vascular channels lined by endothelial cells. Thrombosis in the vascular channels leads to fibrosis, scarring, and calcification.
The characteristic US appearance is a well-defined, homogeneous, hyperechoic solid mass (Fig. 2.37). Accentuated through-transmission is often present. High echogenicity is produced by the numerous interfaces of the interlacing vascular spaces. Acoustic enhancement results from the fact that the lesion is mostly slow-flowing liquid blood.
The demonstration of a liver mass with these classic features is considered sufficient to make a definite diagnosis of hemangioma by many radiologists, particularly if the patient has no history of malignant disease and if liver chemistries are normal [39].
When lesion size is >3 cm, thrombosis and scarring commonly result in an ill-defined central hypoechoic zone. Calcification may be present within the hypoechoic zone. Lesions with large hypoechoic areas have a characteristic thin hyperechoic border [40].
In 10% of patients, multiple hemangiomas are present, often raising concern for metastatic disease.
In a fatty-infiltrated liver, hemangiomas may appear hypoechoic compared to the abnormal liver parenchyma (Fig. 2.38).
Most cavernous hemangiomas remain stable in size over time [41]. However, lesions that double or triple in diameter have been reported [42].
Blood flow within hemangiomas is exceedingly slow. Typically, color and spectral Doppler will show no detectable signal within the lesion [43]. Power Doppler may show a diffuse color “blush” believed to be caused by the architecture of the lesion rather than
by blood flow [44]. Doppler findings are not specific for hemangiomas, because metastatic lesions may also show the absence of internal vascularity [43].
A specific diagnosis of cavernous hemangioma can be made by radionuclide-labeled, red blood scintigraphy and by contrast-enhanced CT and MR [45].
Atypical appearance on imaging studies may lead to image-guided biopsy. Fine needle aspiration yields only blood and endothelial cells, results usually considered inadequate for a specific diagnosis. Core biopsy with an 18-gauge needle has been shown to be definitive and safe [46]. The needle path selected for biopsy should always pass through normal parenchyma before entering the lesion to prevent unimpaired bleeding into the peritoneal cavity.
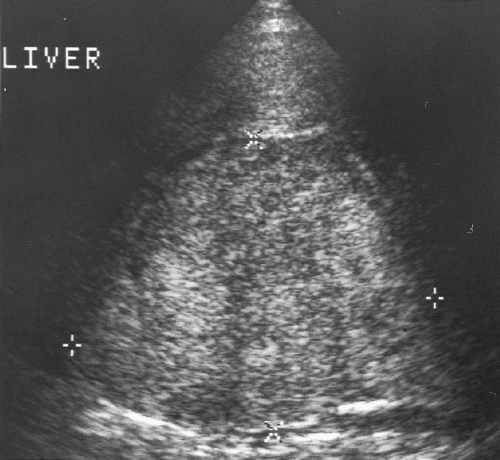 Figure 2.36 Fibrolamellar Carcinoma. A heterogeneous but rather well-defined solid mass is measured between the cursors (+, x). The patient is a 37-year-old male with no clinical or imaging evidence of hepatitis or cirrhosis. |
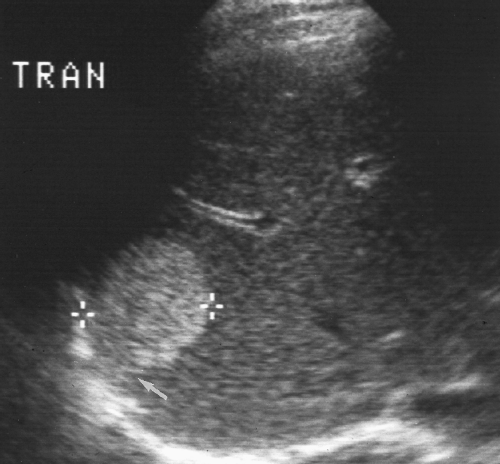 Figure 2.37 Classic Appearance of Cavernous Hemangioma. A solid, well-defined, uniformly echogenic mass is indicated by the cursors (+). Accentuated through-transmission (arrow) is seen distal to the mass. Color Doppler demonstrated no Doppler signal within the mass. Blood flow is usually too slow to be detected by Doppler. |
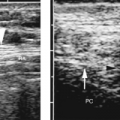
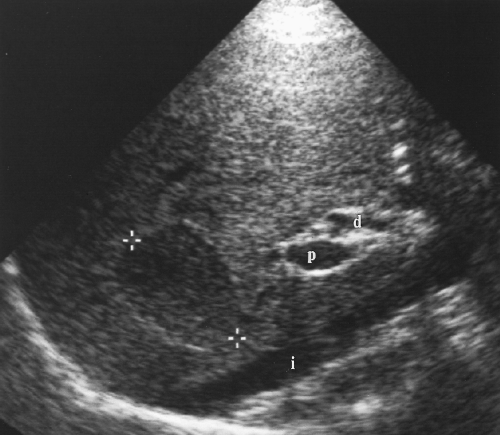 Figure 2.38 Cavernous Hemangioma in Fatty Liver. The cavernous hemangioma (between cursors, +) is well defined and uniformly low in echogenicity compared to the diffusely fatty infiltrated liver. d, common bile duct; i, inferior vena cava; p, portal vein. |
Focal Nodular Hyperplasia
FNH is the second most common benign tumor of the liver. The lesion is a proliferation of nonneoplastic hepatocytes held together in abnormal arrangement by a network of fibrous tissue with a dominant scar [47]. Abundant, thick-walled arteries and sinusoids lined by endothelial and Kupffer cells are present within the mass. FNH is more common in women and is usually discovered as an incidental finding.
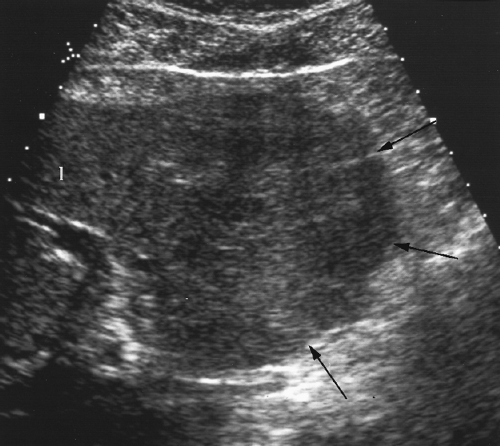 Figure 2.39 Focal Nodular Hyperplasia. The mass is recognized by the focal bulge (arrows) it produces in the liver contour. Its echogenicity is isoechoic to liver parenchyma (l). Note the slightly altered echotexture and lack of portal triads in the mass. |
The lesion is typically solitary (80-95%) and homogeneous. Because of its excellent blood supply necrosis and hemorrhage are rare. Most lesions are smaller than 5-cm diameter [47].
US shows a homogeneous solid mass that is isoechoic or slightly hypoechoic compared to normal liver parenchyma (Fig. 2.39) [47]. Only surface mass effect or displacement of vessels may identify the mass.
A central scar with fibrous septations extending from it is a characteristic finding often not shown well by US. When seen, the scar is echogenic and hypervascular. The central hypervascular nidus may be shown by color flow US even when the scar is not evident [47].
Radiocolloid scintigraphy is commonly diagnostic. Because of the presence of Kupffer cells in FNH, radionuclide activity within the lesion is equal to or greater than normal liver in 50-70% of lesions.
On follow-up, the lesions may decrease in size or disappear [48].
Calcifications are an atypical feature of FNH. When present the lesion is difficult to differentiate from fibrolamellar carcinoma [49].
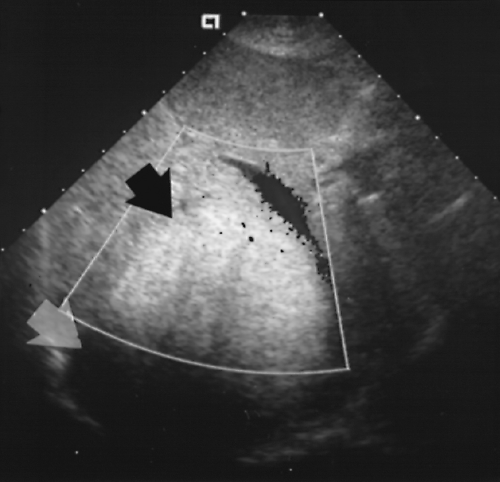 Figure 2.40 Hepatic Adenoma. This hepatic adenoma (black arrow) is strikingly echogenic and causes marked attenuation of the US beam (white arrow). These findings are caused by high fat content of the tumor confirmed by its low density on computed tomography and on pathologic examination following surgical resection. |
Hepatocellular Adenoma
Hepatocellular adenoma (HA) is a rare benign neoplasm of hepatocytes proliferating in an abnormal pattern that lacks portal triads, central veins, and Kupffer cells [47]. The tumor is seen most often in women and may be related to use of oral contraceptives. Multiple HAs are seen in association with glycogen storage disease, type I (von Gierke’s disease). Hemorrhage is common and malignant degeneration may occur. Surgical removal is recommended.
Lesions are typically solitary, solid, and may be hypoechoic (20-40%), hyperechoic (30%), or mixed (50%). Fat is sometimes present with the tumor causing focal or diffuse areas of increased echogenicity (Fig. 2.40).
HA tends to be larger than FNH at discovery with an average size of 10 cm [47]. HA lacks the central scar characteristic of FNH.
Color Doppler shows intratumoral veins usually 1-5-mm diameter with characteristic continuous flat venous flow [50].
Hemorrhage may occur into the tumor with rupture into the peritoneal cavity.
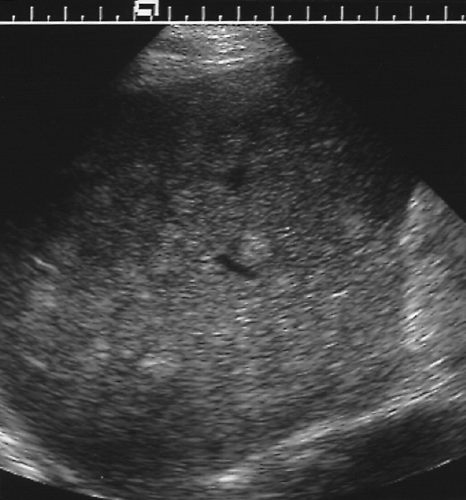 Figure 2.41 Multiple Metastases from Breast Carcinoma. The liver is riddled with numerous small echogenic nodules.
Related posts:Stay updated, free articles. Join our Telegram channel
Full access? Get Clinical Tree
 Get Clinical Tree app for offline access

|