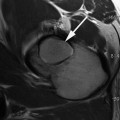
Fig. 6.1
International prevalence of femoroacetabular impingement morphology
In a study of asymptomatic male Swiss army recruits, the prevalence of the cam deformity detected on radial MRI slices was 24 % overall [13]. When the recruits with limited hip internal rotation were selected from the entire group, the prevalence of the cam deformity increased to 50 % [13]. A separate study of this same cohort found that cam deformities were associated with an increased risk of damage to the labrum and cartilage (relative risk 2–3 depending on the specific type of lesion) [14]. A study of asymptomatic Swiss females found that no female had a definite cam deformity, but the prevalence of a possible or mild cam deformity was 22 % [15]. Labral lesions were observed in 19 % of these women, but given the smaller nature of the cam deformity no statistical correlations between cam deformities and labral tears were found [15]. Other studies examining the prevalence of the cam deformity or decreased head–neck offset have found rates ranging from 12 to 35 % in the normal population, with males having three to five times the rates of those seen for females (Table 6.1) [16–19]. Similarly, males also seem to have higher rates of bilateral deformities than females, with 25 % of males and 6 % of females having bilateral cam deformities in one series [19]. When femoral asphericity was evaluated in a series of patients who had abdominal CTs for reasons unrelated to their hips, 74 % of the cohort had asphericity in at least one plane, and for 66 % of the cohort the asphericity was bilateral [18].
Table 6.1
International prevalence of FAI pathoanatomy
Country/ region | Prevalence | References |
|---|---|---|
China (Beijing) | CEA >35°: 11 % (F); impingement angle <70°: 3.5 % | Dudda et al. [33] |
India | 11.8 % (low head–neck offset) | Malhotra et al. [78] |
Denmark | Deep socket M: 15.2 %, F: 19.4 % | Gosvig et al. [16] |
Pistol grip M: 19.6 %, F: 5.2 % | ||
UK | Cam M: 18 %, F: 11.9 % | Pollard et al. [74] |
Pincer M: 16.7 %, F: 21.1 % | ||
New Zealand | Retroversion 14 % | Kang et al. [18] |
Overcoverage 16 % | ||
Cam 22 % | ||
Switzerland | M: 24 % definite cam, F: 22 % mild/possible cam | |
US | M: 29 % (AP image only) | |
F: 23 % CEA >35°, 12 % impingement angle <70° | ||
Turkey | CEA >35°: 32.5 % | Sahin et al. [40] |
Alpha angle >50°: 45 % | ||
Norway | Cam M: 35.0 %, F: 10.2 % | Laborie et al. [19] |
Pincer M: 34.3 %, F: 16.6 % | ||
Canada | Cam M: 51.7 %, F: 18.9 % | Hack et al. [17] |
Femoral version also affects the biomechanics of the hip. Femoral retroversion is thought to exacerbate the inclusion damage caused by cam impingement by limiting the amount of flexion and internal rotation that is possible before impingement occurs [20–22]. Conversely, femoral anteversion may mitigate the effect of an anterior cam deformity, but may be a cause of increased static stress or instability at the anterior acetabulum [20, 21] or psoas tendon [23]. Femoral version has been examined in several studies. In the Hahmann-Todol osteologic collection, adult males less than 40 were found to have an average version of 8.9 ± 8.3°, while females had slightly more anteversion, with an average of 11.4 ± 7.5° [24]. A CT-based study of femoral version found an average version of 4.5–5 ± 8° [25]. There may also be some ethnic variation to femoral version. A study comparing Caucasians to ethnic Chinese in Hong Kong observed average versions of 7° and 10° in Caucasian males and females, respectively, whereas the average version in the ethnic Chinese cohort was 14° and 16° for males and females, respectively [26]. The normal distribution of femoral version has also been characterized (Fig. 6.2) [27, 28]. Femoral version has a bell-shaped distribution, ranging from −17° to 38° [28]. In these studies, between 9 and 15 % of femurs were retroverted—i.e., with version ≤0° [27, 28]. Similar percentages of femurs were excessively anteverted, with 8–13 % having version >20° [27, 28].
Acetabular Anatomy
Acetabular anatomy has historically been studied in the context of acetabular dysplasia, with the lateral center-edge angle (CEA) on an anteroposterior (AP) pelvis X-ray used as the most common measure of acetabular coverage. Studies using CT to measure lateral CEA in a normal asymptomatic adult population found average CEAs of 30–31 ± 4° [25] and 37–38 ± 7° [29], with an overall range of 22–55° [26, 29]. The prevalence of dysplasia in both newborns and adults is known to vary widely, depending on the population being studied (Fig. 6.3, Table 6.2), and the average CEA varies accordingly. In adults, rates of dysplasia (CEA less than 20°) range from 1 % of females in Turkey [30] and 1.4 % of Saudi Arabian adults [31], to 17 % in the Sami population [32] and 22 % in Chinese women around Beijing [33]. For infants, rates of hip instability as detected by clinical exam range from 0 % in the Bantu people of South Africa and Zimbabwe to 33 % in the Cree-Ojibwa Native American tribes [34].
Fig. 6.3
International prevalence of adult hip dysplasia
Table 6.2
International prevalence of adult dysplasia
Country/region | Prevalence | References |
|---|---|---|
Saudi Arabia | 1.4 % (all mild w/CEA <25°, no <20°) | Moussa and Alomran [31] |
Korea | M: 1.3 % (CEA <20°), F: 2.2 % | Han et al. [104] |
Turkey | M: 2.5–9.8 % (CEA <25°), F: 1.0–9.8 % (CEA <25°) | |
France | M: 1.8 %, F: 5.6 % | Inoue et al. [93] |
UK | M: 2.4 % (CEA <25°), F: 4 % | Yoshimura et al. [88] |
Nigeria | M: 3.3 % (CEA <25°) | Ali-Gombe et al. [90] |
Denmark | 3.5–5.5 % (CEA <20°) | |
M: 4.3 %, F: 3.6 % | ||
Netherlands | 4.8 % (CEA <25°) | Reijman et al. [55] |
Hong Kong | M: 4.5 % (CEA <25°) 10 % (majority w/CEA 20–25°), F: 9.9 % | |
US | 7 % (F, CEA <20°) | Dudda et al. [33] |
Singapore | 7.3 % (CEA <20°) | Umer et al. [106] |
Malawi | M: 11.5 %, F: 13.2 % | Msamati et al. [107] |
Japan | M: 5.1–16 % (CEA <25°), F: 11.6–41 % | |
Norway (Sámi, above Arctic Circle) | 17 % (CEA <20°) | Johnsen et al. [32] |
38 % (CEA <25°) | ||
China (Beijing) | 21.7 % (F, CEA <20°) | Dudda et al. [33] |
In contrast, there are only a few studies that have evaluated the prevalence of acetabular overcoverage and acetabular retroversion, which is the pathoanatomy on the acetabular side that can contribute to FAI. In studies of Caucasians, acetabular overcoverage or increased acetabular depth was observed in 10–15 % of hips [15, 16, 18, 19] and was bilateral in 75–77 % of these patients [16, 18]. Although the most precise way to measure acetabular version is with axial MRI or CT images of the pelvis, a centered AP pelvis X-ray can also provide information about version. The crossover sign is present when the shadow of the anterior acetabular wall crosses over that of the posterior wall. The posterior wall sign is present when the posterior wall lies medial to the center of rotation of the femoral head. A CT study of the acetabular version in asymptomatic adults found the average version to be 26–27 ± 6° [25]. The prevalence of the crossover sign is extremely variable and somewhat technique-dependent; in one study 51 % of males and 45 % of females had a crossover sign on AP pelvis images [19], whereas other studies have observed the crossover sign in only 14 % [18] and 6 % [35] of asymptomatic adults. When the posterior wall sign was assessed in a larger population, it was observed on the AP pelvis images of 23 % of males and 11 % of females [19]. Regardless of the radiographic measure, acetabular retroversion is not uncommon and may be associated with other hip disorders, including osteoarthritis, dysplasia, and Perthes’ disease [35].
Association Between Hip Deformity and OA in the General Population
The prevalence of FAI is known to be greatly increased in patients presenting with hip pain, adductor strain, labral tears, and athletic pubalgia, and in some series is seen in as many as 90 % of these patients [36–38]. In a multicenter study of French patients presenting with hip pain and who were candidates for hip arthroscopy, 63 % had evidence of FAI. Of the FAI patients, 58 % were found to have pure cam impingement, 19 % had pure pincer impingement, and 23 % had evidence of mixed impingement [39]. The prevalence of FAI is also increased in the contralateral hip of patients who have previously undergone total hip arthroplasty, with 84 % of arthroplasty patients having cam deformities as compared to 32 % of controls with no past history of hip pain [40]. One caveat to these findings is that reactive osteophytes also can form at the head–neck junction and be misinterpreted as a primary cam deformity. Similarly, reactive osteophytes also form on the acetabular rim obscuring the original anatomy that initiated the arthrosis.
The prevalence of dysplasia in patients presenting with hip pain is also significant. In the UK, 24 % of patients over 40 presenting with new hip pain were found to have a lateral CEA <25° [41] and 35 % of patients in the French study of potential hip arthroscopy candidates were found to have dysplasia [39]. In the French study, a total of 95 % of patients presenting with hip pain were found to have either dysplasia or FAI [39].
As part of the work developing the mechanical concept of hip arthrosis, Harris, Solomon, and Murray looked at the prevalence of subtle deformities in “primary” osteoarthritis, finding rates of deformity ranging from 65 to 79 % [1–3]. It is likely that the prevalence of subtle deformity is actually higher, however, as these early studies evaluated only AP pelvis X-rays and there was no evaluation of acetabular overcoverage or acetabular retroversion.
Mild dysplasia was observed in 20–39 % of patients with idiopathic hip arthrosis [1–3]. All of these series found a much higher prevalence of dysplasia in females as compared to males. Murray’s series had a male to female ratio of 10:41 for mild dysplasia [1], Solomon’s series had a male to female ratio of 1:10 [2], and Harris observed mild dysplasia in 15 % of males but 68 % of females [3]. The gender ratio was reversed when looking at the “head tilt” and “pistol grip” deformities. Harris carefully described the spectrum of pistol grip deformities as flattening of the normally concave surface of the lateral femoral neck, development of a bump on the anterolateral surface of the femoral neck, the formation of a sharp transition or “hook” at the junction of the articular surface of the femoral head with the femoral neck, and failure of the femoral head to be centered over the femoral neck in either the AP pelvis, frog, or true lateral X-rays [3]. These deformities currently would be considered cam morphology, but at that time were considered “deformities that occurred after minimal slipping of the capital femoral epiphysis and mild cases of Legg–Perthes disease” [3]. In both Murray and Harris’ series, 40 % of patients with primary osteoarthrosis had pistol grip deformities, with a male to female ratio of 66:10 for Harris [3] and 67:12 for Murray [1]. Solomon’s series included patients with secondary causes of arthrosis, but he also observed a predominance of the head tilt in males, with a male to female ratio of 14:1 [2].
Contemporary studies have examined the radiographs of younger patients (<55 or 60 years old) undergoing total hip arthroplasty for osteoarthritis. All of the currently available literature is, however, level III or IV prognostic evidence [42] from X-ray data. When patients who have dysplasia, Perthes’ disease, and inflammatory arthropathy are excluded, the prevalence of FAI in the remaining population is exceedingly high—96–97 % [43, 44]. Looking specifically at the anatomy of the acetabulum, retroversion or overcoverage is seen in 20–45 % of these patients [35, 44].
While the cam deformity is easily and classically seen in males, the anatomy causing idiopathic arthrosis in females may be a subtler radiographic finding. In elderly white females, lateral flattening of the femoral head on an AP pelvis X-ray was associated with progressive arthrosis [45]. Females are known to have smaller cam deformities than males [6, 46, 47] and this may be the female equivalent of a subtle pistol grip deformity. Femoral head flattening is also seen in dysplasia [48, 49]. Without additional imaging, the precise anatomy causing the femoral head flattening and subsequent arthrosis is unclear.
Radiographic rates of arthrosis progression for patients with FAI are also variable. In a study of Greek patients who had radiographic evidence of FAI, after 10 years only 18 % had radiographic progression of arthrosis, regardless of whether they had cam, pincer, or mixed-type FAI [50]. When compared to other European countries, however, the overall prevalence of hip arthrosis in Greece is very low (Fig. 6.4, Table 6.3) [51]. Thus, some other environmental or genetic factor may also be influencing the progression of arthrosis in this population. In contrast, other studies have found much higher rates of progression. Of US patients who underwent unilateral total hip arthroplasty for FAI-related arthrosis, 73 % showed either progression of at least one grade of radiographic arthrosis or underwent total hip arthroplasty at an average of 5 years after their first arthroplasty [43]. Another study of FAI patients in the UK observed radiographic progression of osteoarthritis in 65 % of patients over 10 years [52]. A population-based case–control study of women in the UK obtained AP pelvis radiographs 19 years apart, allowing the investigators to evaluate risk factors for hip arthroplasty [53]. There was a higher prevalence of both acetabular dysplasia and of cam deformities in women who underwent arthroplasty [53]. There is one study that attempted to determine if the size of the cam deformity or amount of acetabular coverage correlated with the age at the time of total hip arthroplasty. With the numbers available, however, no variable was predictive of the age at surgery [54].
Fig. 6.4
International prevalence of primary hip arthrosis
Table 6.3
International prevalence of “idiopathic” or primary hip osteoarthritis
Country/region | Prevalence | References |
|---|---|---|
Saudi Arabia | 0.04 % | Ahlberg et al. [80] |
India | M: 0.08 %, F: 0.1 % | Mukhopadhaya and Barooah [81] |
Greece | 0.9 % M: 0.3 %, F: 1.5 % | Andrianakos et al. [51] |
Malaysia | M: 0.7–1.7 %, F: 1.2–4.4 % | Veerapen et al. [82] |
China (Beijing) | 0.03–2.0 %, M: 1.1 %, F: 0.9 % | |
Hong Kong | M (>70): 1.2–5.4 %, F: 0.8 % | |
Korea | M: 1.7 %, F: 1.8 % | Chung et al. [87] |
Japan | M: 0–1.4 %, F: 2–3.5 % | Yoshimura et al. [88] |
Jamaica | M: 1–2 %, F: 4 % | Lawrence and Sebo [89] |
Liberia | M: 3 %, F: 2 % | Lawrence and Sebo [89] |
Nigeria | M: 3–7.0 %, F: 2 % | |
South Africa (Black, Tswana, Phokeng) | M: 3–4.9 %, F: 0.7–3 % | |
Brazil | 4.7 % | Senna et al. [92] |
France | M: 5.7 %, F: 2.5 % | Inoue et al. [93] |
Norway (Oslo) | M: 4.6 %, F: 6.2 % | Grotle et al. [94] |
Norway (Sámi, above Arctic Circle) | M: 3.9–8.8 %, F: 6.3–11.1 % | Johnsen et al. [59] |
Denmark | M: 4.9–7.5 %, F: 2.0–7.9 % | |
Sweden (Malmö) | 1.1–9.8 % | Danielsson and Lindberg [95] |
Netherlands | M: 2.8–11.8 %, F: 1.7–14.8 % | Van Saase et al. [96] |
Spain | 7.4 % M: 6.7 %, F: 8.0 % | Quintana et al. [97] |